A Closer Look at Q3 2024 Fund Flows: Key Trends in Active ETFs and ETF Launches

In the third quarter of 2024, fixed-income ETFs and mutual funds maintained their momentum, attracting $119.1B in combined inflows, a significant rise from $68.4B in the second quarter. This surge likely resulted from investors seeking to secure yields in anticipation of the Federal Reserve’s rate cuts, which began in September.
Money market funds outpaced other categories this quarter, recording $318.6B in inflows—a recovery from the $26.2B outflows observed in Q2. This shift indicates a strong investor preference for safer, more liquid assets during periods of uncertainty.
Conversely, equity funds experienced a slight downturn, with $1.9B in net outflows, a reversal from the $14B in inflows in the previous quarter. This trend was primarily driven by a persistent withdrawal from mutual funds, considering nearly all ETF equity styles managed to achieve net-positive inflows during the third quarter.
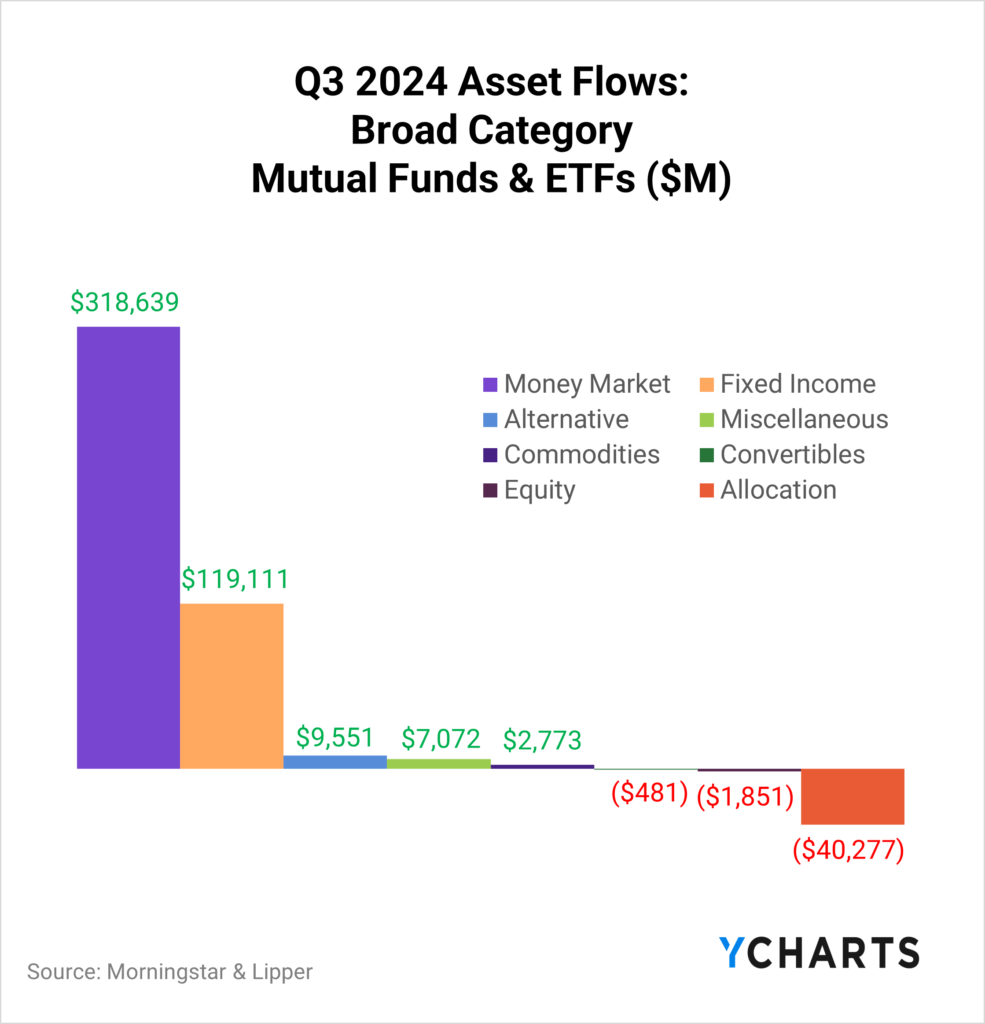
Read on to see how money moved in and out of strategies in more specific categories, as defined by our data providers.
YCharts clients sign up for YCharts’ full Fund Flow Report sent directly to your inbox.
For a more nuanced look at monthly flows, sign up for a copy of our Fund Flows Report and Visual Deck (clients only):Active ETFs vs Passive ETFs
The rise of active ETFs reflects a growing preference among wealth managers for these dynamic investment vehicles in a tax-efficient ETF wrapper. According to a 2023 survey conducted by the Money Management Institute, 42% of asset managers already support active ETFs, and an additional 33% plan to introduce them soon.
This trend is driven by demand from wealth managers, with 89% using active ETFs and 42% planning to increase their usage. Of those currently using active ETFs, 42% have expressed their intention to increase their focus on this investment option, according to the survey.
Q3 flow data reveals the real-time demand for these products. Nearly a quarter of ETF flows went into active funds despite them making up just over 7% of ETF AUM.

Download Visual | Get in Touch to Access the Smart Beta Screen
In Q3 2024, fixed-income ETFs captured $86.7B in inflows, with active strategies accounting for $26.8B or 31% of this total, despite representing under 15% of the total fixed-income ETF AUM as of September 30th. Additionally, between September 2023 and September 2024, active fixed-income ETFs attracted $75B, making up 31% of the $242.4B directed to fixed-income strategies during this period.

Download Visual | Get in Touch to Access the Smart Beta Screen
In the equity ETF category, active equity ETFs accounted for 21% of inflows both in Q3 2024 and 22.7% during the period from September 2023 through September 2024, despite making up under 10% of AUM.

Download Visual | Get in Touch to Access the Smart Beta Screen
Which ETFs are Beating the S&P 500 (and other benchmarks)?
The S&P 500 posted a 22.08% total return through the first nine months of 2024, a mark that only 260 equity ETFs surpassed in the period.
This limited number of outperformers is primarily attributed to the dominance of major technology stocks, which accounted for 49% of the index’s gains in the first half of the year. Subsequently, a significant broadening in participation from non-tech sectors contributed to gains in the third quarter. Successfully navigating the shift from concentrated gains to broader market participation proved to be challenging or perhaps was not a targeted strategy for most fund managers.
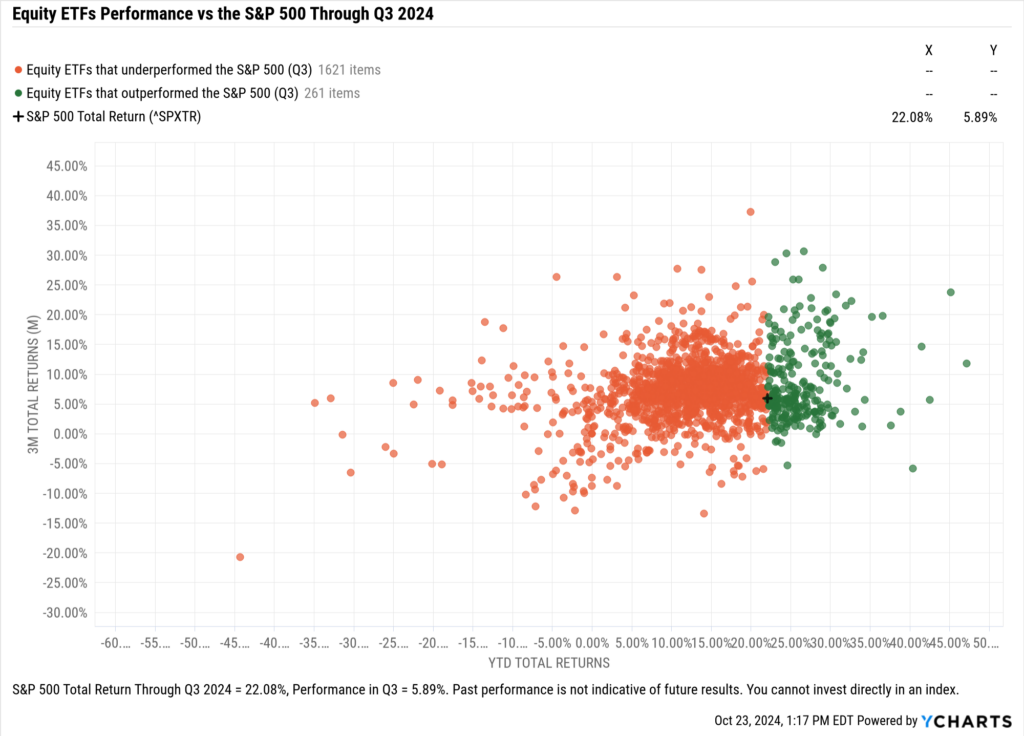
Download Visual | Get in Touch to Access this Chart | Modify in YCharts
Regardless of how the index achieved its performance, the high standards set by the S&P reinforces why, according to State Street’s 2024 ETF Impact survey, 98% of institutional investors use the S&P 500 as a benchmark for most or some investments.
Large Cap ETFs vs the S&P 500
When looking exclusively at large-cap ETFs, less than a quarter of strategies (22.5%) outperform the S&P 500. Note: The percentage of outperformers is as of the end of September 2024; the linked screen will update monthly.
Some of the large-cap strategies with the best performance through the first three quarters of the year are the Invesco S&P 500® Momentum ETF (SPMO), Miller Value Partners Appreciation ETF (MVPA), and TCW Transform Systems ETF (NETZ), with respective returns of 38.8%, 32.1%, and 30.8% as of September 30, 2024.
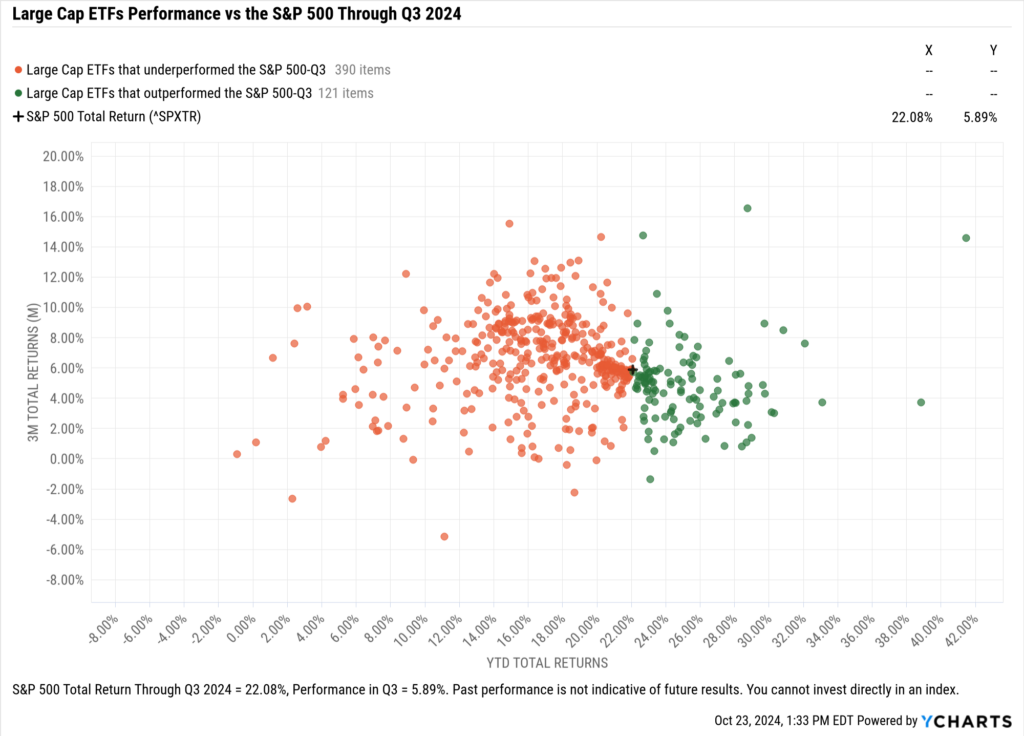
Download Visual | Get in Touch to Access this Chart | Modify in YCharts
Active ETFs vs the S&P 500
Excluding income-centric or defined outcome ETFs that use options strategies to meet their objectives (according to Morningstar categorization), over 40% of large-cap active ETFs managed to outperform the S&P 500 during the first half of 2024. However, this number significantly declined over the next three months, with nearly a quarter of active managers (59 out of 240) surpassing the index’s 22.08% total return mark through the first nine months of the year. Note: The percentage of outperformers is as of the end of September 2024; the linked screen will update monthly.
Some of the large-cap active strategies with the best performance through the first half of the year are the Miller Value Partners Appreciation ETF (MVPA), TCW Transform Systems ETF (NETZ), and the American Century Focused Dynamic Growth ETF (FDG) with respective returns of 32.1%, 30.8%, and 30.1%.
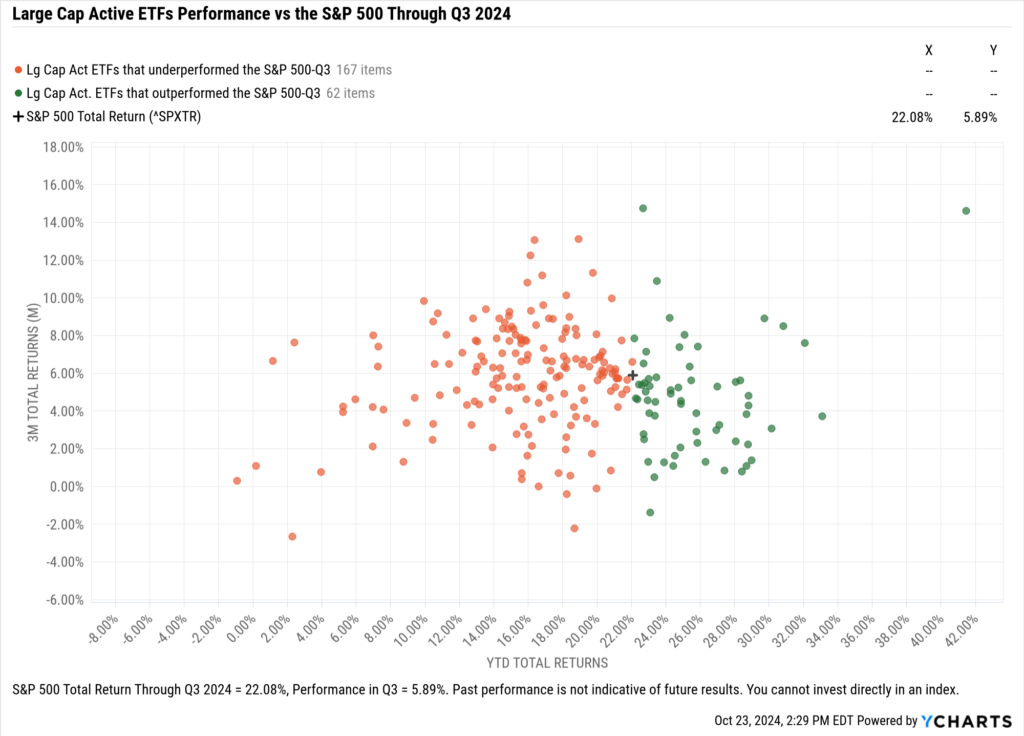
Download Visual | Get in Touch to Access this Chart | Modify in YCharts
Active Fixed Income vs the AGG
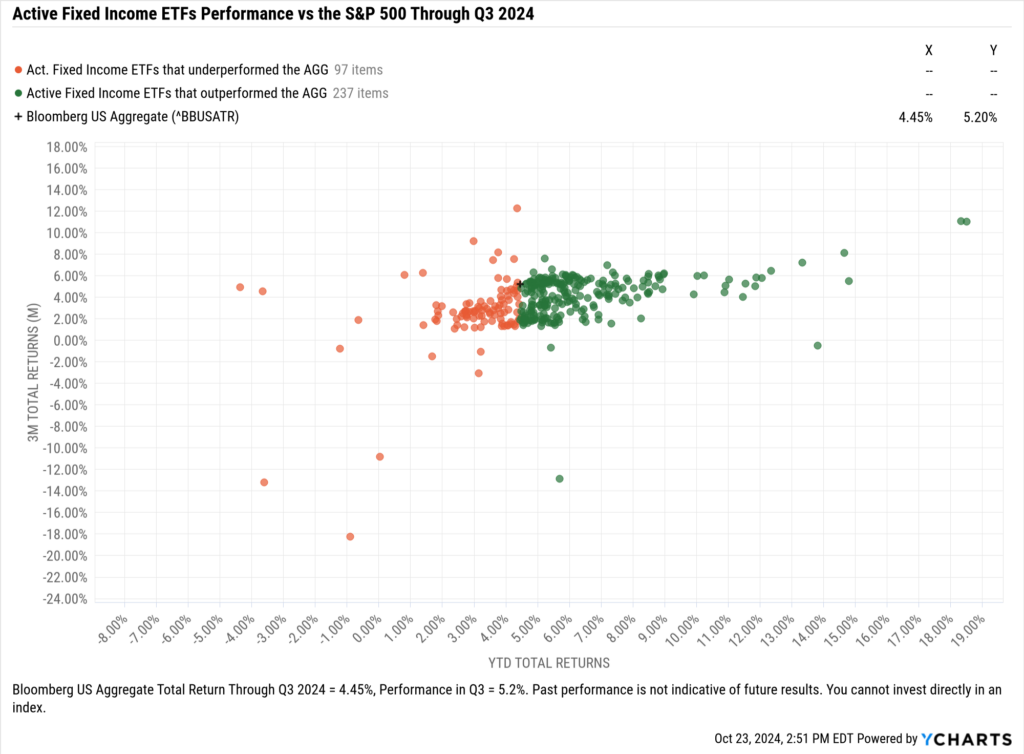
When it comes to the fixed-income sleeve of investor portfolios, more active strategies outperformed the broad asset class’ benchmark, the Bloomberg US Aggregate Index, which produced 4.45% total returns in 2024 through the end of Q3. 57.9% of active fixed-income ETFs beat that mark, albeit there is less of a one-size-fits-all approach to benchmarking fixed-income strategies. Note: The percentage of outperformers is as of the end of September 2024; the linked screen will update monthly.
Of the outperformers, the top three funds on a YTD total return basis as of September 30, 2024, were the Rareview Dynamic Fixed Income ETF (RDFI), Virtus InfraCap US Preferred Stock ETF (PFFA), and Aptus Defined Risk ETF (DRSK), which produced respective returns of 18.5%, 18.3%, and 14.8%.
Download Visual | Get in Touch to Access this Chart | Modify in YCharts
Q3 2024 Inflows and Outflows for Equity ETFs
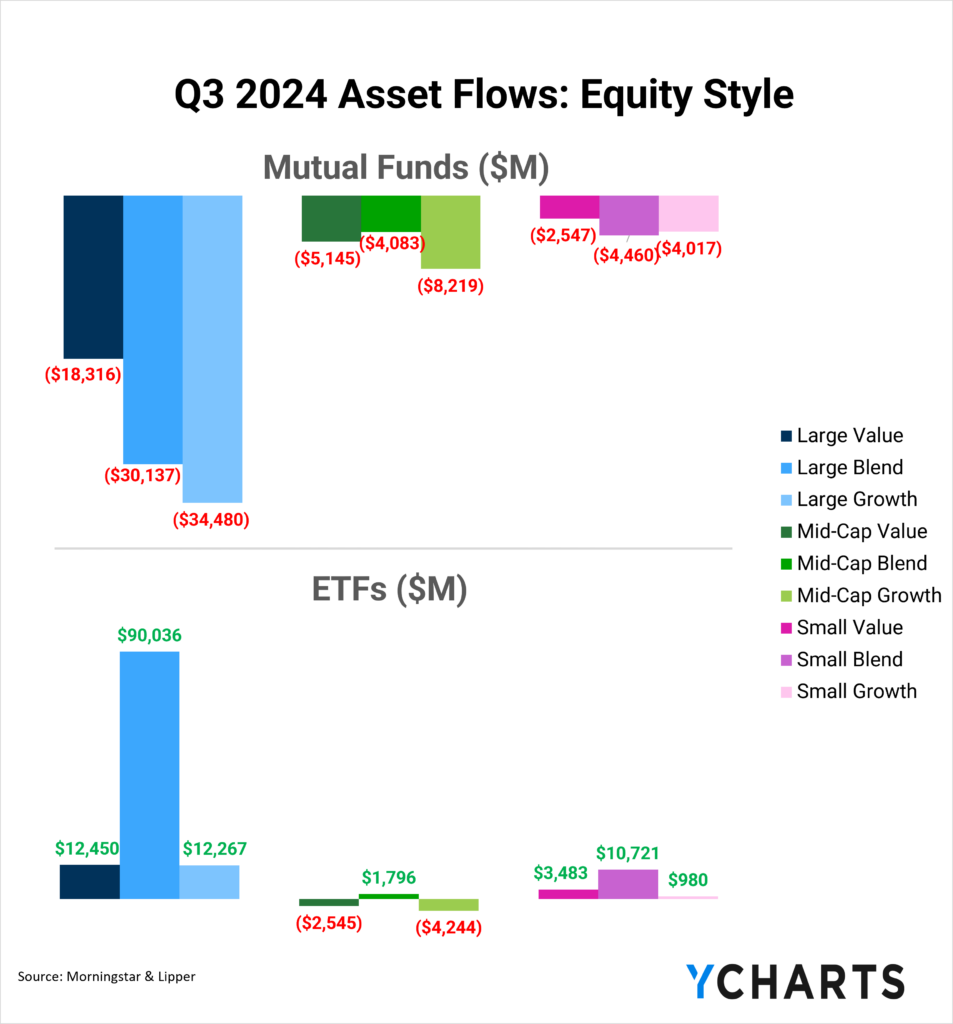
In Q3, Large Blend, Small Value, and Small Blend were the only equity styles to see combined net inflows across mutual funds and ETFs. That said, all of the positive momentum came from ETFs, as Mutual funds across the style box saw net outflows, including over $30B leaving each of Large Blend and Growth style mutual funds in the quarter.
ETFs, on the other hand, had positive flows in every style box except Mid-Cap Value and Growth. Large Blend ETFs were the big winners, reeling in over $90B in net new assets in Q3.
Here are some of the most popular and unpopular ETF categories and strategies based on Q3 flow data:
Inflows in Large Blend ETFs
Large Blend ETFs attracted $90B in Q3 and $182.1B through the first nine months of the year, helping propel the category’s assets to $2.9T.
The fastest-growing funds in the category (that are at least one year old) this quarter based on quarterly flows as a percentage of AUM are the AB US Large Cap Strategic Equities ETF (LRGC), THOR Low Volatility ETF (THLV), and FlexShares US Quality Large Cap ETF (QLC), with their quarterly flows representing 31.6%, 31.6%, and 29.4% of their AUM, respectively.
Biggest Large Blend ETFs Fund Flows
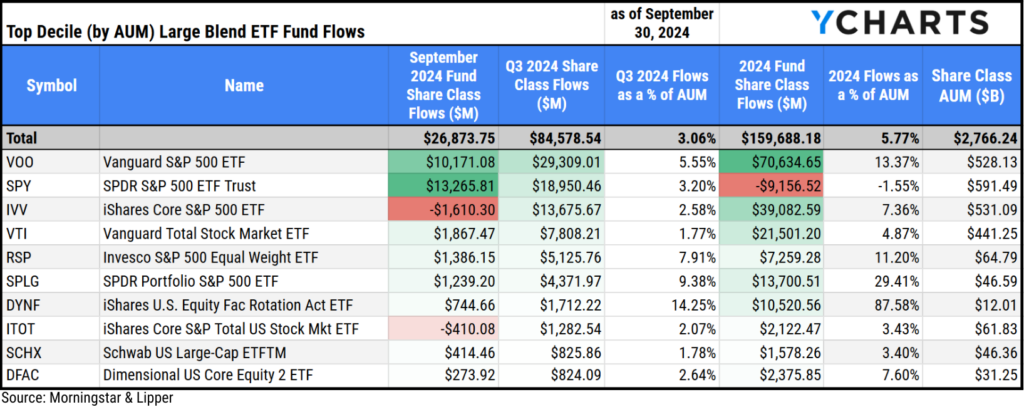
To avoid the monotony of presenting the same large blend ETFs month after month, we’ve broken this category up by AUM size. Starting with the top decile of funds (by AUM), which includes 28 ETFs. The Vanguard S&P 500 ETF (VOO) brought in $29.3B in Q3, representing 5.6% of its AUM, and the $70.6B it has attracted since January–the most in the category)–represents 13.4% of its AUM as of September 30, 2024.
The second most popular fund this quarter was the SPDR® S&P 500® ETF Trust (SPY), which pulled in $19B, representing 3.2% of its AUM; the third most popular fund was the iShares Core S&P 500 ETF (IVV), which netted $13.7B in the quarter, accounting for 2.6% of its AUM.
Download Visual | Modify in YCharts
Second Biggest Large Blend ETFs Fund Flows
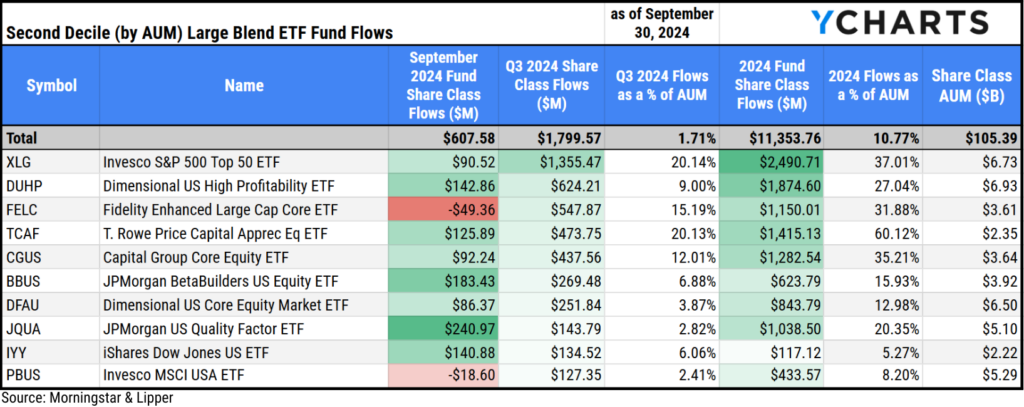
In the second decile (by AUM) of large blend ETFs, which contains 28 ETFs, the Invesco S&P 500® Top 50 ETF (XLG) was the clubhouse leader with $1.4B in inflows in Q3.
The Dimensional US High Profitability ETF (DUHP) and the Fidelity Enhanced Large Cap Core ETF (FELC) rounded out the top three, bringing in $624.2M and $547.9M in Q3, respectively.
The $2.5B that XLG has attracted so far in 2024 leads this group and represents 37% of its AUM. The Eagle Capital Select Equity ETF (EAGL) has brought in the second most assets YTD in this cohort, reeling in $1.9B, and DUHP has gathered the third most assets in 2024, pulling in $1.9B (non-rounded numbers in the table below).
Download Visual | Modify in YCharts
Outflows in Mid-Cap Growth ETFs
Mid-Cap Growth ETFs shed $4.2B in the third quarter of 2024, as it was one of the two equity style boxes to record net-negative flows.
Below is a table of the Mid-Cap Growth ETFs that saw the most outflows in Q3 of 2024:

Download Visual | Modify in YCharts
Q3 2024 ETF Fixed Income Fund Flows
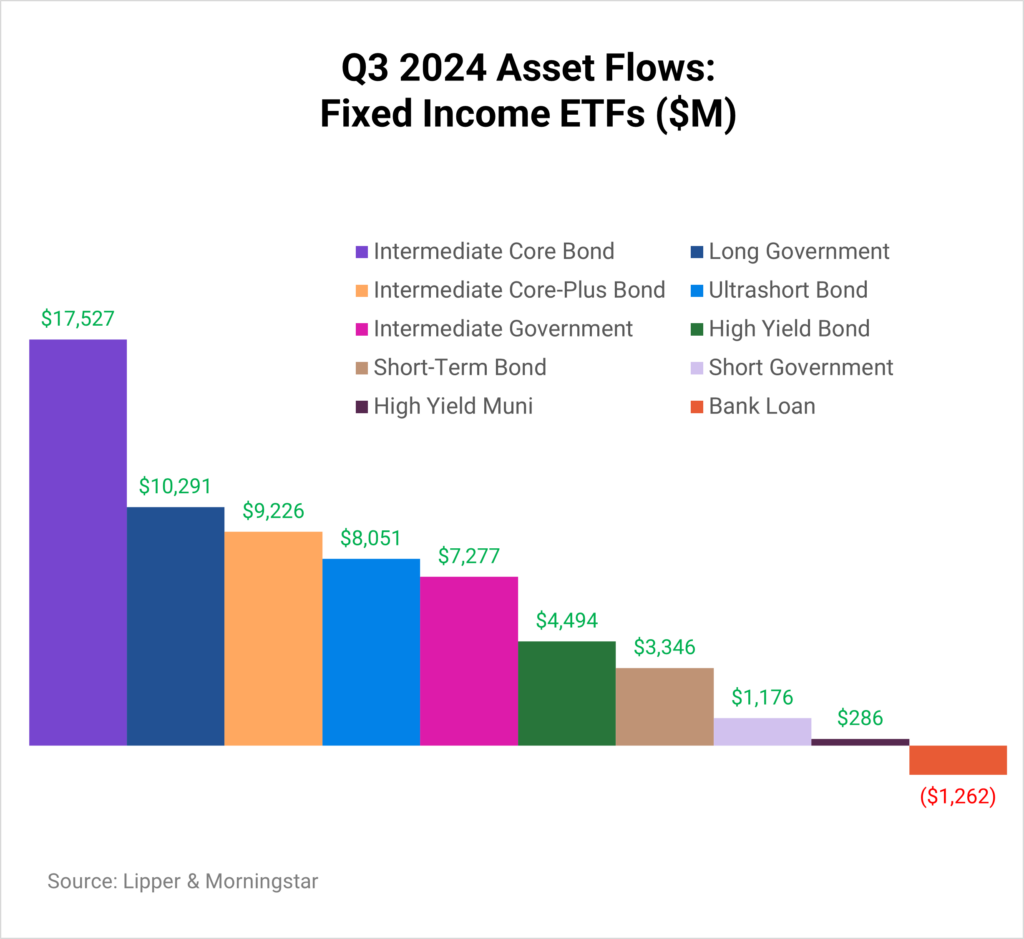
Inflows in Intermediate Core Bond ETFs
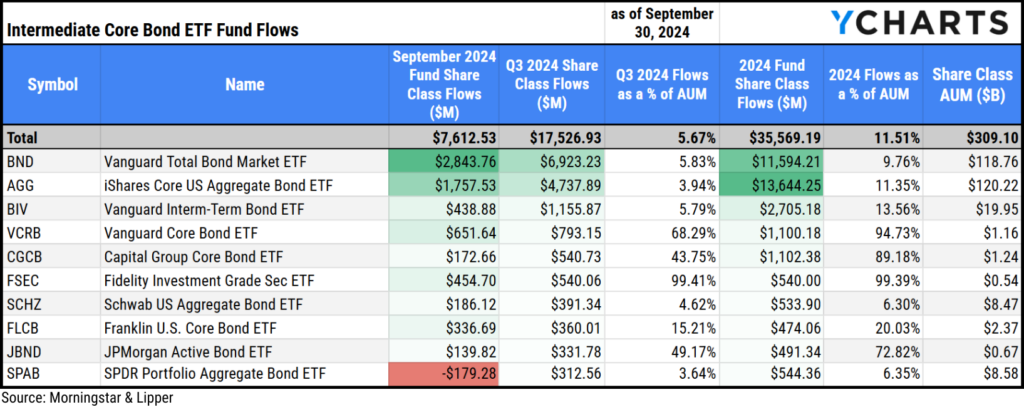
Intermediate Core Bond ETFs attracted $17.5B in Q3, and so far, in 2024, these strategies have pulled in $35.6B, propelling the category’s AUM to over $309B.
The three most popular strategies in Q3 were the Vanguard Total Bond Market ETF (BND), the iShares Core US Aggregate Bond ETF (AGG), and the Vanguard Interm-Term Bond ETF (BIV), attracting $6.9B, $4.7B, and $1.2B, respectively.
Download Visual | Modify in YCharts
Outflows in Bank Loan ETFs
Bank Loan ETFs saw $1.3B leave the category in Q3. Despite the quarter’s net-negative flows, the category has attracted $3.9B so far in 2024, representing 19.6% of the $19.8B in Bank Loan strategies.
Below is a table of the Bank Loan funds that saw the biggest outflows in Q3 2024.

Download Visual | Modify in YCharts
New ETF Launches in Q3 2024
Before entirely putting Q3 in the rearview, we want to acknowledge the 195 new ETFs that launched in the quarter. These strategies have already attracted $2.9B in inflows.
During this period, 152 of the 195 ETFs launched (or 78%) were active strategies, and 49 (or 25%) were in the Derivative Income or Options Trading category. This shift demonstrates the sustained growing demand for active management and specialized buffered or income strategies.
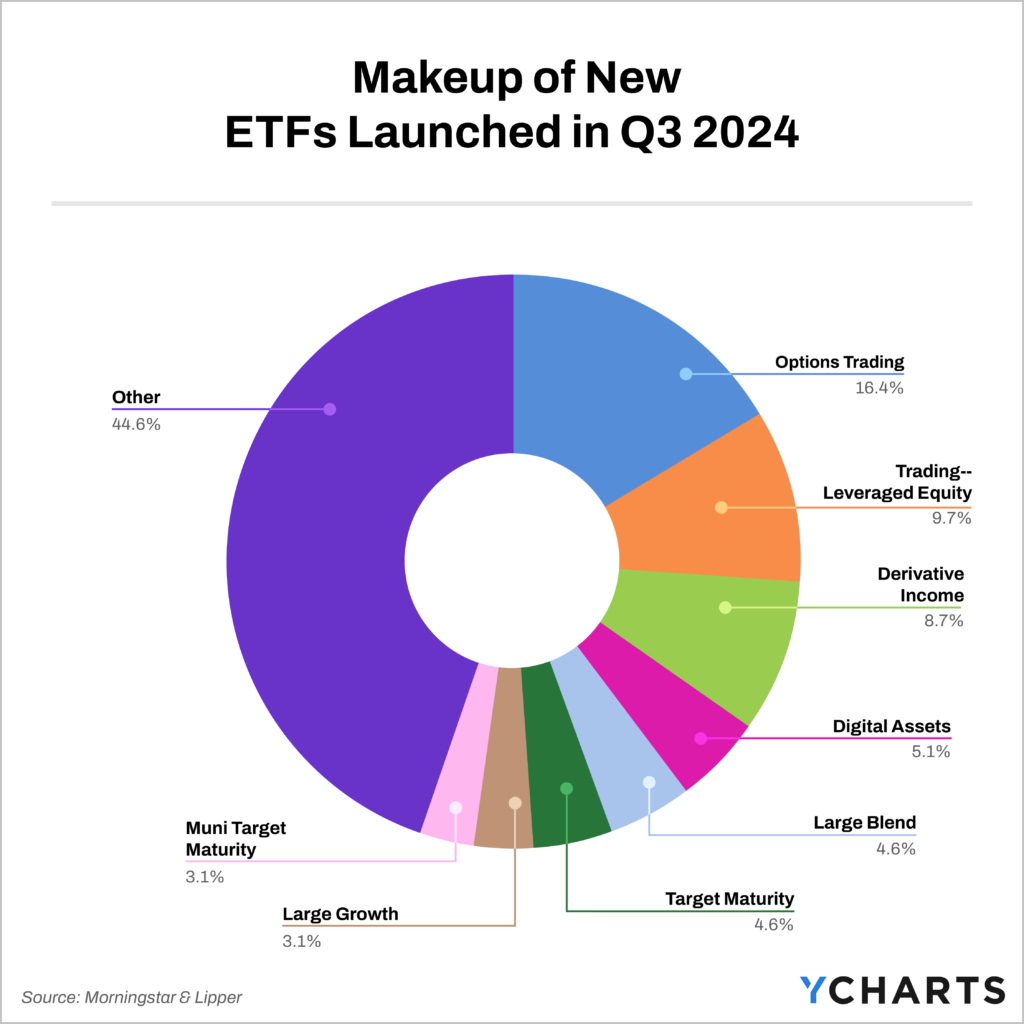
Additionally, the second wave of cryptocurrency ETFs were launched in Q3. Despite slower adoption compared to the Bitcoin ETFs launched in Q1, the eight spot-Ethereum ETFs—approved by the SEC in May—accumulated $1.2B in inflows in their inaugural quarter. In the broader context of Q3 2024, the launches were diversified, with Digital Assets, Derivative Income, Trading – Leveraged Equity, and Options Trading ETFs collectively comprising 40% of all new ETFs introduced during the quarter.
Remake this Image with Data from this Screener
The SMI 3Fourteen Full-Cycle Trend ETF (FCTE), Kraneshares Sust Ultra Short Duration Index ETF (KCSH), and Defiance Daily Target 1.75X Long MSTR ETF (MSTX) were the leaders in attracting assets among Q3 launches, pulling in $408M, $300M, and $284M, respectively. View the Q3 launches in a Comp Table here.
Data used in this article is sourced from Lipper & Morningstar data.
Whenever you’re ready, there are three ways YCharts can help you:
Have questions about how YCharts can help you grow AUM and prepare for meetings?
Email us at hello@ycharts.com or call (866) 965-7552. You’ll get a response from one of our Chicago-based team members.
Unlock access to our Fund Flows Report and Visual Deck by becoming a client.
Dive into YCharts with a no-obligation 7-Day Free Trial now.
Sign up for a copy of our Fund Flows Report and Visual Deck (clients only):
Disclaimer
©2024 YCharts, Inc. All Rights Reserved. YCharts, Inc. (“YCharts”) is not registered with the U.S. Securities and Exchange Commission (or with the securities regulatory authority or body of any state or any other jurisdiction) as an investment adviser, broker-dealer or in any other capacity, and does not purport to provide investment advice or make investment recommendations. This report has been generated through application of the analytical tools and data provided through ycharts.com and is intended solely to assist you or your investment or other adviser(s) in conducting investment research. You should not construe this report as an offer to buy or sell, as a solicitation of an offer to buy or sell, or as a recommendation to buy, sell, hold or trade, any security or other financial instrument. For further information regarding your use of this report, please go to: ycharts.com/about/disclosure
Next Article
US Initial Claims for Unemployment Insurance Monthly UpdateRead More →
