ADP Employment Change Report: Insights and Implications

The ADP Employment Change Report is a crucial economic indicator offering a comprehensive view of private sector job growth in the United States. Released monthly by ADP, this report provides timely insights into the labor market’s health, often preceding official government employment data. Financial advisors, investors, and economists closely monitor this data to gauge economic trends, make informed investment decisions, and adjust economic forecasts. The report covers employment changes across various sectors and regions, offering detailed breakdowns that help stakeholders understand which areas of the economy are expanding or contracting.
Understanding the latest ADP jobs report can provide early signals about the overall economic environment, influencing decisions on asset allocation, market timing, and risk management. By leveraging this data, stakeholders can better navigate the complexities of the economic landscape and make more informed decisions.
Latest Data Release
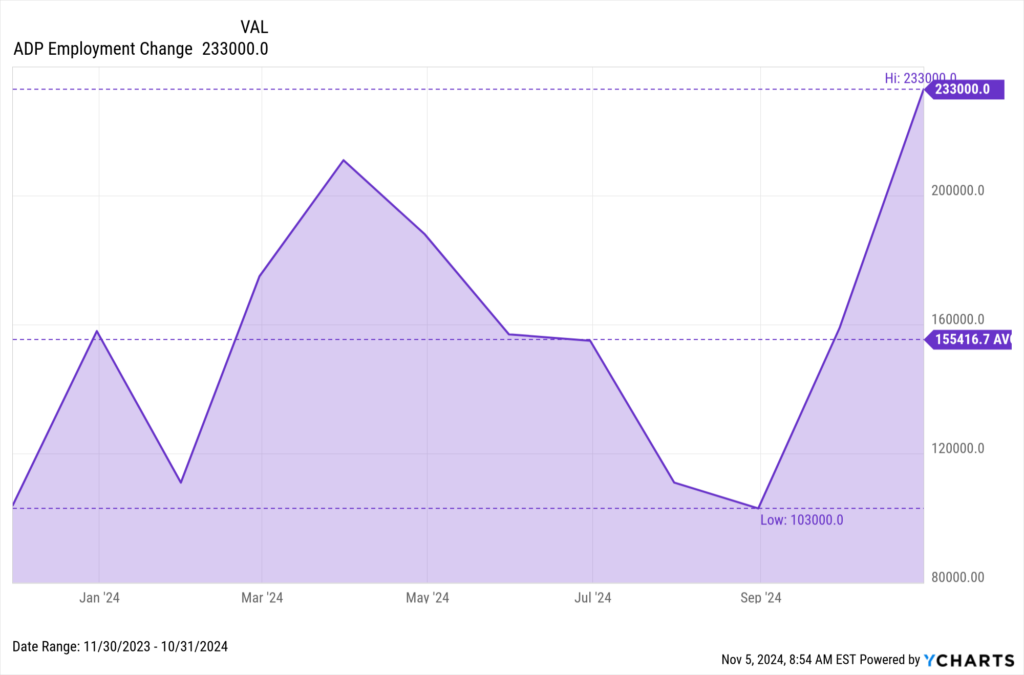
The most recent ADP Employment Change Report reveals a moderate increase in employment, with the private sector adding 233,000 jobs in October 2024, the highest since July 2023.
Download Visual | Modify in YCharts
Key Statistics by Sector
Goods-Producing Sector:
- Natural Resources/Mining jobs increased by 0.22% MoM in October
- Construction jobs increased by 0.45%
- Manufacturing jobs decreased by 0.15%
Service-Providing Sector:
- Trade/Transportation/Utilities jobs increased by 0.18% MoM in October
- Information jobs increased by 0.24%
- Financial Activities jobs increased by 0.12%
- Professional/Business Service jobs increased by 0.14%
- Education/Health Services jobs increased by 0.21%
- Leisure/Hospitality jobs increased by 0.22%
- Other Service jobs increased by 0.44%
In comparison to the previous month, which was upwardly revised to 159,000 jobs added in September 2024, the current data reflects a faster pace of growth (ADP Employment Reports).
This data provides essential insights into sectoral and regional employment trends, helping stakeholders understand the broader economic landscape.
Historical Context and Analysis
To fully understand the significance of the latest ADP Employment Change Report, it’s essential to examine the data within a historical context. By analyzing trends over the past year, we can gain insights into the broader economic trajectory and the labor market’s health.
Over the last year, the ADP report has shown a pattern of steady job growth, with occasional dips reflecting broader economic challenges. For instance, employment growth was robust at the beginning of the year but experienced a slowdown into the third quarter.
Historically, the service-providing sector has consistently been a significant driver of job growth, particularly in industries like trade/transportation/utilities, education/health services, and leisure/hospitality. Meanwhile, the goods-producing sector, which includes manufacturing and construction, has shown more variability, often influenced by broader economic cycles and policies. By comparing these trends against other economic indicators, such as GDP growth and unemployment rates, we can better understand the labor market’s dynamics.
Analysis and Insights
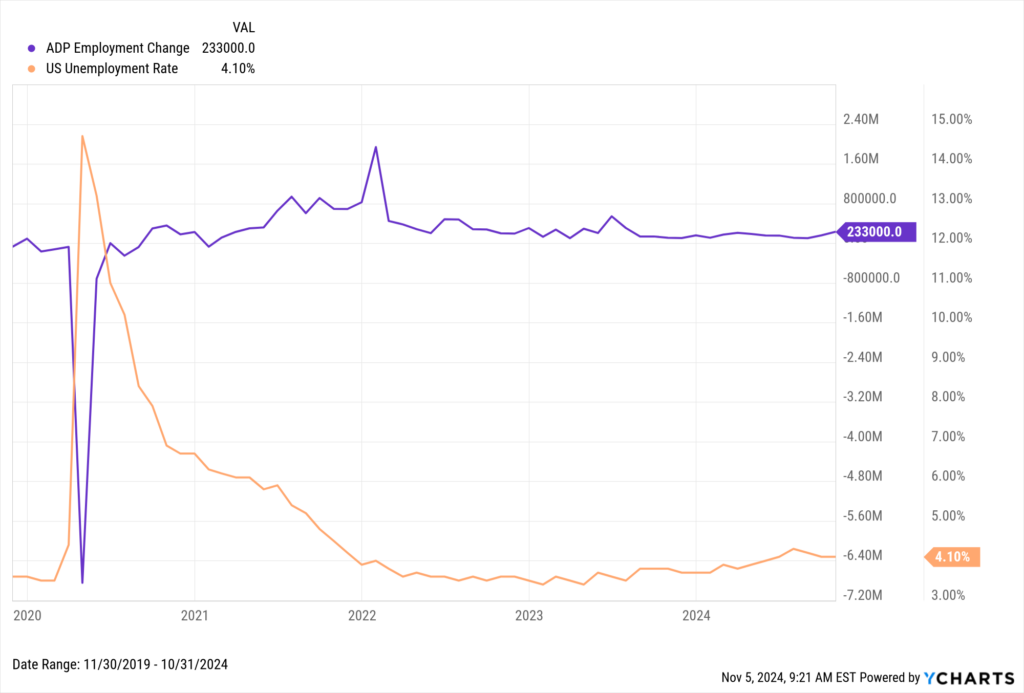
Utilizing YCharts tools, we can perform a detailed analysis of the ADP report outcomes and compare them with other key economic indicators like unemployment rate, GDP per capita growth, and ISM Manufacturing PMI. This analysis provides a comprehensive view of the economic landscape and its potential impact on various market sectors.
Download Visual | Modify in YCharts
For instance, the chart above shows an inverse relationship between ADP employment changes and unemployment rates, indicating that as private sector jobs increase, the unemployment rate tends to decrease.
Access long-term ADP Employment Change data on YCharts by following these simple steps:
1. Log on to YCharts.com.
2. Type “ADP Employment Change” into the search bar from anywhere on the platform and click on the result.
3. Once on the indicator page, users can toggle the navigation bar to browse historical data on a month-by-month basis or view data in an interactive chart.
Clicking “View Full Chart” will open data in an interactive Fundamental Chart to compare against other economic indicators. Additionally, users can export historical data to a CSV file for offline analysis by clicking the “Export” button.
Related Financial Indicators
YCharts’ ADP National Employment Report contains several additional related indicators to the ADP Employment Change and is produced by the ADP Research Institute in collaboration with the Stanford Digital Economy Lab. It offers deeper insights into the U.S. labor market and provides businesses and governments with a source of credible and valuable information. Other indicators from this report include:
- ADP California Median Pay YoY
- ADP Female Median Annual Pay
- ADP Female Median Pay YoY
- ADP Florida Median Pay YoY
- ADP Large Establishment Private Employment MoM
- ADP Male Median Annual Pay
- ADP Male Median Pay YoY
- ADP Median Annual Pay
- ADP Median Pay YoY
- ADP Medium Establishment Median Annual Pay
- ADP Medium Establishment Private Employment MoM
- ADP New Jersey Median Pay YoY
- ADP New York Median Pay YoY
- ADP Private Employment
- ADP Private Employment: Midwest Region MoM
- ADP Private Employment: Northeast Region MoM
- ADP Private Employment: South Region MoM
- ADP Private Employment: West Region MoM
- ADP Small Establishment Median Annual Pay
- ADP Small Establishment Private Employment MoM
- ADP Texas Median Annual Pay
- ADP Texas Median Pay YoY
- ADP Washington Median Pay YoY
Implications for Markets and Advisors
The latest ADP data has significant implications for financial markets. Increased employment often leads to higher consumer spending, positively affecting stock markets. Conversely, bond markets might react to potential inflationary pressures resulting from higher employment. Here’s a deeper dive into how the latest data can influence different market segments and offer actionable insights for financial advisors.
Stock Markets
Increased employment often signals robust economic health, which typically boosts investor confidence and drives stock markets higher.
- Sector Impact: Sectors with high employment gains, like professional services, are likely to see increased investor interest. Companies within these sectors may experience a rise in stock prices due to anticipated higher revenues.
- Consumer Spending: Higher employment rates generally lead to increased disposable income, driving consumer spending. This can benefit consumer discretionary stocks, including retail, automotive, and travel industries.
Bond Markets
While rising employment is generally positive, it can also introduce concerns about inflation. More jobs often lead to higher wages, which can increase spending and drive prices up, potentially leading to inflationary pressures.
- Inflation Concerns: If the labor market tightens and wages rise, the Federal Reserve might consider raising interest rates to control inflation. This can negatively impact bond prices, as higher rates make existing bonds with lower yields less attractive.
- Interest Rate Expectations: Bond investors closely watch employment data to gauge future interest rate moves. A strong ADP report might prompt the Federal Reserve to adopt a more hawkish stance, impacting the bond market.
Overall Economic Forecasts
Employment data is a key component of economic forecasting. Strong job growth can lead to upward revisions in GDP growth projections, influencing investment strategies across the board.
- GDP Growth: Robust employment figures can boost GDP growth expectations, as more jobs typically lead to higher production and economic output.
- Economic Policy: Policymakers use employment data to shape economic policy. Strong employment growth might result in tighter monetary policies, whereas weaker data could prompt stimulus measures.
YCharts Feature Highlights
YCharts offers powerful tools that enhance financial analysis and decision-making. Here’s a look at how you can leverage YCharts features for monitoring and analyzing economic data, including the ADP National Employment Report.
Model Portfolios
YCharts’ Model Portfolios allow you to build, backtest, and compare investment strategies. This feature enables advisors to simulate different economic scenarios and automate comprehensive portfolio performance reports.
Fundamental Charts
Fundamental Charts in YCharts help visualize and analyze data. Create and customize charts to compare multiple metrics, such as employment data with GDP growth, and identify trends and correlations.
Dashboards
YCharts Dashboards consolidate various charts and data points into one view. Monitor performance, track key indicators in real-time, and easily share insights with clients or colleagues.
By utilizing these YCharts features, financial advisors can make data-driven decisions, stay ahead of market trends, and provide greater value to their clients.
Custom Alerts
Stay updated with YCharts’ Custom Alerts. Set alerts for specific economic indicators or portfolio changes, and receive notifications to ensure you never miss critical updates.
Economic Indicators Library
This library provides access to a wide range of economic data, including employment figures. Users can track key indicators, create customizable dashboards, and analyze historical data to identify trends and make informed forecasts.
Conclusion
The latest ADP report underscores the continued growth in the private sector, with Construction leading the charge. Financial advisors and investors can leverage this data to refine their strategies and make informed decisions. By keeping abreast of the ADP employment report today, stakeholders can gain valuable insights into the labor market’s dynamics and their broader economic implications.
Whenever you’re ready, there are 3 ways YCharts can help you:
1. Looking to better communicate the importance of economic events to clients?
Send us an email at hello@ycharts.com or call (866) 965-7552. You’ll be directly in touch with one of our Chicago-based team members.
2. Want to test out YCharts for free?
Start a no-risk 7-Day Free Trial.
3. Download a copy of the Quarterly Economic Update slide deck:
Disclaimer
©2024 YCharts, Inc. All Rights Reserved. YCharts, Inc. (“YCharts”) is not registered with the U.S. Securities and Exchange Commission (or with the securities regulatory authority or body of any state or any other jurisdiction) as an investment adviser, broker-dealer or in any other capacity, and does not purport to provide investment advice or make investment recommendations. This report has been generated through application of the analytical tools and data provided through ycharts.com and is intended solely to assist you or your investment or other adviser(s) in conducting investment research. You should not construe this report as an offer to buy or sell, as a solicitation of an offer to buy or sell, or as a recommendation to buy, sell, hold or trade, any security or other financial instrument. For further information regarding your use of this report, please go to: ycharts.com/about/disclosure
Next Article
Monthly Market Wrap: October 2024Read More →