Why Advisors Who Modernize Their Reporting Outperform Peers
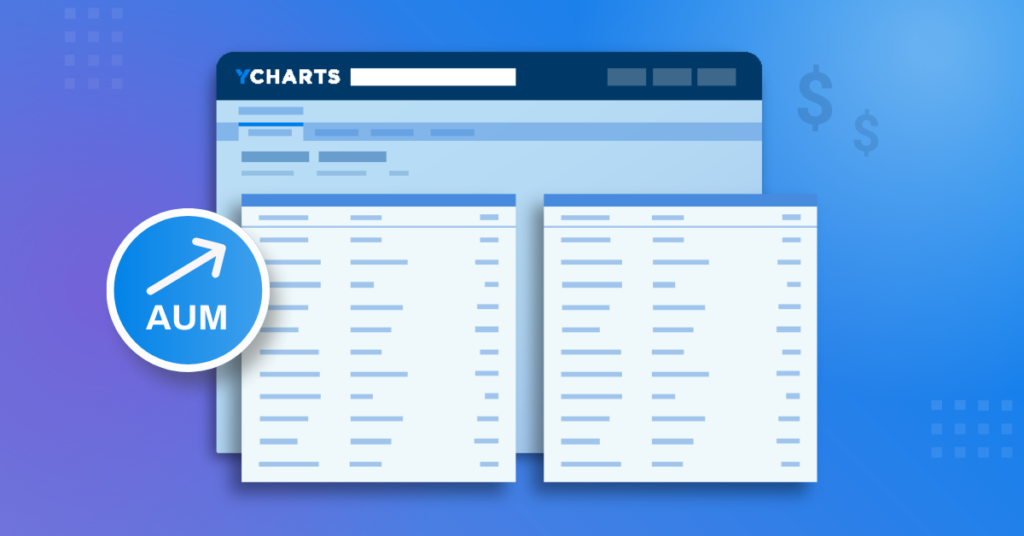
Executive Summary: In the highly competitive world of financial advisory, having access to reliable, comprehensive, and intuitive investment research tools is essential. YCharts has emerged as the preferred all-in-one wealth management solution for financial advisors, providing a suite of powerful features that streamline investment research, portfolio management, and client communication.
Interested in testing out YCharts for free?
Start 7-Day Free TrialThe Modern Reporting Shift
The advisor landscape is evolving quickly. As regulations tighten and client expectations rise, advisors need more than static reports. They need tools that empower transparent and confident conversations.
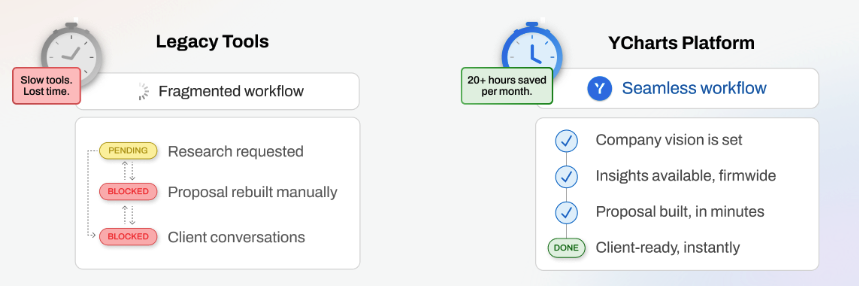
Many legacy reporting systems were built for a different era. They prioritize rigid templates over real-world conversations, forcing advisors to work around the software instead of with it. The result is often reports that are difficult to explain, customize, or trust in a client meeting.
Modern reporting technology changes that. With customizable inputs, interactive visuals, and compliance-ready workflows, YCharts enables advisors to present data that is both accurate and transparent. The result is stronger trust, improved sentiment, and better client conversations.
This shift toward modern, flexible reporting is growing across the industry as firms recognize the need for clearer visuals, more accurate assumptions, and stronger client conversations.
The stories that follow highlight three advisory teams that embraced this change and used modern reporting to support better communication, smoother preparation, and more consistent growth.
Table of Contents
How Hege Financial Group Built a Convergence of Compliance and Confidence
As Hege Financial Group grew, its investment committee needed a platform that could balance compliance with transparency. Their legacy reporting tool required maximum-fee disclosures on every proposal, artificially lowering reported returns and creating confusion for clients.
With YCharts, Hege’s team now adjusts fee inputs to reflect real portfolios while maintaining SEC Marketing Rule compliance. Advisors create clean proposals, integrate research and planning workflows, and deliver side-by-side comparisons that make complex strategies easier to understand.
The result is clear, compliant performance storytelling that builds trust and strengthens new business conversations. Hege’s experience also reflects a broader shift across the LPL network, where many advisors have replaced legacy reporting tools with more flexible workflows and clearer client communication. Among YCharts users at LPL, 91% say YCharts is easy to implement, 94% recommend it, and 92% agree that it adds value across both research and reporting.
This move toward modern reporting is not unique to Hege. Advisory teams across the industry are upgrading their systems to deliver more transparent and consistent client communication. That shift is also evident at Sgroi Lawley Group.
A Broader Trend: Advisors Modernizing to Scale and Strengthen Client Trust
For Sgroi Lawley Group, modernization was not just about saving time. It was about creating a unified process that could support a rapidly growing advisor team.
Based in West Seneca, New York, the firm combines more than fifty years of advisory experience with the resources of a leading insurance and benefits organization. As the team expanded, they needed one platform for research, model management, and client reporting.
Their legacy tools created inconsistent visuals, required hours of manual prep, and made it challenging to deliver the same story across every advisor seat.
Since adopting YCharts in 2017, Sgroi Lawley Group has transformed how advisors research securities, build portfolios, and engage clients. What started as a search for effective ways to communicate portfolio insights soon became a firm-wide rollout as the impact became evident.
By bringing research, model construction, and client reporting into one platform, YCharts now supports every stage of their investment process. The firm saves hours of meeting prep each week and ensures that every advisor delivers a consistent, data-driven narrative.
With more efficient collaboration and sharper insights, Sgroi Lawley has scaled from a $250 million practice to a $1.3 billion RIA, showing how modern reporting drives measurable growth.
While Sgroi Lawley modernized to support a growing and distributed team, Transformational Advisory Group built modern reporting into their process from the start. Their experience demonstrates how a repeatable and transparent reporting workflow enables a firm to grow quickly and maintain consistency across every advisor seat.
Transformational Advisory Group: Scaling from $95 Million to $830 Million with a Repeatable, Modern Reporting Process
For Wes Burns, Founder and CEO of Transformational Advisory Group, modern reporting technology was part of the foundation from the start. When he launched his independent firm in 2019, YCharts was added to the advisor tech stack immediately to support a transparent, data-driven client experience.
As the firm expanded, YCharts played a central role in its M&A strategy, client communication workflow, and team-wide consistency. This foundation created a repeatable reporting process that helped scale the business from $95 million to more than $830 million in assets and contributed to Wes being named a Forbes Top 100 Next-Gen Advisor in 2025.
The firm’s 15-person advisor team uses YCharts to standardize analysis, sync with Orion, and collaborate with clients in real time through dashboards and visuals that make every meeting clearer and more productive.
With YCharts supporting the team’s research, reporting, and client conversations, Transformational Advisory Group built a scalable operating model that delivers consistency, clarity, and confidence across every advisor seat.
The Common Thread: Clarity, Confidence, and Growth
Across Hege Financial Group, Sgroi Lawley Group, and Transformational Advisory Group, a consistent pattern emerges.
Clarity.
When advisors control assumptions and present clear visuals, clients gain confidence in recommendations. Modern reporting gives firms the accuracy and clarity they need to guide clients through market changes and long-term planning.
Efficiency drives impact.
Time saved in preparation becomes time invested in client conversations. By centralizing research and reporting in one platform, advisors reduce prep work and walk into meetings better prepared.
Modernization fuels growth.
Firms that adopt modern reporting technology scale faster, strengthen client loyalty, and support more consistent workflows across their advisor teams.
The Takeaway
In an industry built on trust, clarity is a competitive advantage. Advisors need reporting tools that answer the questions clients care about most. How did the portfolio behave in different market environments? What drove performance over time? How does the proposed strategy compare to what they already hold?
Modern reporting makes those answers simple, visual, and easy to communicate. YCharts equips advisors with transparent data, real-time comparisons, and interactive visuals that turn complex information into client-ready insights.
The firms investing in modern reporting are laying the foundation for stronger client relationships and more predictable growth. As more advisors migrate away from legacy platforms, clearer assumptions and more consistent visuals are becoming essential for confident communication.
As the industry continues to evolve, the teams that modernize will be the ones who stay aligned with client expectations and stand out in an increasingly competitive landscape.
Ready to Move On From Your Investment Research and Analytics Platform?
Follow YCharts Social Media to Unlock More Content!
*Legacy Provider’s name withheld due to respect of our competitors
Next Article
Why YCharts is the Best Investment Research Tool for Financial AdvisorsRead More →