An Advisor’s Guide to Elections and the Markets
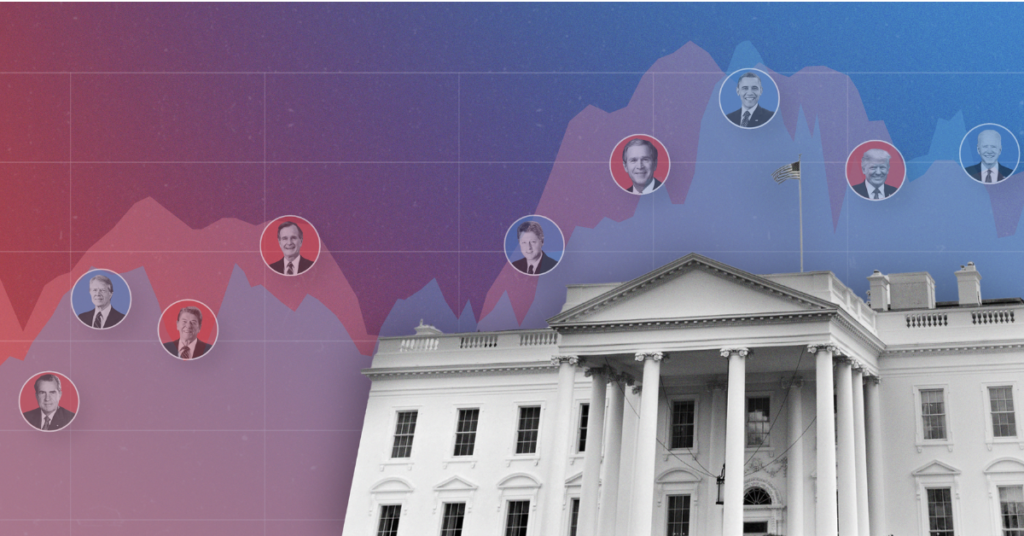
Are your clients asking how the presidential election could affect their investments?
Every four years, speculation about the incoming president and their policies heightens uncertainty for both advisors and their clients. 2024 is no exception, given the extraordinary move by a sitting president to withdraw from the race.
YCharts’ latest guide, “How Do Presidential Elections Impact The Market?” answers the most commonly asked questions that financial advisors hear from clients during an election year.
Below are some important takeaways for advisors and their clients. Download the guide to access full insights, along with downloadable, white-label visuals to share with clients:
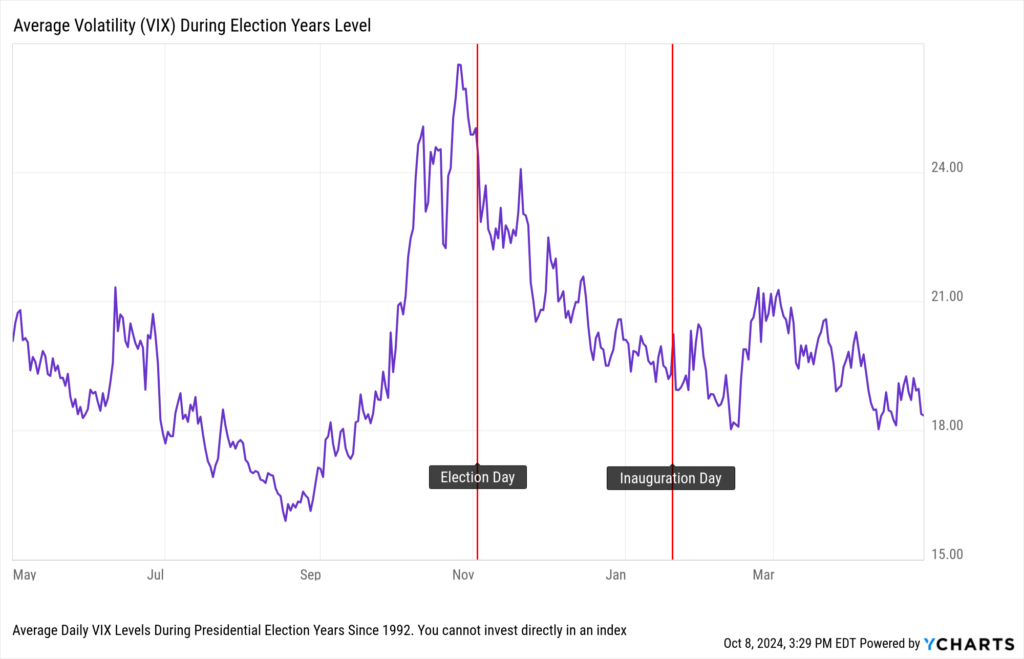
Volatility Heats Up Ahead of Election Day, but Cools Down After
Investor anxiety has generally risen in the month leading up to Election Day. However, volatility tends to calm down after the ballots are counted and in the roughly two-month transition period leading up to Inauguration Day.
Average daily CBOE Volatility Index (VIX) levels across the last eight presidential election cycles reveal that the VIX has spiked to an average high of 26.5 ahead of Election Day before steadily coming down to an average level of 20.2 on Inauguration Day.
Download Election Guide | Modify in YCharts | Chart not loading? Get in touch to access
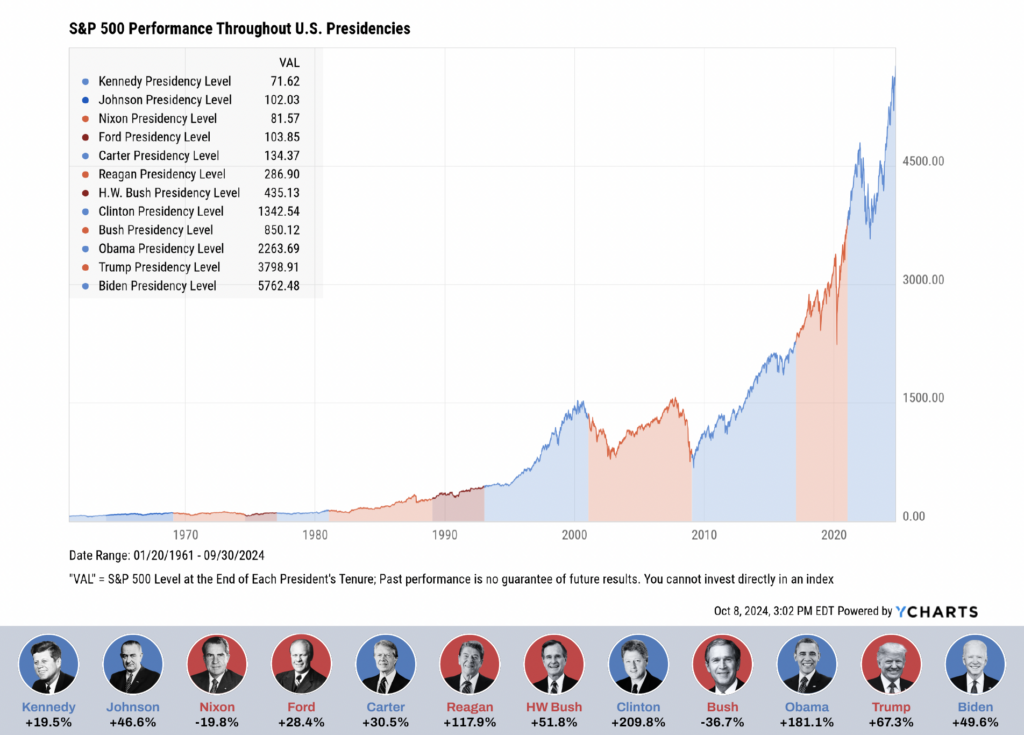
Markets Rise Over Time, Regardless of the President In Office
Dating back to John F. Kennedy’s inauguration in 1961, the S&P 500 posted a negative return during only two presidencies: Richard Nixon and George W. Bush.
Despite some down periods along the way, the market has grown in value over the long term, to the tune of 9,510%–or 7.43% annualized– since JFK’s inauguration.
Download Election Guide | Modify in YCharts | Chart not loading? Get in touch to access
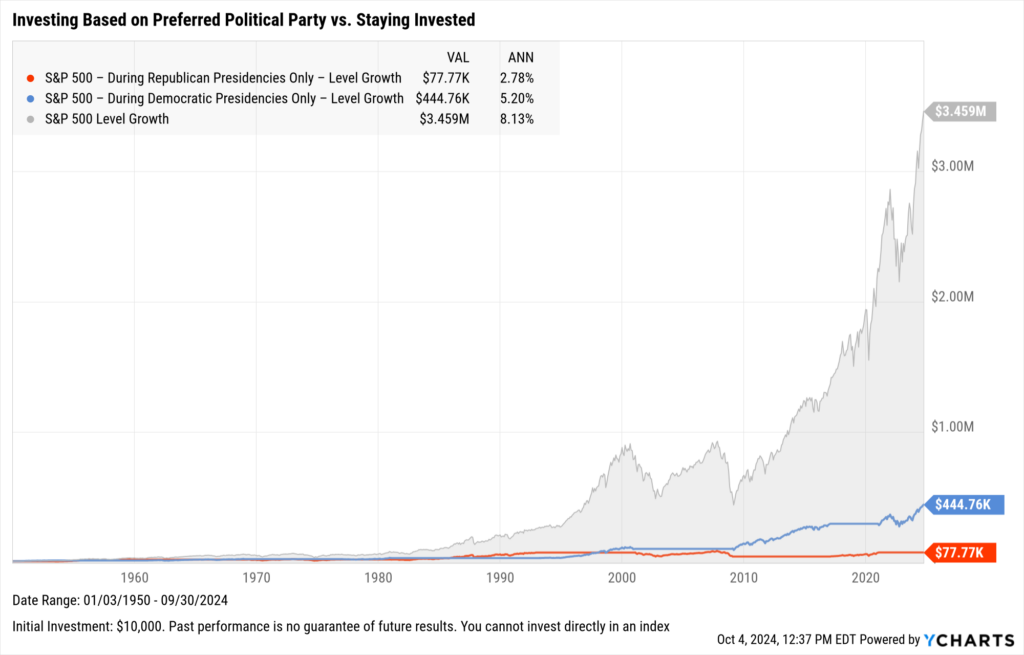
Staying Invested is the Most Prudent Long-Term Strategy
Making major investment decisions based on a president’s political party–i.e. being invested only during Democratic presidencies, then moving to cash for Republican tenures, or vice versa–is probably hurting your portfolio more than helping it.
Using the S&P 500 as a benchmark, choosing to invest only during Democratic presidencies since 1950 and sticking to cash otherwise resulted in a 5.20% annualized return through September 30th, 2024. Similarly, a strategy of investing exclusively during Republican presidencies generated an even smaller 2.78% annualized return.
Whereas, simply “staying the course” produced the best result.
Download Election Guide | Modify in YCharts | Chart not loading? Get in touch to access
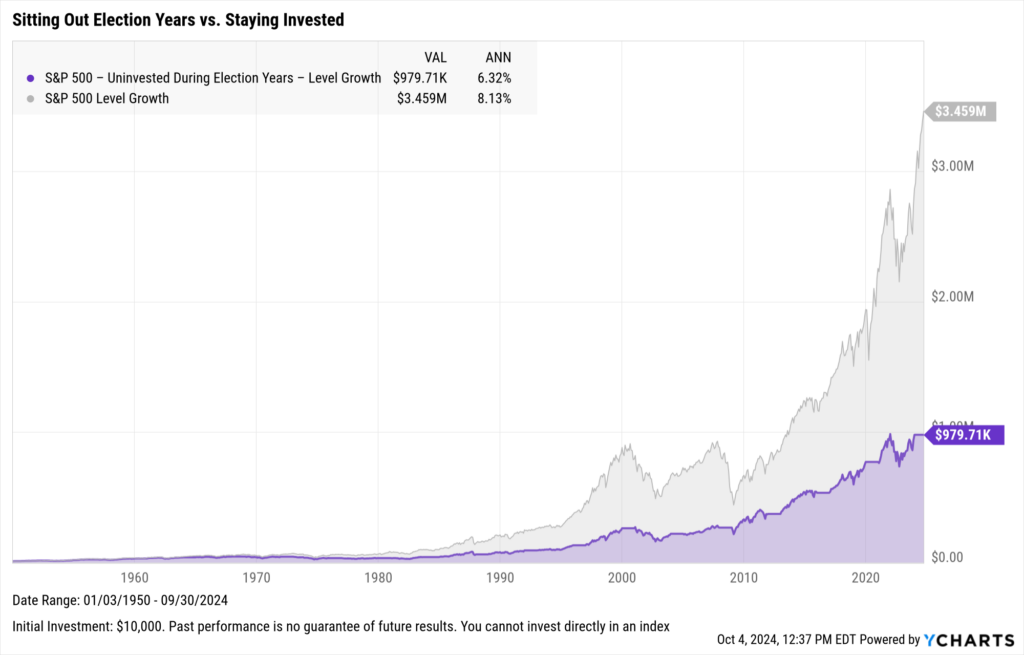
And just as making investment decisions based on a preferred political party can negatively impact portfolios, pulling investments out of the market in election years entirely can also be a detrimental investing strategy.
Starting in 1950, moving an all-S&P 500 portfolio to cash during the calendar years of presidential elections (1952, 1956…2020, 2024) generated a 1.81% lower annualized return compared to staying invested the whole time.
Though “sitting out” election years could potentially help avoid some volatility, it often comes at the cost of missing valuable time in the market.
Download Election Guide | Modify in YCharts | Chart not loading? Get in touch to access
Divided Congresses Produced Greater Returns
Historically, higher average annualized returns have occurred during a divided Congress, where one party controls the House or Senate and the other party holds a majority in the second chamber. Lower returns have come during Democratic majorities in both the House and Senate, while higher returns have taken place under Republican control of both congressional chambers.
In any case, the market has historically been positive under all six government compositions, as seen in the visual below.
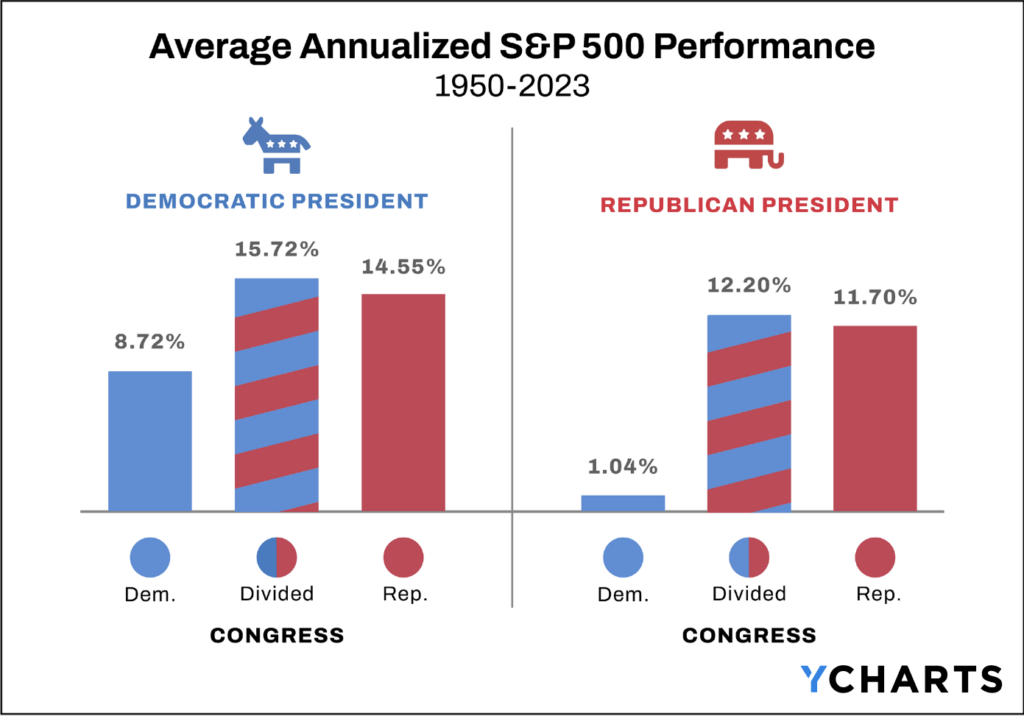
Under the current government of a Democratic president and a divided Congress, the S&P 500 has advanced 50.08% (26.06% annualized) between January 3rd, 2023–when this current Congress was sworn in–and September 30th, 2024, outperforming the 15.72% annualized return historically generated during this legislative formation.
While elections may create some short-term uncertainty, advisors can arm themselves with key insights–such as volatility often cools down after an election and markets tend to rise regardless of who’s in office–to quell client concerns.
No matter the circumstance, focusing on long-term investing goals should always be the most important factor in investment decision-making for advisors and their clients.
Whenever you’re ready, there are 3 ways YCharts can help you:
1. Interested in creating your own election material for clients?
Send us an email at hello@ycharts.com or call (866) 965-7552. You’ll be directly in touch with one of our Chicago-based team members.
2. Want to test out YCharts for free?
Start a no-risk 7-Day Free Trial.
3. Download our election guide, How Do Presidential Elections Impact the Market?
Disclaimers
©2024 YCharts, Inc. All Rights Reserved. YCharts, Inc. (“YCharts”) is not registered with the U.S. Securities and Exchange Commission (or with the securities regulatory authority or body of any state or any other jurisdiction) as an investment adviser, broker-dealer or in any other capacity, and does not purport to provide investment advice or make investment recommendations. This report has been generated through application of the analytical tools and data provided through ycharts.com and is intended solely to assist you or your investment or other adviser(s) in conducting investment research. You should not construe this report as an offer to buy or sell, as a solicitation of an offer to buy or sell, or as a recommendation to buy, sell, hold or trade, any security or other financial instrument. For further information regarding your use of this report, please go to: ycharts.com/about/disclosure
Next Article
An Advisor’s Guide to Track, Analyze, and Act on Capital GainsRead More →