Apple’s $500 Billion U.S. Investment: What It Means for Asset Managers & Financial Advisors
Introduction: Apple’s Commitment to U.S. Expansion
Apple has announced plans for Apple’s $500 billion investment in the United States over the next four years, aiming to create approximately 20,000 new jobs. This initiative includes the construction of new manufacturing facilities, AI data center expansions, and a manufacturing academy focused on workforce training.
For asset managers and financial advisors, this investment signals a shift in capital allocation that could impact equity markets, fixed-income trends, and economic growth.
This analysis will cover:
- The breakdown of Apple’s $500 billion investment
- Market reactions and potential investment opportunities
- Implications for key sectors and portfolio strategies
Apple’s $500 Billion Commitment: Key Investment Areas
1. Manufacturing & Infrastructure
- Apple is expanding U.S.-based production with a 250,000-square-foot manufacturing facility in Houston, Texas focused on AI-driven server production.
- A new manufacturing academy in Detroit, Michigan will train workers in semiconductor production and assembly.
2. Advanced Manufacturing Fund
- Apple is doubling its U.S. Advanced Manufacturing Fund to $10 billion, providing capital to domestic suppliers and technology firms.
- This initiative supports semiconductor independence, a key priority following supply chain disruptions in recent years.
3. AI & Cloud Expansion
- Apple is investing $75 billion in AI infrastructure, particularly in data centers and AI-powered hardware production.
- AI-related job creation is expected in Silicon Valley, Austin, and North Carolina.
4. Workforce Expansion & Job Growth
Over 20,000 new jobs will be added across manufacturing, research & development, and retail expansion.
Market Reaction: How Apple’s U.S. Investment is Impacting Stocks
Apple’s investment plan has broad implications for U.S. markets, particularly in technology, manufacturing, and infrastructure sectors.
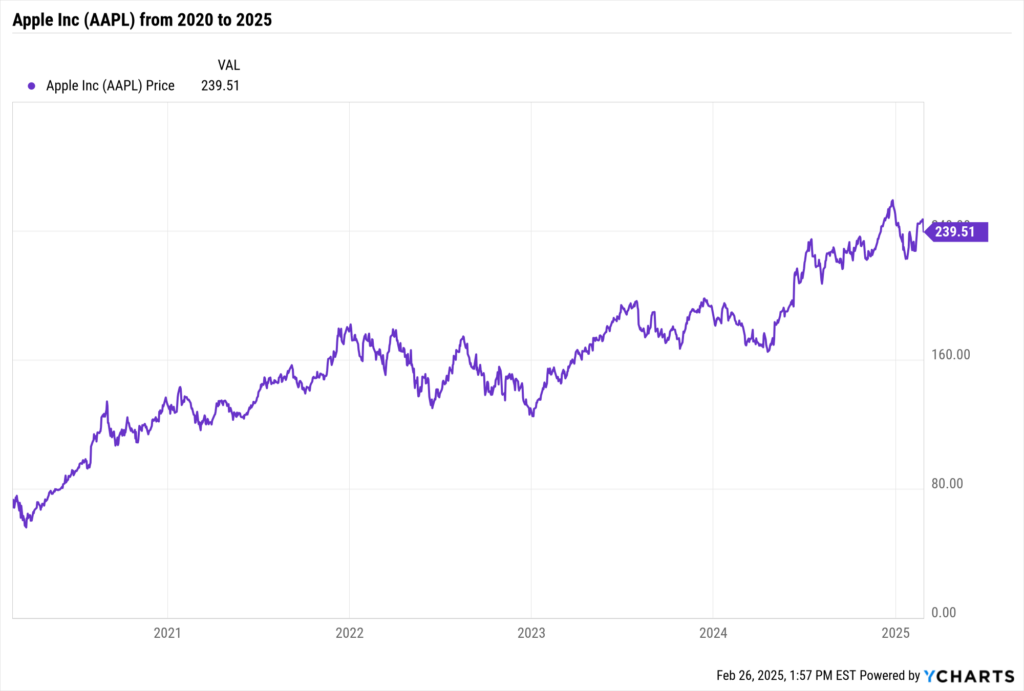
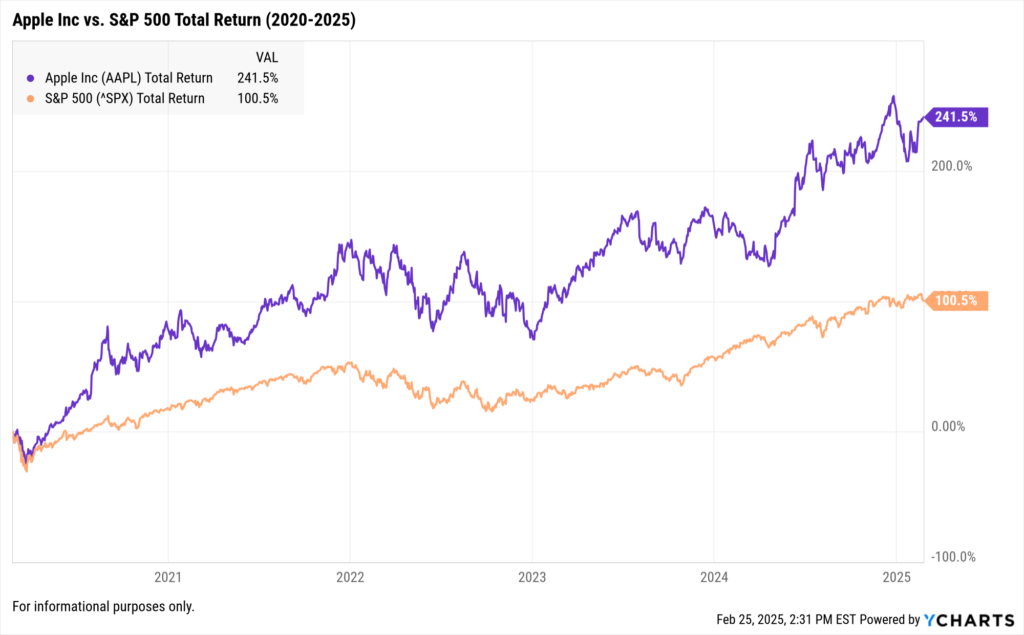
Equities: Apple Stock vs. S&P 500 Performance
Historically, Apple’s strategic investments have aligned with strong stock performance. The announcement of large capital expenditures has often correlated with growth in its share price and broader market indices.
Implications for Key Sectors & Portfolio Positioning
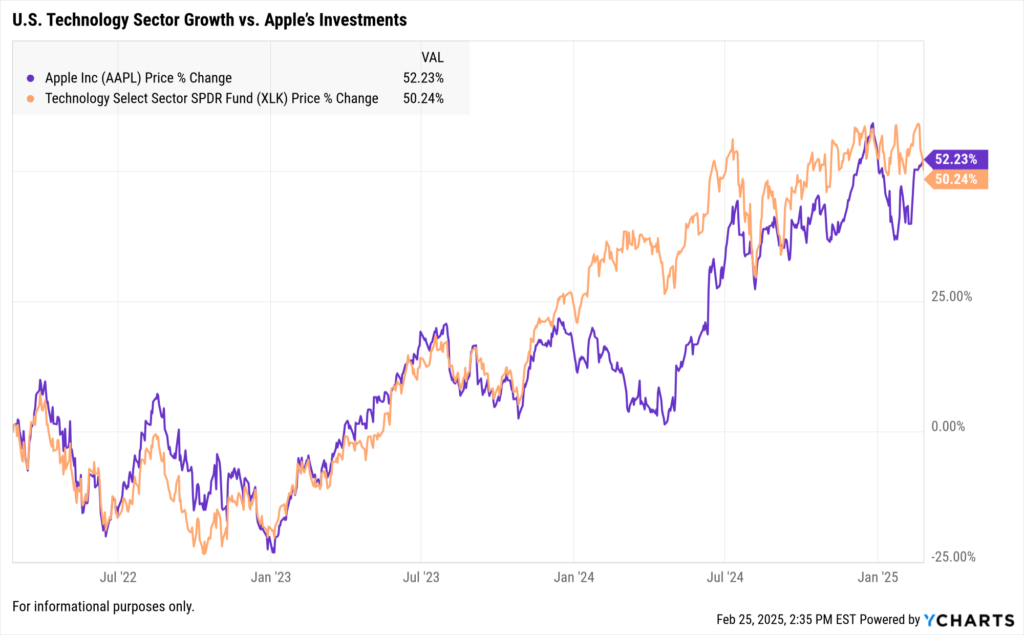
Technology & AI Development
Apple’s push for AI infrastructure aligns with broader trends in artificial intelligence and machine learning investment. Other companies involved in AI development and semiconductor production may benefit from these trends.
U.S. Manufacturing & Labor Market Impact
The investment in manufacturing facilities and workforce training suggests stronger long-term job growth in industrial sectors. The Bureau of Labor Statistics (BLS) projects that employment in advanced manufacturing will continue to expand through 2030.
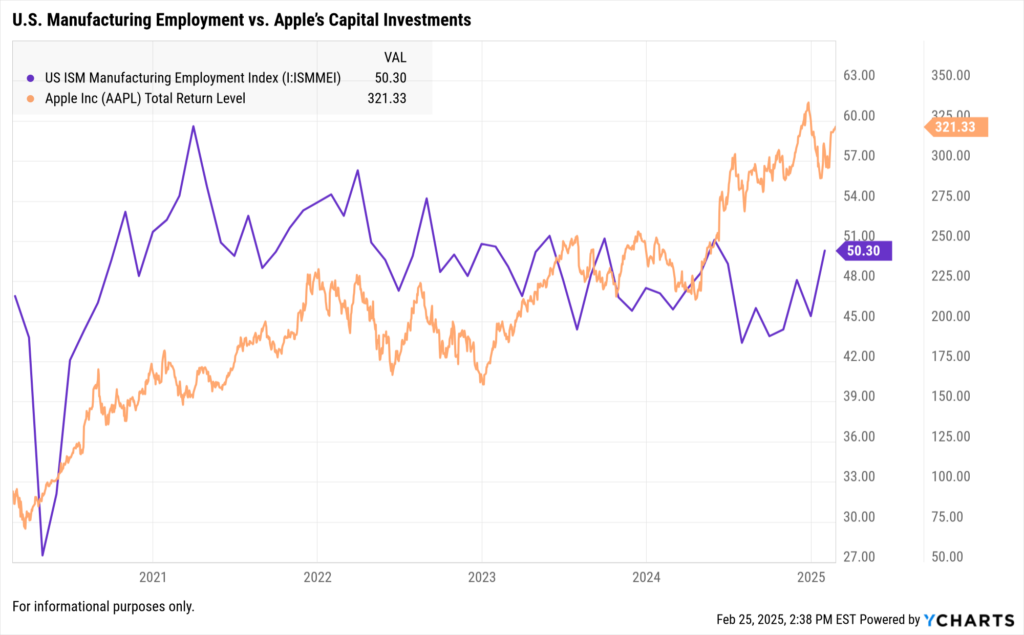
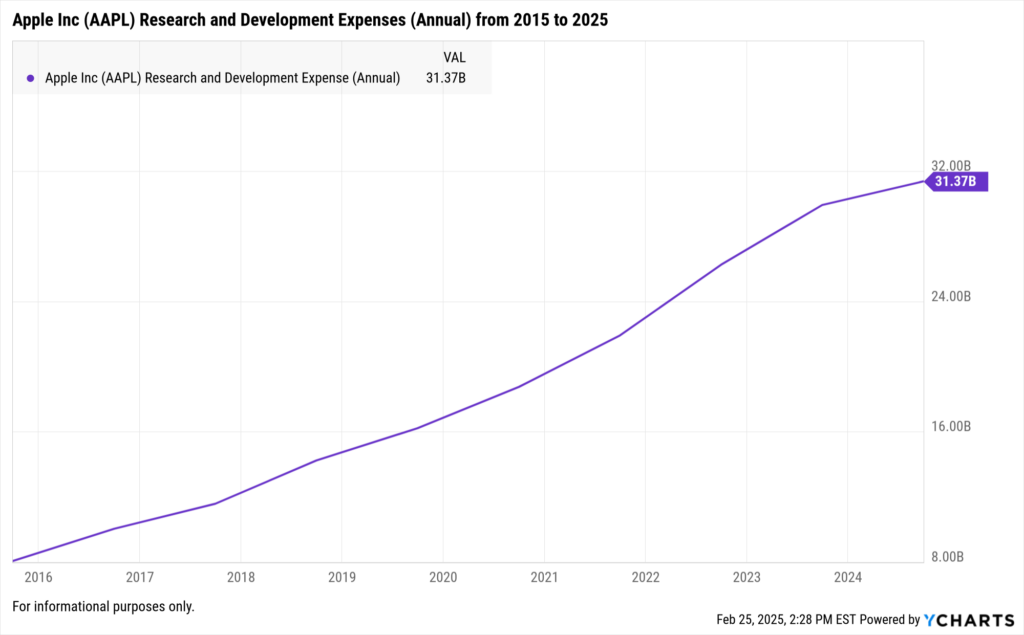
Apple Inc.’s Capital Investments and Performance
- Apple shows substantial and growing capital investments, with 2024 Capital Expenditures focused on expanding facilities globally.
- Financial filings indicate increases in Apple’s R&D and infrastructure, with capital investments peaking in areas like new technologies and services.
- As of February 24, 2025, Apple’s total return level stood at 321.33, indicative of robust investment and stock performance relative to market conditions.
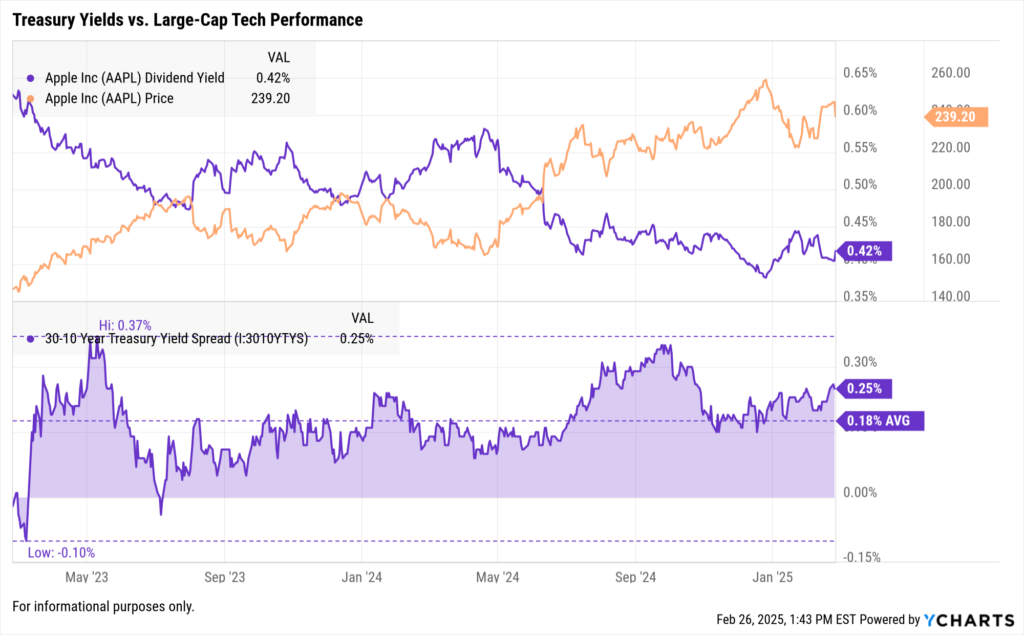
Fixed Income Considerations: Rising Treasury Yields & Apple’s Bond Issuances
Apple’s recent bond issuances indicate a strong commitment to financing long-term capital projects. Meanwhile, rising Treasury yields could impact fixed-income investors.
How YCharts Helps Financial Professionals Track Market Trends
With ongoing corporate investment announcements shaping market trends, YCharts provides financial advisors and asset managers with the tools needed to analyze real-time economic data and stock performance.
With YCharts, you can:
- Track Market & Economic Data: Use YCharts’ Economic Indicators to monitor Treasury yields, employment trends, and sector performance.
- Compare Historical & Current Trends: Analyze S&P 500 movements during past major Apple investments.
- Build Client-Ready Reports: Create Custom Reports illustrating how Apple’s capital expenditures impact key industries.
Conclusion: How Apple’s Investment Will Shape U.S. Markets
Apple’s $500 billion U.S. investment will have a lasting impact across technology, manufacturing, and labor markets.
- Increased U.S. production and R&D investments could boost technology sector growth.
- Manufacturing expansions may contribute to U.S. job creation and industrial sector strength.
- Asset managers and financial advisors should monitor how these investments affect fixed income markets, corporate financing, and equity performance.
By leveraging historical insights and real-time data through YCharts, investors can make informed decisions about how to navigate these market changes.
Whenever you’re ready, there are 3 ways YCharts can help you:
1. Looking for a best-in-class data & visualization tool?
Send us an email at hello@ycharts.com or call (866) 965-7552. You’ll be directly in touch with one of our Chicago-based team members.
2. Want to test out YCharts for free?
Start a no-risk 7-Day Free Trial.
3. Get your copy of The Top Metrics Advisors Used in Portfolio Reports: 2024
Disclaimer
©2025 YCharts, Inc. All Rights Reserved. YCharts, Inc. (“YCharts”) is not registered with the U.S. Securities and Exchange Commission (or with the securities regulatory authority or body of any state or any other jurisdiction) as an investment adviser, broker-dealer or in any other capacity, and does not purport to provide investment advice or make investment recommendations. This report has been generated through application of the analytical tools and data provided through ycharts.com and is intended solely to assist you or your investment or other adviser(s) in conducting investment research. You should not construe this report as an offer to buy or sell, as a solicitation of an offer to buy or sell, or as a recommendation to buy, sell, hold or trade, any security or other financial instrument. For further information regarding your use of this report, please go to: ycharts.com/about/disclosure
Next Article
Under the Hood of January's Active Fixed Income ETF ExplosionRead More →