April 2025 Fund Flows: Where Money Moved During Market Mayhem
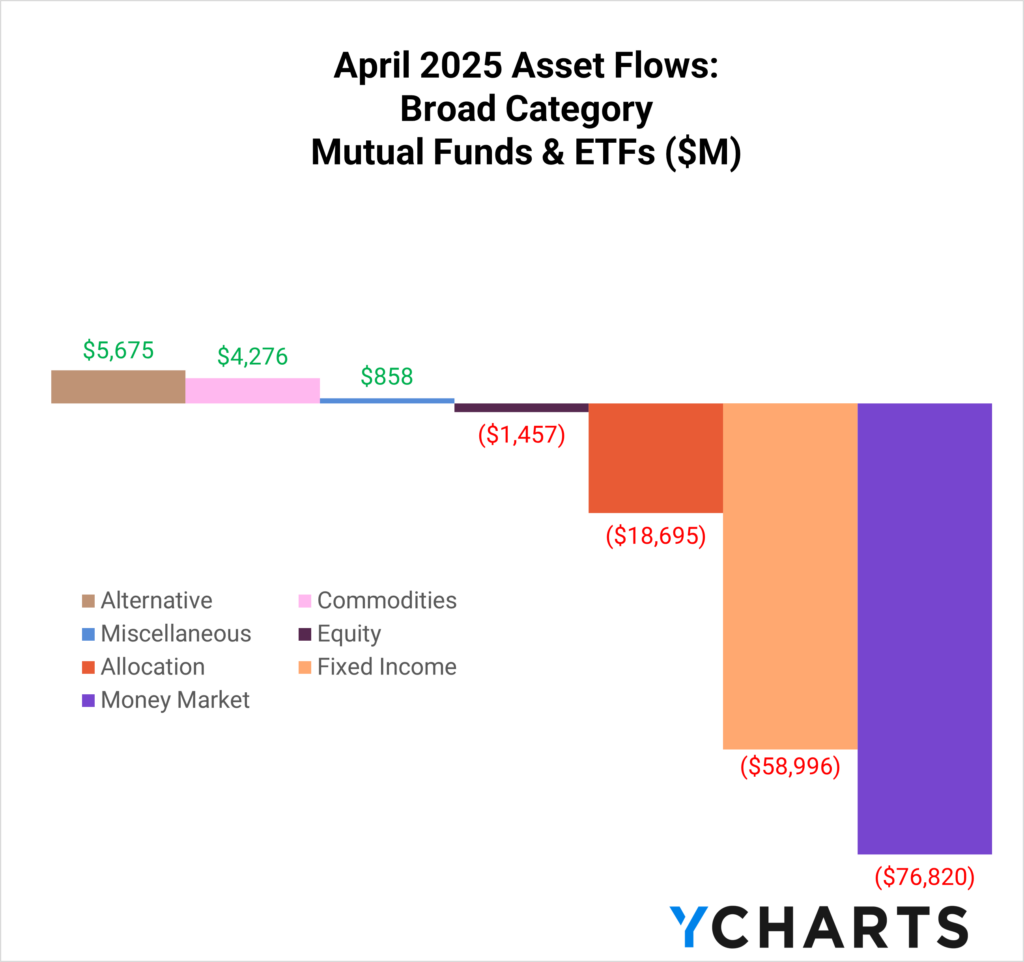
April was anything but calm for investors. Broad mutual fund and ETF flows reflect a decisive shift toward caution, with money markets, fixed income, and allocation funds experiencing steep outflows. Investors pulled nearly $155 billion from those three categories combined, as heightened volatility and a deteriorating macro outlook weighed on sentiment.
Subscribe to the Fund Flow Report
Sign up for our free monthly Fund Flow Report to stay updated on how assets are moving in and out of these strategies:
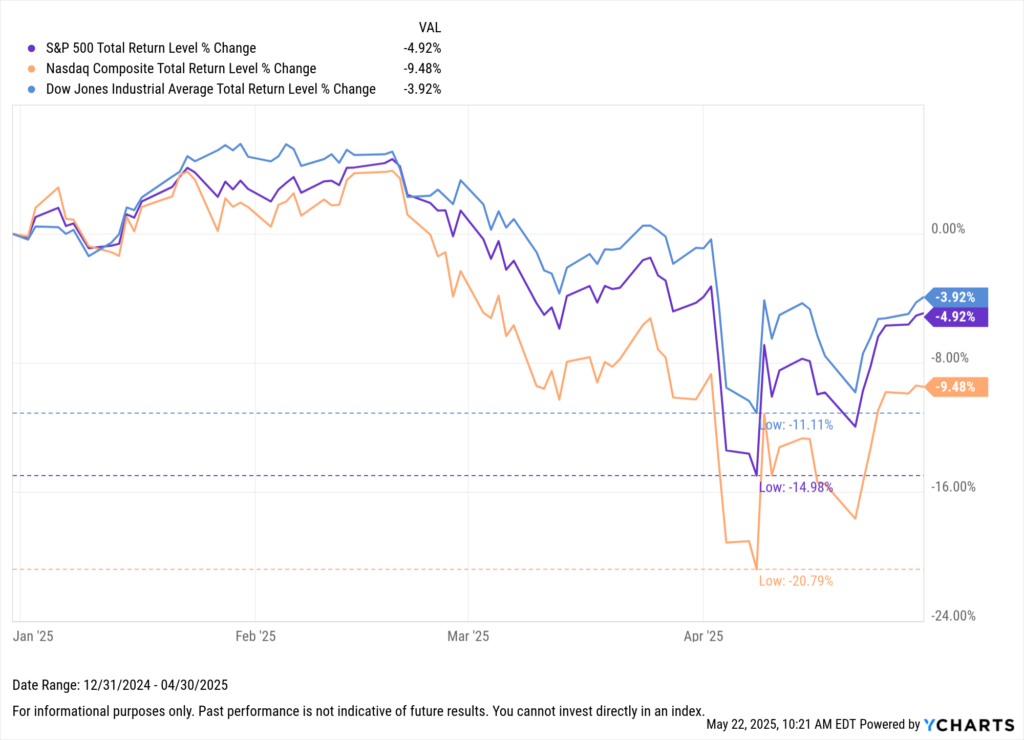
Driving this shift was a wave of uncertainty triggered by President Trump’s early-April announcement of sweeping tariffs. The market reaction was immediate: the S&P 500 recorded its fifth-largest two-day percentage drop since 1950, and both the Dow and Nasdaq fell into correction or bear market territory. Though the administration later delayed some measures, volatility lingered.
Download Visual | Modify in YCharts
Against that backdrop, investor flows tell a story of repositioning rather than panic. Categories offering short-duration yield, equity income, and global diversification stood out as relative bright spots.
In the following sections, we’ll explore the ETF peer groups that defied the broader outflows and highlight where advisors and investors found opportunity in an otherwise turbulent month.
Short U.S. Treasury ETFs Defy the Trend – Inflows Top $18B
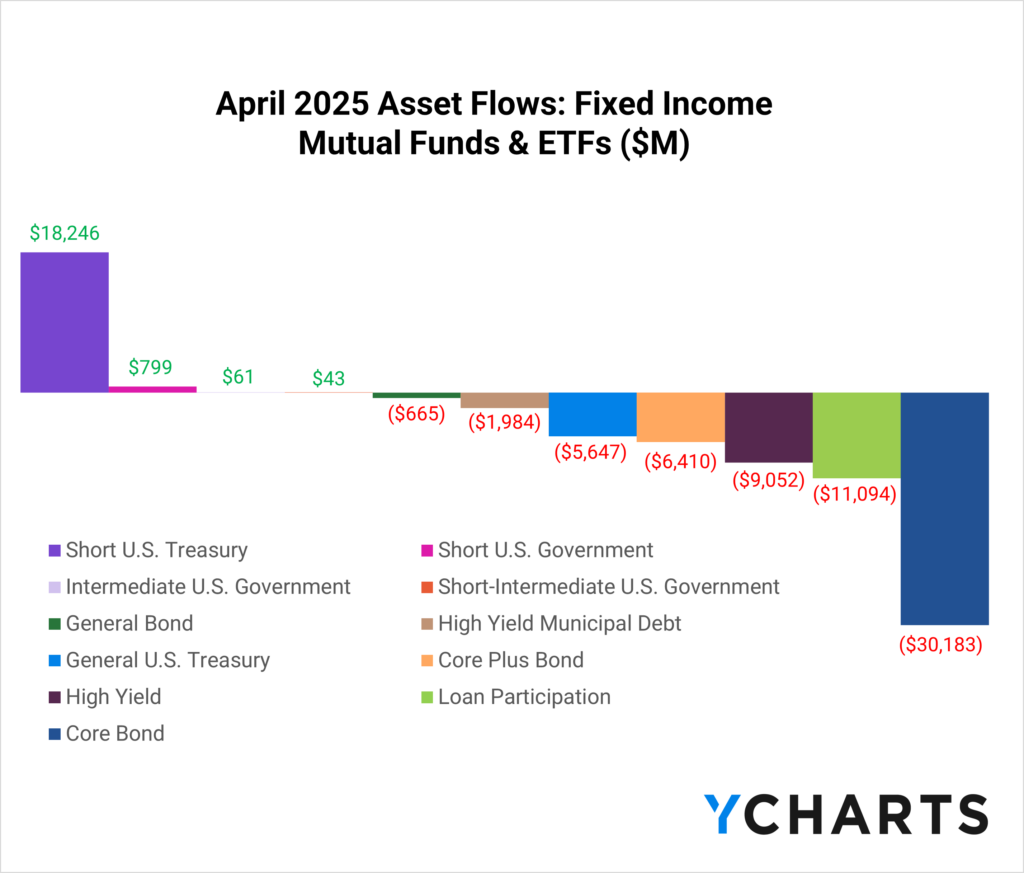
While most corners of fixed income saw heavy redemptions, Short U.S. Treasury funds remain a magnet for capital amid decade-high short-term yields and muted duration risk.
The category pulled in $18.2 billion during April alone, virtually all of it into ETFs. This demand starkly contrasted the $30 billion lost from core bonds and the $20 billion withdrawn from loan and high-yield strategies, which were preferred just a few months ago.
Subscribe to the Fund Flow Report
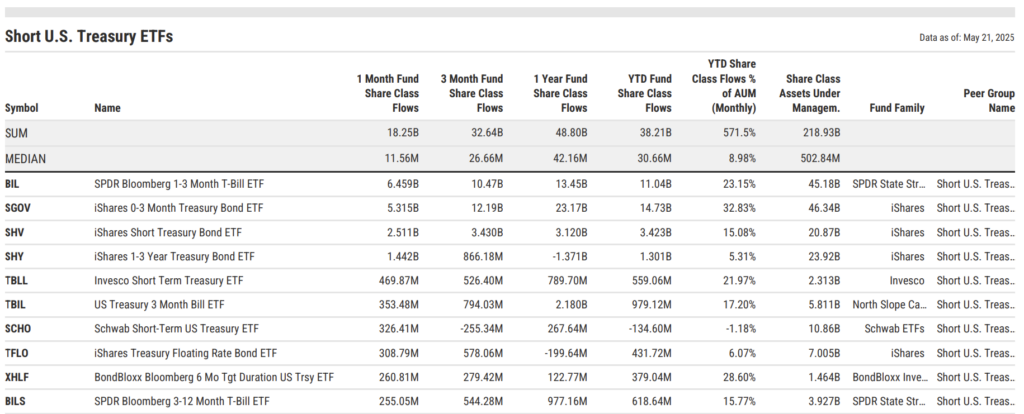
Year-to-date flows have accounted for a median of 9% of end-of-April AUM across strategies in the peer group.
The SPDR Bloomberg 1-3 Month T-Bill ETF (BIL) led the way with $6.5 billion in April flows, and year-to-date flows have contributed to 23.2% of its end-of-April AUM. The iShares 0-3 Month Treasury Bond ETF (SGOV) added $5.3 billion in April, and its year-to-date inflows totaled 32.8% of its AUM, the highest among the major players.
iShares’ Short Treasury Bond ETF (SHV) brought in $2.5 billion, with YTD flows accounting for 15.1% of its end-of-April AUM. The iShares 1-3 Year Treasury Bond ETF (SHY) drew $1.4 billion in April, lifting YTD flows to 5.3% of assets. The Invesco Short Term Treasury ETF (TBLL) posted $470 million in inflows, with YTD flows representing 22% of its total AUM.
This continued demand for ultra-short solutions signals an advisor preference for capital preservation vehicles that still offer meaningful yield.
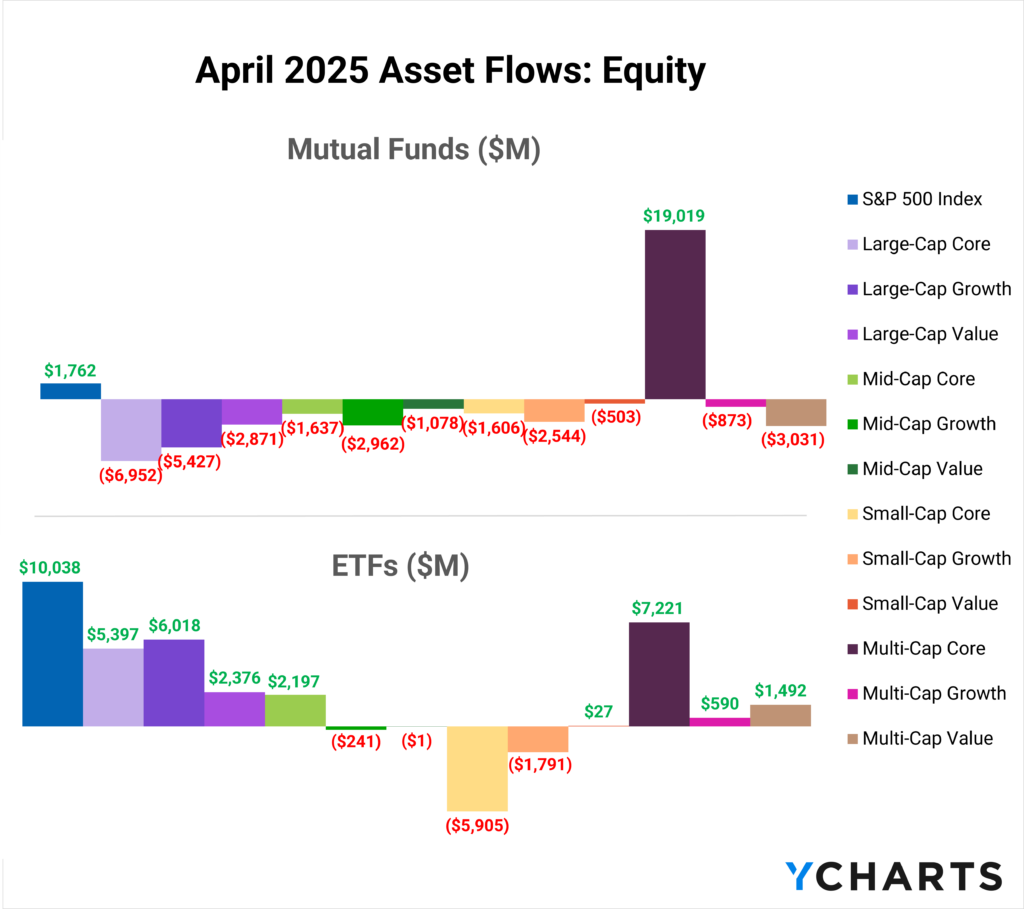
Core Equity Allocations Lead the Way
While short-duration fixed income was the primary bright spot in April’s bond landscape, equities told a different story, one of broad-based ETF strength. Core and growth-oriented equity ETFs posted solid inflows across market caps, geographies, and strategies, suggesting a renewed appetite for long-term positioning, dip buying, and portfolio rebalancing.
Subscribe to the Fund Flow Report
Sign up for our free monthly Fund Flow Report to stay updated on how assets are moving in and out of these strategies:
Multi-Cap Core ETFs Power Forward
With the exception of S&P 500 ETFs, Multi-Cap Core ETFs were the biggest winners in April, pulling in $7.2 billion and $21.3 billion year-to-date.
With a total addressable market (TAM) surpassing $830 billion, Multi-Cap Core ETFs remain a foundational piece of advisor portfolios. The Vanguard Total Stock Market Index Fund ETF (VTI) led the way with $4.2 billion in April inflows, and YTD inflows represent 3.1% of its end-of-April AUM. The iShares Core S&P Total US Stock Market ETF (ITOT) followed with $2.5 billion, helping drive the YTD flows that account for 5.2% of its AUM year-to-date. The T. Rowe Price Capital Appreciation Equity ETF (TCAF) attracted $310 million during April. YTD flows account for a whopping 30.3% of AUM, signaling advisor appetite for active core allocations.
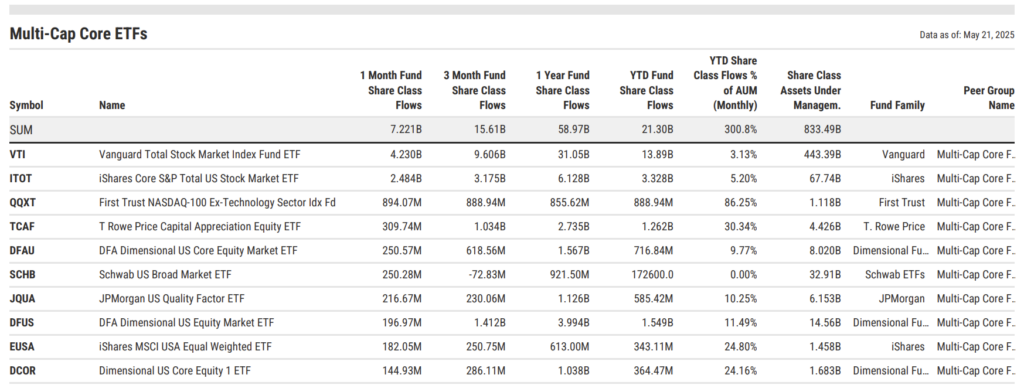
Also standing out were the First Trust NASDAQ-100 Ex-Technology Sector Index Fund (QQXT), which brought in $894 million for the month and YTD flows represent 86.3% of the strategy’s assets, and the Dimensional US Equity Market ETF (DFUS), which added $197 million in April and YTD flows are responsible for 11.5% of AUM.
Whether targeting traditional beta, smart beta, or active management, multi-cap core allocations remain a central tool for advisors balancing simplicity, diversification, and cost-efficiency—all while participating in broad U.S. equity upside.
Large-Cap Growth ETFs Sustain Strength
Large-Cap Growth ETFs continued to capitalize on renewed investor confidence in technology, attracting $6 billion in April and $26.1 billion year-to-date. With a TAM of $905 billion, those YTD flows represent a median of 7.1% of end-of-April AUM across strategies.
The Vanguard Growth Index Fund ETF (VUG) brought in $2.6 billion during April, with year-to-date flows accounting for 4.2% of its AUM. The Invesco NASDAQ 100 ETF (QQQM) added $2 billion in April, and its YTD flows represented 14.3% of total AUM. The Schwab US Large-Cap Growth ETF (SCHG) pulled in $2 billion during the month, pushing its year-to-date flows to $3.6 billion, or 9.6% of AUM.
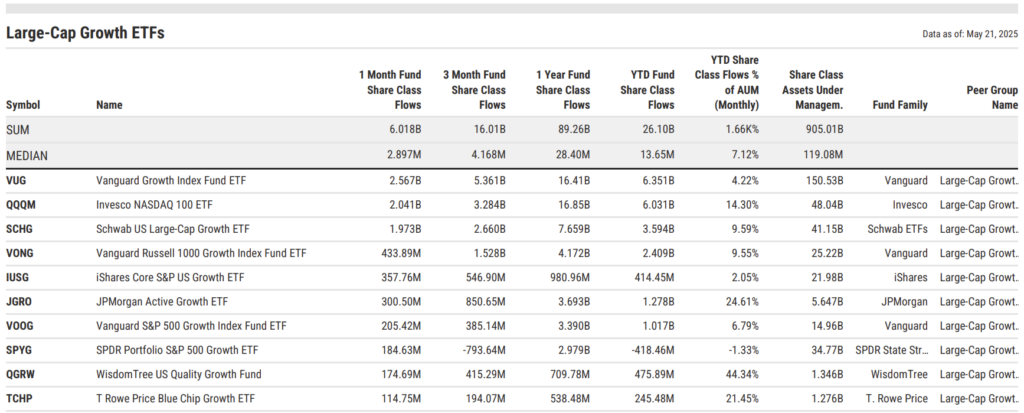
Advisors also leaned into active and thematic growth strategies, with year-to-date flows representing a significant share of total assets in several standout funds. The Harbor Long-Term Growers ETF (WINN) saw YTD inflows equal to 16.6% of its end-of-April AUM, while the Fidelity Blue Chip Growth ETF (FBCG) recorded inflows amounting to 34.9%. The WisdomTree US Quality Growth Fund (QGRW)’s YTD flows account for an impressive 44.3% of its AUM.
Equity Income ETFs Build Momentum
With a TAM reaching over $400 billion, Equity Income ETFs extended their strong run in April, bringing in $4.9 billion in net flows. The category has accumulated $11.7 billion year-to-date, reflecting sustained advisor demand for income-focused strategies amid ongoing rate volatility and macroeconomic uncertainty.
Year-to-date flows represented a median of 4.3% of end-of-April AUM, highlighting advisor demand for dividend-paying equities as both a defensive position and a source of income.
The Schwab US Dividend Equity ETF (SCHD) led the category in April with $1.5 billion in inflows; its YTD flows now represent 6.8% of its AUM. The Vanguard Dividend Appreciation ETF (VIG) followed with $1 billion for the month, bringing its YTD flow total to $1.2 billion, equivalent to 1.4% of its AUM.
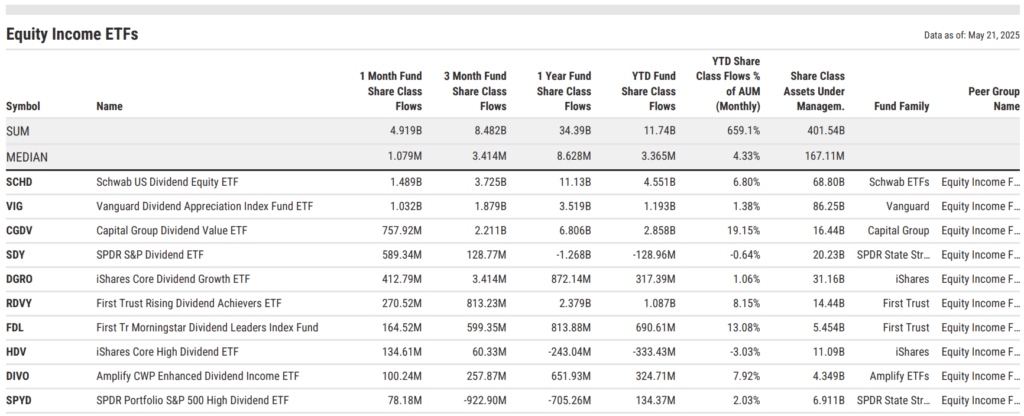
The Capital Group Dividend Value ETF (CGDV) continued its rise with $758 million in April inflows, and YTD flows now represent 19.2% of total assets. Similarly, the SPDR S&P Dividend ETF (SDY) brought in $589 million during the month. However, its YTD flows remain negative. The Bahl & Gaynor Small/Mid Cap Income Growth ETF (SMIG) added $70 million in April, and YTD flows are equivalent to 27.7% of its AUM.
Notably, the Columbia US Equity Income ETF (EQIN) added $39 million in April, and its YTD flows represent 33.5% of AUM, making it one of the fastest growers on a relative basis.
For advisors seeking to balance equity participation with reliable yield, the equity income space continues to offer a compelling middle ground.
International Multi-Cap Core ETFs Continue Drawing Flows
With a $510+ billion TAM, International Multi-Cap Core ETFs continue to draw long-term capital from advisors seeking global diversification. The category brought in $3.6 billion in April, bringing year-to-date net inflows to $16.7 billion.
Year-to-date flows equated to a median of 4.4% of end-of-April AUM across ETFs in the category, reinforcing the persistent appeal of global equity diversification, especially during heightened geopolitical noise.
The Vanguard Total International Stock Index Fund ETF (VXUS) led the category with $949 million in April inflows, and YTD flows now account for 5.6% of its AUM. Close behind, the Vanguard Developed Markets ETF (VEA) pulled in $577 million for the month, with YTD flows representing 1.9% of AUM.
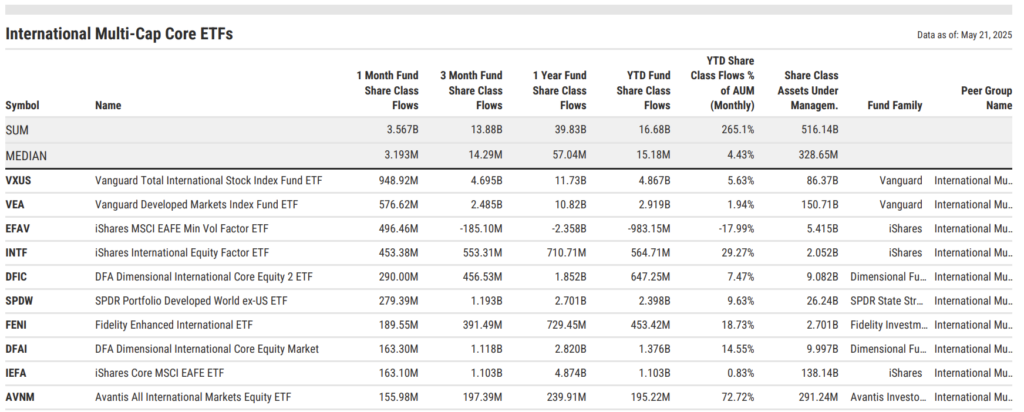
The iShares MSCI EAFE Minimum Volatility ETF (EFAV) recorded $496 million in April flows, though its YTD total remains negative. Meanwhile, the iShares International Equity Factor ETF (INTF) brought in $453 million and has accumulated YTD flows equal to 29.3% of its AUM. Rounding out the top five, the DFA Dimensional International Core Equity 2 ETF (DFIC) added $290 million in April, with year-to-date flows totaling 7.5% of its AUM.
Outside the top five, several additional funds also posted meaningful inflows. The DFA Dimensional International Core Equity Market ETF (DFAI) brought in $163 million in April, with YTD flows representing 14.6% of its AUM. The Fidelity Enhanced International ETF (FENI) added $190 million, growing 18.7% of AUM since the start of the year.
Meanwhile, the Avantis All International Markets Equity ETF (AVNM) collected $156 million in April, and its YTD flows now account for a striking 72.7% of total assets, making it one of the strongest relative gainers in the entire category.
Conclusion
April 2025 offered a sharp reminder of how quickly markets can reprice expectations. Yet amid the volatility, flows showed that advisors aren’t abandoning risk, they’re repositioning it.
As we head into the second half of the year, staying ahead of these evolving trends will be key to positioning strategies in a way that resonates. Subscribe to the Fund Flow Report for timely insights, and book time with our asset management specialists to see why leading firms rely on YCharts to equip their teams with the tools and visuals that drive meaningful advisor conversations.
Whenever you’re ready, here’s how YCharts can help you:
1. Book time with our asset management specialists
2. Want to test out YCharts for free?
Start a no-risk 7-Day Free Trial.
3. Sign up for a copy of our Fund Flows Report and Visual Deck to stay on top of ETF trends:
Sign up to recieve a copy of our monthly Fund Flows Report:Disclaimer
©2025 YCharts, Inc. All Rights Reserved. YCharts, Inc. (“YCharts”) is not registered with the U.S. Securities and Exchange Commission (or with the securities regulatory authority or body of any state or any other jurisdiction) as an investment adviser, broker-dealer or in any other capacity, and does not purport to provide investment advice or make investment recommendations. This report has been generated through application of the analytical tools and data provided through ycharts.com and is intended solely to assist you or your investment or other adviser(s) in conducting investment research. You should not construe this report as an offer to buy or sell, as a solicitation of an offer to buy or sell, or as a recommendation to buy, sell, hold or trade, any security or other financial instrument. For further information regarding your use of this report, please go to: ycharts.com/about/disclosure.
Next Article
Propose with Precision: Portfolio Recommendations at the Household LevelRead More →