Best Performing Mutual Funds of the Last 10 Years: A Financial Advisor’s Perspective
Updated as of: June 3, 2026
Mutual funds have long been a staple in portfolios for their ability to deliver diversification, professional management, and tailored exposure to specific sectors or asset classes.
Evaluating long-term performance is essential for identifying funds that demonstrate resilience, consistent returns, and strong management practices. This article highlights the best-performing mutual funds over various lookback periods in the last decade.
To create this list, we analyzed the entire mutual fund universe using the YCharts Fund Screener to find the best-performing US-domiciled equity mutual funds over 1-year, 3-year, 5-year, and 10-year timeframes. (Leveraged and inverse mutual funds as well as those in the alternative currency strategy and options arbitrage strategy peer groups were excluded to focus on long-term investment vehicles that align with broader financial planning goals)
The following best-performing mutual funds are shown with total return, expense ratio and AUM and metrics to showcase recent trends and shifts. All performance data is standardized to ensure comparability across funds and lookback periods.
Table of Contents
Looking for lists of the best performing ETFs? Check out our analysis on the Best Performing ETFs here.
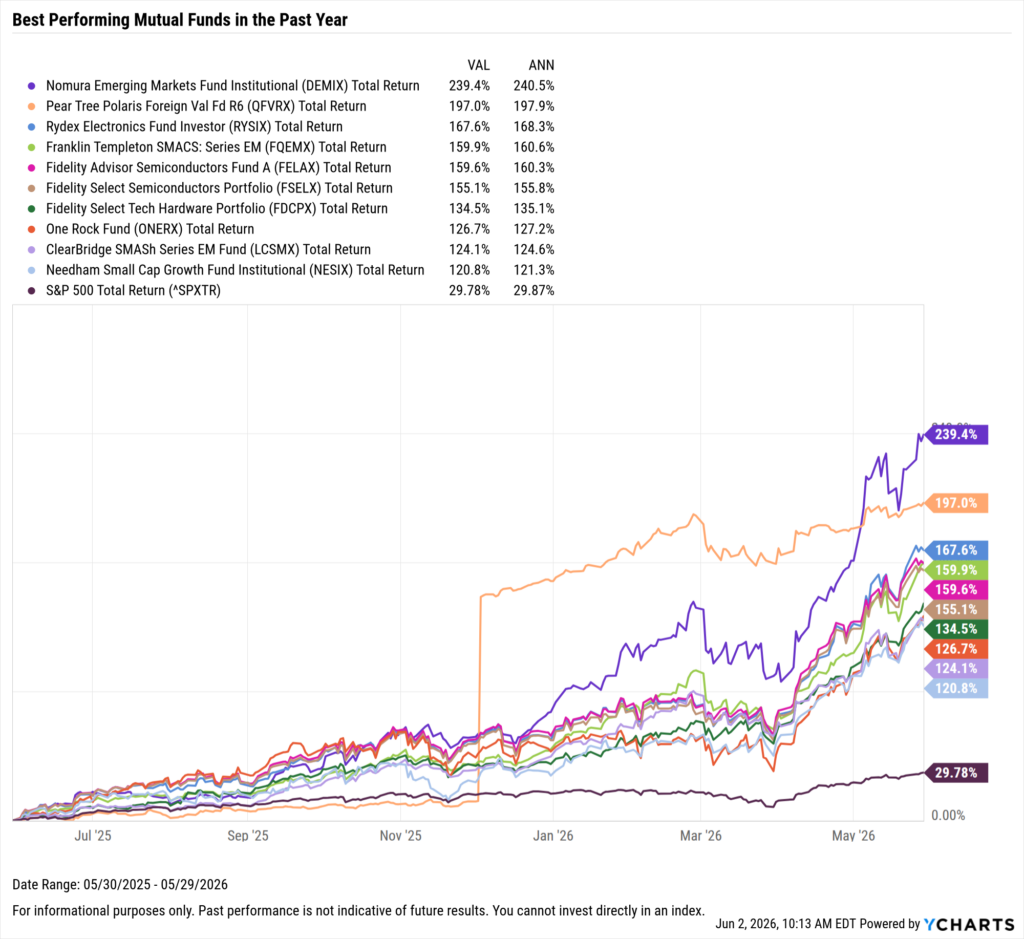
Best Performing Mutual Funds in the Last Year
These are the top-performing mutual funds over the past year, as of May 31, 2026.
| Symbol | Name | 1 Year Total Returns (Monthly) | Net Expense Ratio | Share Class Assets Under Management | Peer Group Name |
|---|---|---|---|---|---|
| DEMIX | Nomura Emerging Markets Fund Institutional | 239.37% | 1.15% | $7,688,025,900 | Emerging Markets Funds |
| QFVRX | Pear Tree Polaris Foreign Val Fd R6 | 197.03% | 0.94% | $483,072,931 | International Multi-Cap Value |
| RYSIX | Rydex Electronics Fund Investor | 167.63% | 1.38% | $235,464,170 | Science & Technology Funds |
| FQEMX | Franklin Templeton SMACS: Series EM | 159.90% | 0.00% | $2,005,735 | Emerging Markets Funds |
| FELAX | Fidelity Advisor Semiconductors Fund A | 159.62% | 0.94% | $2,882,646,783 | Science & Technology Funds |
| FSELX | Fidelity Select Semiconductors Portfolio | 155.10% | 0.60% | $43,114,517,877 | Science & Technology Funds |
| FDCPX | Fidelity Select Tech Hardware Portfolio | 134.52% | 0.67% | $2,669,796,759 | Science & Technology Funds |
| ONERX | One Rock Fund | 126.69% | 1.50% | $57,822,092 | Multi-Cap Growth Funds |
| LCSMX | ClearBridge SMASh Series EM Fund | 124.12% | 0.00% | $1,731,790,890 | Emerging Markets Funds |
| NESIX | Needham Small Cap Growth Fund Institutional | 120.78% | 1.19% | $239,874,202 | Small-Cap Core Funds |
Start a Free Trial to See Full Rankings | View & Modify in Fund Screener
Download Visual | Modify in YCharts
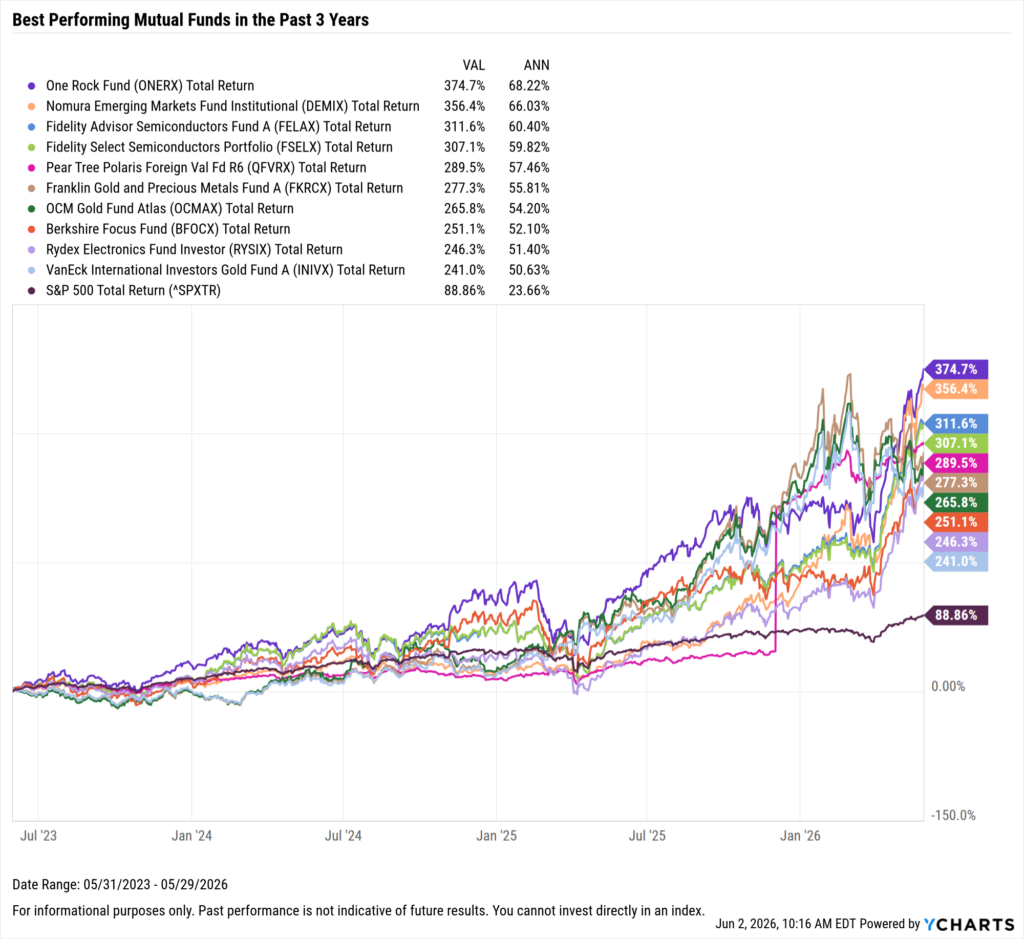
Best Performing Mutual Funds in the Last 3 Years
These are the top-performing mutual funds on an annualized basis between June 1, 2023 and May 31, 2026.
| Symbol | Name | 3 Year Total Returns (Monthly) | Annualized 3 Year Total Returns (Monthly) | Net Expense Ratio | Share Class Assets Under Management | Peer Group Name |
|---|---|---|---|---|---|---|
| ONERX | One Rock Fund | 374.71% | 68.06% | 1.50% | $57,822,092 | Multi-Cap Growth Funds |
| DEMIX | Nomura Emerging Markets Fund Institutional | 356.42% | 65.88% | 1.15% | $7,688,025,900 | Emerging Markets Funds |
| FELAX | Fidelity Advisor Semiconductors Fund A | 311.60% | 60.26% | 0.94% | $2,882,646,783 | Science & Technology Funds |
| FSELX | Fidelity Select Semiconductors Portfolio | 307.14% | 59.68% | 0.60% | $43,114,517,877 | Science & Technology Funds |
| QFVRX | Pear Tree Polaris Foreign Val Fd R6 | 289.46% | 57.33% | 0.94% | $483,072,931 | International Multi-Cap Value |
| FKRCX | Franklin Gold and Precious Metals Fund A | 277.34% | 55.68% | 0.87% | $2,290,356,300 | Precious Metals Equity Funds |
| OCMAX | OCM Gold Fund Atlas | 265.80% | 54.08% | 1.63% | $178,595,186 | Precious Metals Equity Funds |
| BFOCX | Berkshire Focus Fund | 251.06% | 51.98% | 1.95% | $450,679,387 | Multi-Cap Growth Funds |
| RYSIX | Rydex Electronics Fund Investor | 246.25% | 51.29% | 1.38% | $235,464,170 | Science & Technology Funds |
| INIVX | VanEck International Investors Gold Fund A | 240.99% | 50.52% | 1.31% | $642,023,952 | Precious Metals Equity Funds |
Start a Free Trial to See Full Rankings | View & Modify in Fund Screener
Download Visual | Modify in YCharts
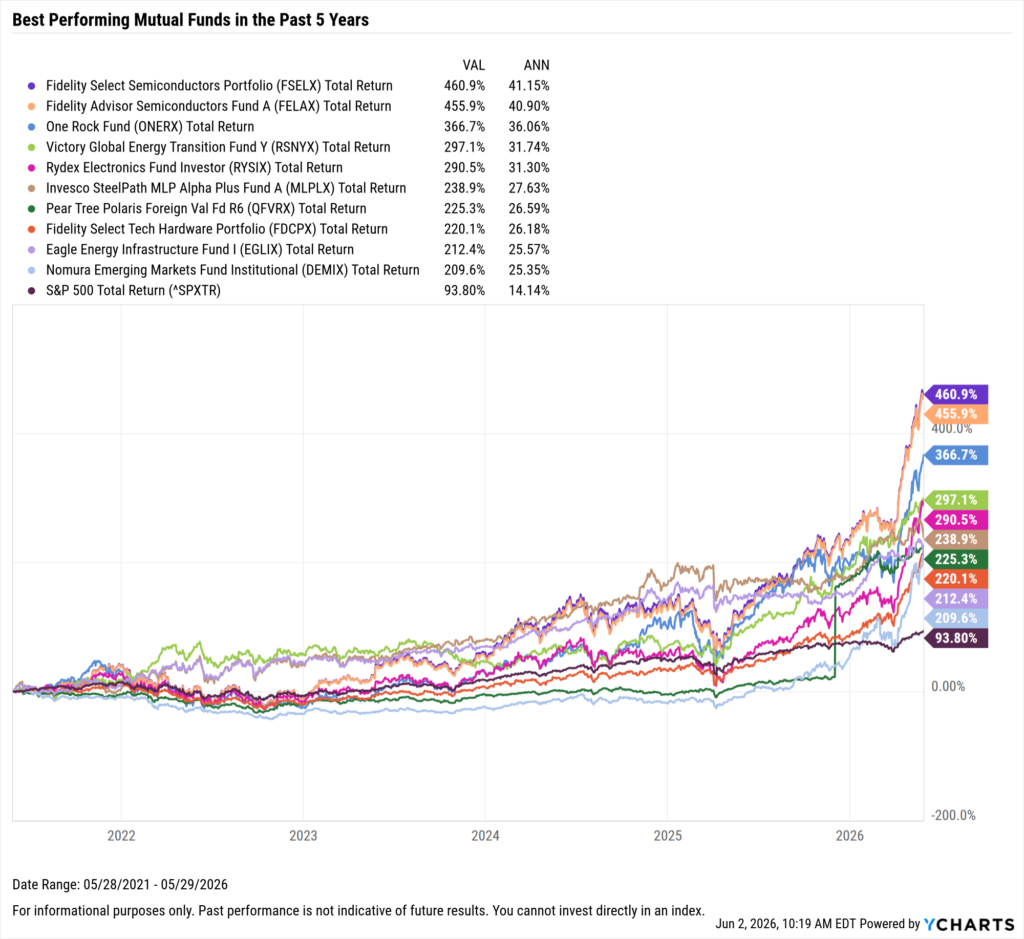
Best Performing Mutual Funds in the Last 5 Years
These are the top-performing mutual funds on an annualized basis between June 1, 2021 and May 31, 2026.
| Symbol | Name | 5 Year Total Returns (Monthly) | Annualized 5 Year Total Returns (Monthly) | Net Expense Ratio | Share Class Assets Under Management | Peer Group Name |
|---|---|---|---|---|---|---|
| FSELX | Fidelity Select Semiconductors Portfolio | 460.85% | 41.18% | 0.60% | $43,114,517,877 | Science & Technology Funds |
| FELAX | Fidelity Advisor Semiconductors Fund A | 455.86% | 40.93% | 0.94% | $2,882,646,783 | Science & Technology Funds |
| ONERX | One Rock Fund | 366.66% | 36.08% | 1.50% | $57,822,092 | Multi-Cap Growth Funds |
| RSNYX | Victory Global Energy Transition Fund Y | 297.08% | 31.76% | 1.15% | $507,877,406 | Global Natural Resources Funds |
| RYSIX | Rydex Electronics Fund Investor | 290.46% | 31.32% | 1.38% | $235,464,170 | Science & Technology Funds |
| MLPLX | Invesco SteelPath MLP Alpha Plus Fund A | 238.87% | 27.65% | 3.74% | $197,568,718 | Energy MLP Funds |
| QFVRX | Pear Tree Polaris Foreign Val Fd R6 | 225.33% | 26.61% | 0.94% | $483,072,931 | International Multi-Cap Value |
| FDCPX | Fidelity Select Tech Hardware Portfolio | 220.08% | 26.20% | 0.67% | $2,669,796,759 | Science & Technology Funds |
| EGLIX | Eagle Energy Infrastructure Fund I | 212.41% | 25.59% | 1.40% | $176,529,964 | Energy MLP Funds |
| DEMIX | Nomura Emerging Markets Fund Institutional | 209.63% | 25.36% | 1.15% | $7,688,025,900 | Emerging Markets Funds |
Start a Free Trial to See Full Rankings | View & Modify in Fund Screener
Download Visual | Modify in YCharts
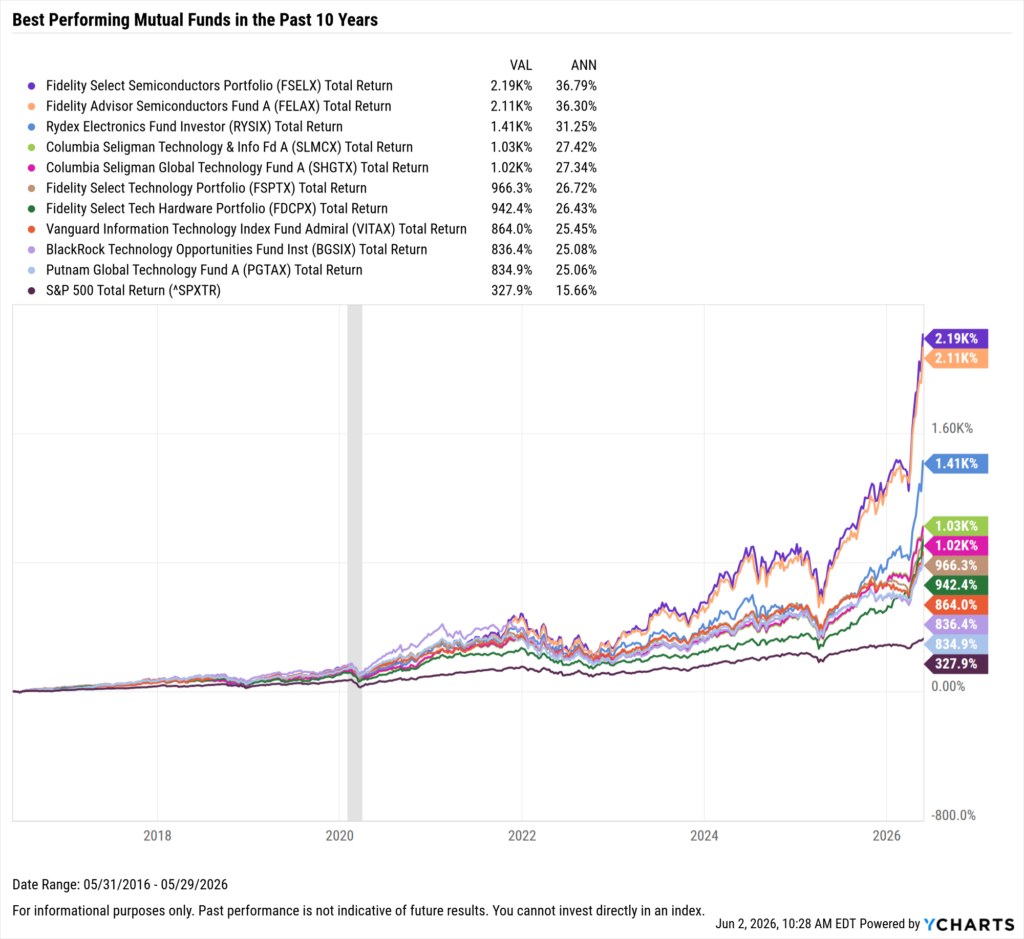
Best Performing Mutual Funds in the Last 10 Years
These are the top-performing mutual funds on an annualized basis between June 1, 2016 and May 31, 2026.
| Symbol | Name | 10 Year Total Returns (Monthly) | Annualized 10 Year Total Returns (Monthly) | Net Expense Ratio | Share Class Assets Under Management | Peer Group Name |
|---|---|---|---|---|---|---|
| FSELX | Fidelity Select Semiconductors Portfolio | 2189.07% | 36.76% | 0.60% | $43,114,517,877 | Science & Technology Funds |
| FELAX | Fidelity Advisor Semiconductors Fund A | 2108.43% | 36.27% | 0.94% | $2,882,646,783 | Science & Technology Funds |
| RYSIX | Rydex Electronics Fund Investor | 1414.47% | 31.23% | 1.38% | $235,464,170 | Science & Technology Funds |
| SLMCX | Columbia Seligman Technology & Info Fd A | 1027.04% | 27.41% | 1.16% | $15,621,336,409 | Science & Technology Funds |
| SHGTX | Columbia Seligman Global Technology Fund A | 1019.98% | 27.33% | 1.25% | $2,593,437,646 | Global Science/Technology Funds |
| FSPTX | Fidelity Select Technology Portfolio | 966.30% | 26.70% | 0.61% | $22,249,307,441 | Science & Technology Funds |
| FDCPX | Fidelity Select Tech Hardware Portfolio | 942.35% | 26.42% | 0.67% | $2,669,796,759 | Science & Technology Funds |
| VITAX | Vanguard Information Technology Index Fund Admiral | 864.02% | 25.43% | 0.09% | $16,340,199,127 | Science & Technology Funds |
| BGSIX | BlackRock Technology Opportunities Fund Inst | 836.37% | 25.07% | 0.92% | $4,408,665,357 | Global Science/Technology Funds |
| PGTAX | Putnam Global Technology Fund A | 834.90% | 25.05% | 1.04% | $927,855,260 | Global Science/Technology Funds |
Start a Free Trial to See Full Rankings | View & Modify in Fund Screener
Download Visual | Modify in YCharts
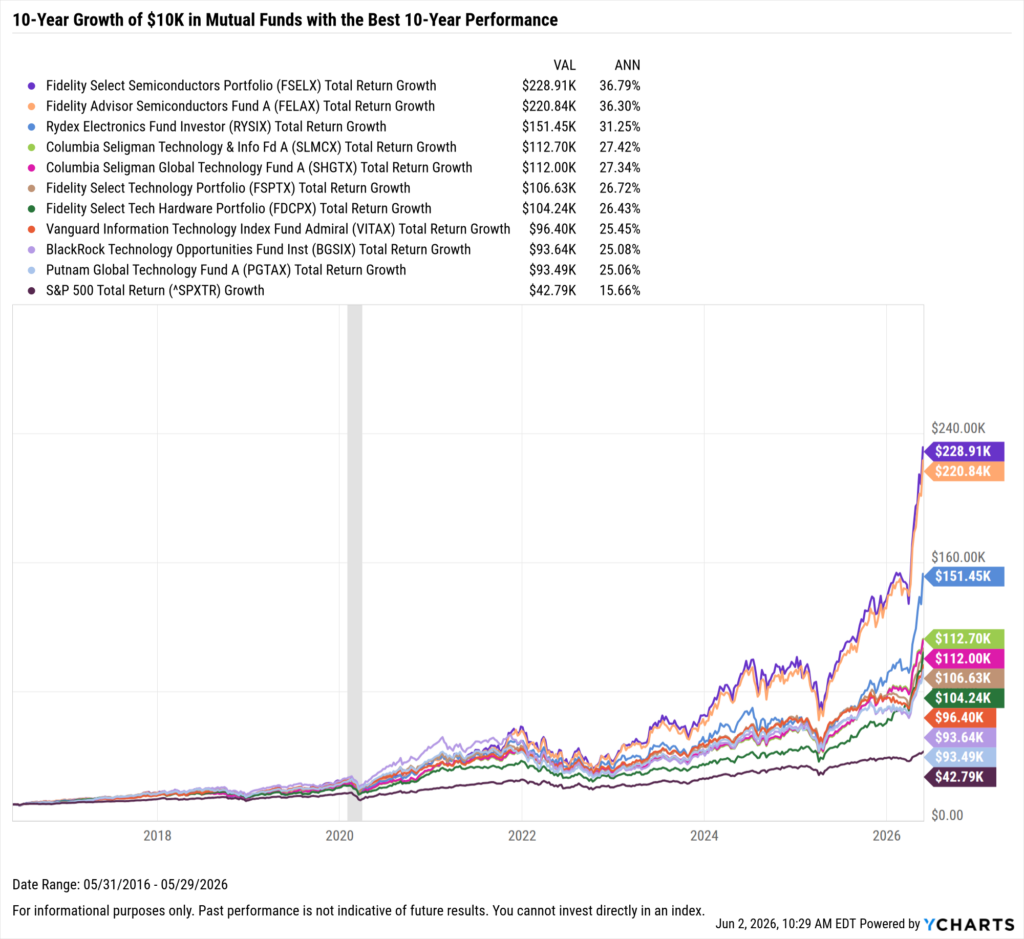
What Was the Growth of $10,000 in the Top Bond Mutual Funds Over the Last 10 Years?
If you invested $10,000 10 years ago into any of the ten best-performing mutual funds over the last 10 years, your balance today would be no less than $93K.
Two of the top three best-performing mutual funds in the last 10 years were semiconductor funds. A $10,000 investment into the Fidelity Advisor Semiconductors Portfolio fund (FSELX) would be worth $228,910 today. Behind the Fidelity Advisor Semiconductors Portfolio fund was the Fidelity Advisor Semiconductors Fund A (FELAX); investing $10,000 into FELAX back in 2016 would’ve turned into a little over $220K.
Download Visual | Modify in YCharts
Whenever you’re ready, here’s how YCharts can help you:
1. Looking to Move On From Your Investment Research and Analytics Platform?
2. Want to test out YCharts for free?
Start a no-risk 7-Day Free Trial.
3. Sign up for a copy of our Fund Flows Report and Visual Deck to stay on top of mutual fund trends:
Sign up to recieve a copy of our monthly Fund Flows Report:Disclaimer
©2026 YCharts, Inc. All Rights Reserved. YCharts, Inc. (“YCharts”) is not registered with the U.S. Securities and Exchange Commission (or with the securities regulatory authority or body of any state or any other jurisdiction) as an investment adviser, broker-dealer or in any other capacity, and does not purport to provide investment advice or make investment recommendations. This report has been generated through application of the analytical tools and data provided through ycharts.com and is intended solely to assist you or your investment or other adviser(s) in conducting investment research. You should not construe this report as an offer to buy or sell, as a solicitation of an offer to buy or sell, or as a recommendation to buy, sell, hold or trade, any security or other financial instrument. For further information regarding your use of this report, please go to: ycharts.com/about/disclosure.
Next Article
The 10 Best Performing ETFs Over the Last 10 YearsRead More →