Boosting Model Adoption Across Large RIAs Through a Unified Workflow
Model portfolios have become foundational to how enterprise RIAs, broker-dealers, trusts, and banks scale investment management. They reduce portfolio dispersion, ensure consistent risk management, and enable advisors to focus more on planning and client relationships.
State Street’s 2024 global research reinforces this shift, noting that model portfolios increasingly help advisors balance operational demands with personalized, planning-based engagement.
Yet even the strongest, best-designed models can only drive value when advisors actually use them. And across the industry, model adoption remains one of the biggest operational bottlenecks. Not because advisors resist—data shows advisors overwhelmingly believe in model value—but because workflows surrounding how advisors access, evaluate, and present models remain fragmented.
In fact, 54% of advisors source models through TAMPs, and 45% through home office teams. Yet, nearly half still modify models or use them selectively, depending on client assets.
This behavior signals process friction: advisors want models, but their tools and workflows haven’t kept up.
This is where YCharts is changing the game.
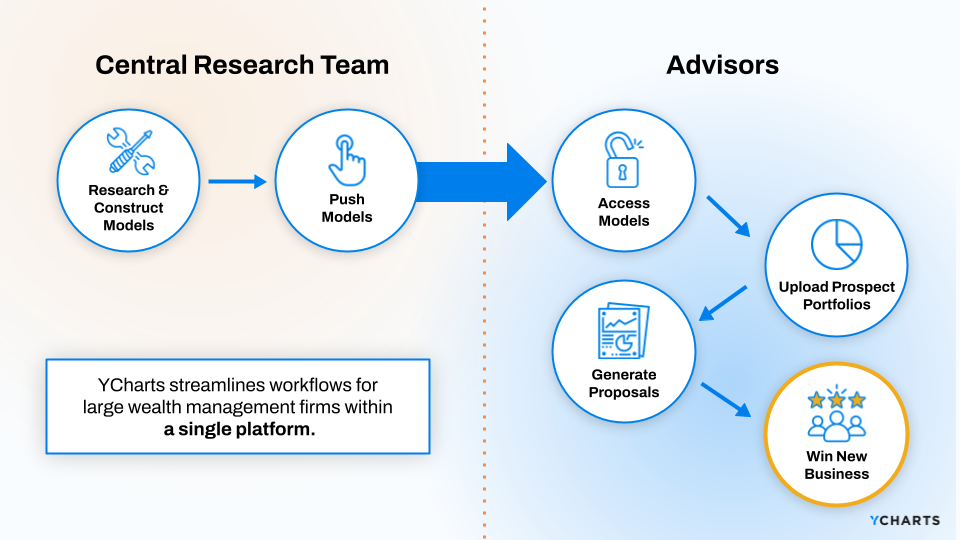
A growing number of multi-office firms are seeing dramatic improvements in advisor adoption by consolidating the entire workflow—from portfolio to proposal—into a single platform.
This end-to-end workflow is crucial because it provides advisors with the necessary tools to evaluate a client’s current holdings quickly, compare them to a firm-approved model, and generate a polished, compliant proposal that clearly and compellingly demonstrates how the model will help achieve the client’s goals.
When advisors can move seamlessly from portfolio→ model comparison → client-ready proposal, adoption becomes a natural outcome.
YCharts is one of the few platforms built with this exact workflow in mind. It connects research, home office teams, and advisors, making models easier to build, update, distribute, understand, and ultimately present to clients.
Table of Contents
Why Model Adoption Breaks Down
Insights from State Street’s 2024 study provide important context: advisor behavior is shaped more by workflow constraints and perceived client expectations than by model skepticism. For example, 51% of advisors modify models because clients expect personalization, and 46% modify them to align with a client’s existing investment strategy.
These modifications are often driven by friction in the approval, distribution, or presentation process, not because the models are fundamentally insufficient.
Below is a consolidated view of the operational obstacles that impede advisor adoption:
- Model updates are exclusively distributed through quarterly or monthly PDFs or emails, creating version-control issues and field-wide inconsistency.
- Advisors can’t easily show how a model improves a client’s portfolio, making it difficult to articulate the value of switching.
- Proposals require multiple tools or manual uploads, introducing friction that lowers adoption and contributes to “selective customization.”
- Research teams lack systems to maintain accurate historical data, reducing advisor confidence in performance and allocations.
- Compliance requires templates and disclosures scattered across different systems, causing advisors to hesitate when using model-based proposals.
Meanwhile, investors who are placed in model portfolios report higher satisfaction, better clarity on goals, stronger alignment with risk expectations, and greater confidence in their advisors.
Suggesting adoption directly impacts client experience, trust, and retention.
Most of the issues above are operational. Advisors want to use models when the workflow is intuitive, fast, and client-friendly.
This is exactly why the portfolio → proposal experience is so important: it reduces friction at the key moment where adoption happens.
A Unified System That Supports Model Adoption from Research to Proposal
To improve adoption, enterprise firms are embracing technology that centralizes model construction, distribution, analytics, and proposal building.
YCharts is purpose-built for this challenge, giving home-office teams a single system to maintain firm-approved models, push updates instantly, and ensure every advisor engages with the most current data.
And that engagement isn’t theoretical.
YCharts’ enterprise users log in at an 80% WAU/MAU rate, far exceeding typical B2B SaaS benchmarks.
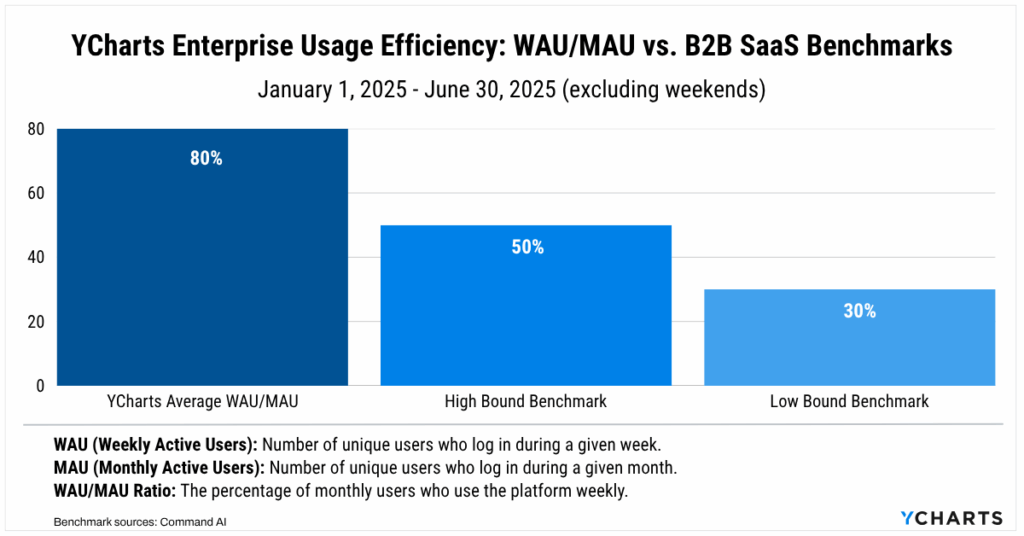
This level of usage signals something critical: advisors aren’t just enabled by home-office models in YCharts, they’re actively incorporating them into their daily workflows, reviewing dashboards, analyzing models, comparing portfolios, and generating proposals with remarkable consistency.
This deep, habitual engagement is what allows home offices to influence advisor behavior at scale. Because the firm’s models, analytics, and proposal tools all sit within the same environment advisors depend on for their daily research, client conversations, and portfolio work.
Below are the major stages enterprise firms streamline through YCharts to meaningfully increase advisor usage of home-office models.
Building & Optimizing Research-Driven Models the Right Way
Model adoption starts with quality and transparency. Research teams need robust tools to build, evaluate, and refine portfolios at scale.
With YCharts, firms can:
- Build portfolios using screeners and optimized analytics, leveraging stock and fund screeners, optimizers, and Excel integrations to refine allocations efficiently.
- Upload, track, and maintain historical holdings and returns, ensuring accurate long-term performance that strengthens advisor trust.
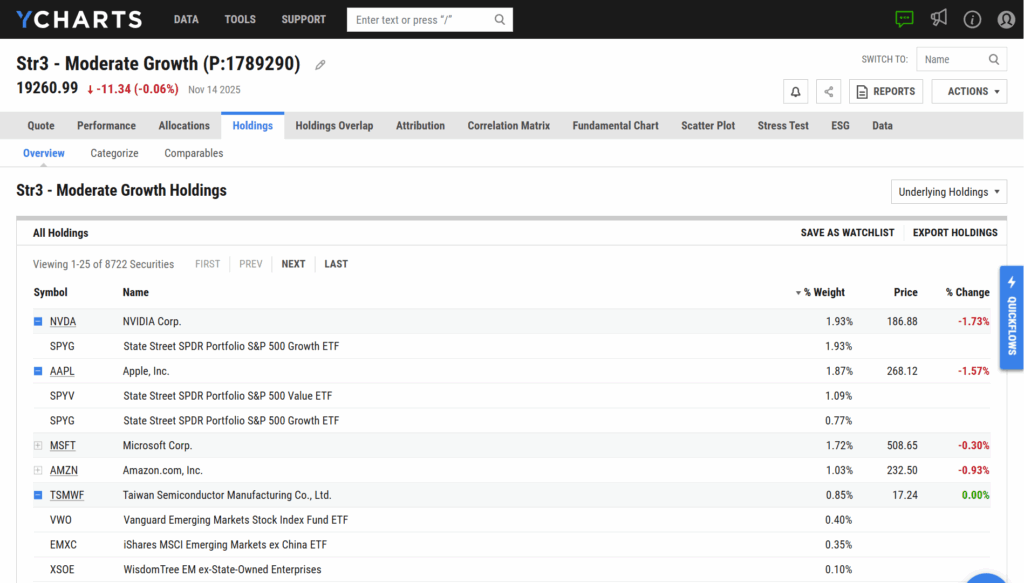
- Analyze allocations, factor exposures, and underlying holdings, giving research teams deep visibility to clearly communicate why a model is constructed the way it is.
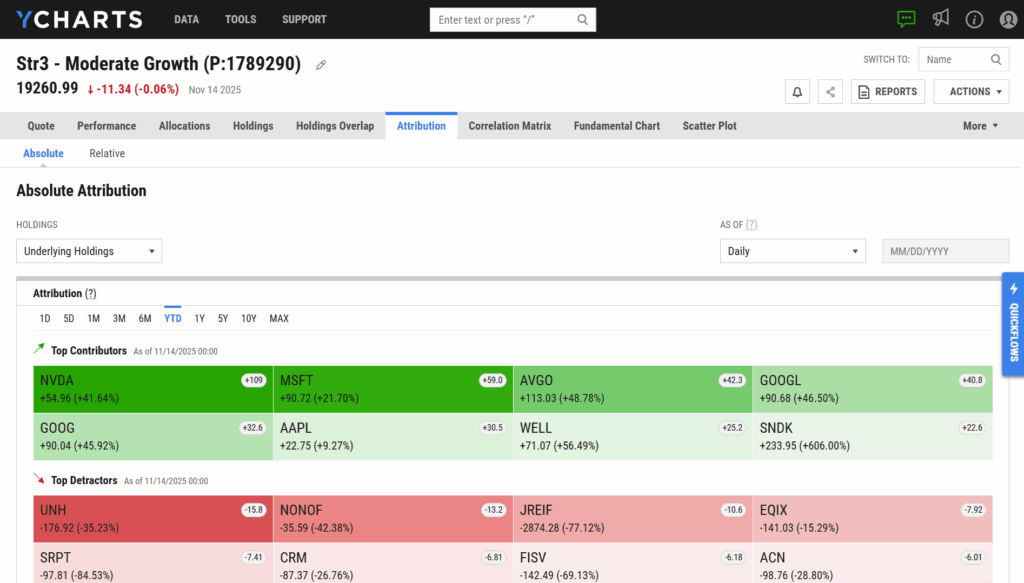
- Run attribution, stress tests, and benchmark analyses, generating insights that become advisor-ready talking points throughout the workflow.
A model built with strong analytics, supported by historical accuracy, and consistently updated sets the foundation for high adoption.
But it’s only the first step.
Centralizing Everything Through the Home Office
Home offices serve as the distribution hub—and a centralized system significantly enhances advisor consistency.
A strong home office workflow includes:
Firmwide Dashboards
Advisors access:
- Model Announcements
- Performance Highlights
- Investment Committee Notes
- Recent Changes
- Risk Summaries
This eliminates outdated documents and gives every advisor an always-current snapshot of model performance.
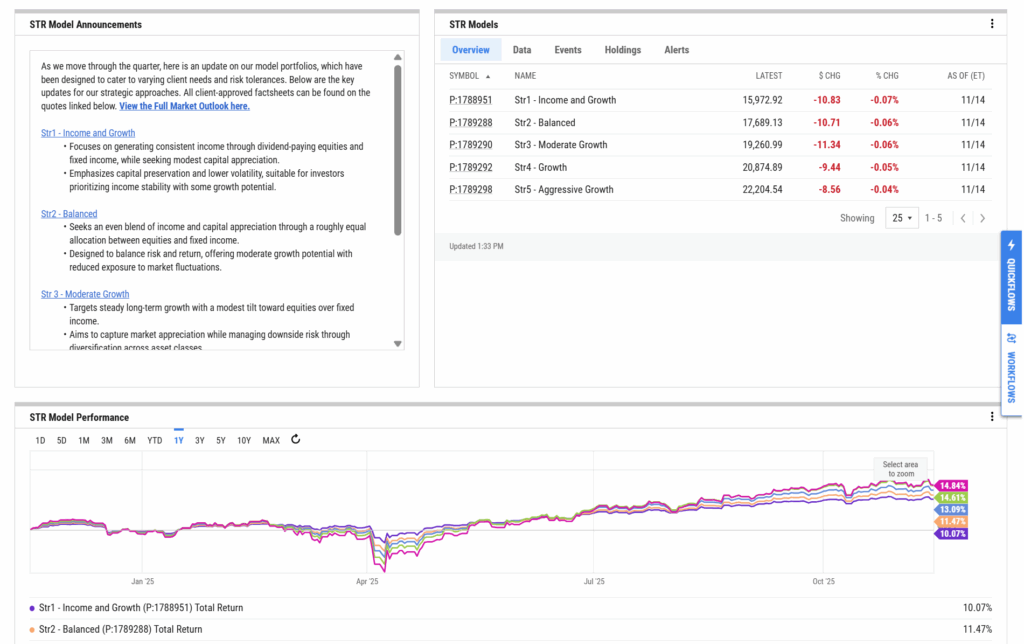
Instant Model Distribution
When research updates a model, advisors automatically see the newest version within their workflows. In this case, it would appear on the dashboard of their YCharts account when they sign in.
Compliance-Controlled Templates
Branding, disclosures, layout, and report rules can all be standardized and enforced across the firm.
Home office consistency ensures advisors stay aligned, but the real shift happens at the moment of client-facing comparison.
Portfolio-to-Proposal Workflow: The Inflection Point for Adoption
This is where YCharts solves the advisor friction point most directly.
Model adoption increases when advisors have a fast, clear, data-backed way to show clients why switching is beneficial.
In a single workflow, advisors can:
Extract a client’s current portfolio using AI
No manual entry, no messy spreadsheets, just upload and analyze. (Questions? Get them answered here.)
Compare that portfolio directly against the firm’s model
Side-by-side breakdowns show:
- Allocation gaps
- Region/Country exposures
- Risk Alignment
- Performance differences
- Sector-level changes
- Stress Test comparisons
Generate a branded, compliant proposal instantly
YCharts Proposals themselves become an engine for model adoption. They can be customized to include:
- Allocation summaries
- Model rationale
- Risk Profile alignment
- Stress Test visuals
- Historical Performance
- Underlying Holdings
- Transition Analysis with estimated tax impact
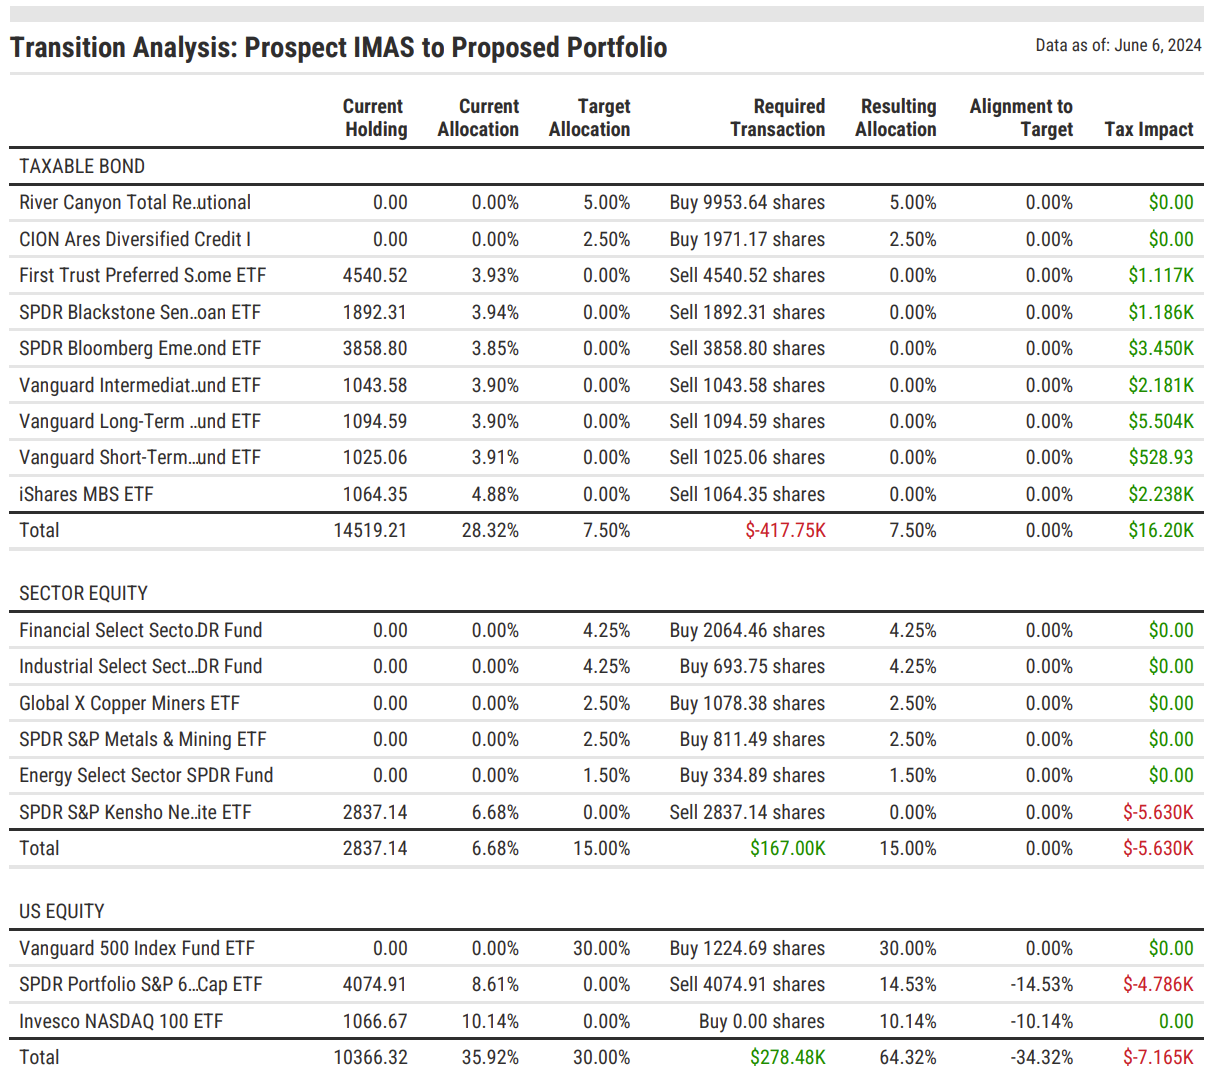
View a Sample Proposal Including Transition Analysis
Because everything is built into a single platform, advisors no longer need to stitch together data, visuals, and disclosures from disparate sources. They simply walk through the story.
The clarity of this workflow increases confidence and ultimately adoption.
See How Alan Doubled His Business Using YCharts Proposals
Automation Keeps Advisors Aligned Over Time
Model adoption is a continuous process. And a unified platform makes ongoing adoption much simpler through:
- Automated updates flowing directly into advisor dashboards, eliminating the need for advisors to recreate anything when allocations change.
- Real-time performance and risk analysis, ensuring advisors always have accurate and current talking points.
- Full compliance oversight, with every proposal and report automatically logged and archived for review.
- Consistent templates and disclosures across the firm, reducing dispersion and strengthening professional presentation.
A Unified Workflow Creates Natural Model Adoption
When research, home office leadership, and advisor tools all operate within the same system, the barriers to adoption naturally disappear.
The portfolio-to-proposal workflow provides advisors with everything they need to move prospects and clients into firm-approved models quickly, confidently, and compliantly. It closes the gap between insights and execution.
Firms that embrace this unified approach see:
- higher advisor adoption
- reduced portfolio dispersion
- more consistent client outcomes
- better compliance oversight
- and faster, more scalable organic growth
A unified research-to-proposal workflow makes model adoption the path of least resistance.
Turning consistency, compliance, and advisor alignment into the natural byproducts of how the firm already operates.
Put simply, when you unify the workflow, you multiply the adoption.
Want to improve advisor alignment and scale your model program?
Reach out to enterprise@ycharts.com to start the conversation.
Ready to try YCharts for yourself?
Start a no-risk 7-day free trial.
Follow YCharts Social Media to Unlock More Content!
Disclaimer
©2025 YCharts, Inc. All Rights Reserved. YCharts, Inc. (“YCharts”) is not registered with the U.S. Securities and Exchange Commission (or with the securities regulatory authority or body of any state or any other jurisdiction) as an investment adviser, broker-dealer or in any other capacity, and does not purport to provide investment advice or make investment recommendations. This report has been generated through application of the analytical tools and data provided through ycharts.com and is intended solely to assist you or your investment or other adviser(s) in conducting investment research. You should not construe this report as an offer to buy or sell, as a solicitation of an offer to buy or sell, or as a recommendation to buy, sell, hold or trade, any security or other financial instrument. For further information regarding your use of this report, please go to: ycharts.com/about/disclosure
Next Article
October Job Cuts Hit 20-Year High: 153,000 Positions EliminatedRead More →