Canada’s Fastest-Growing ETFs: April 2025 Flow Leaders
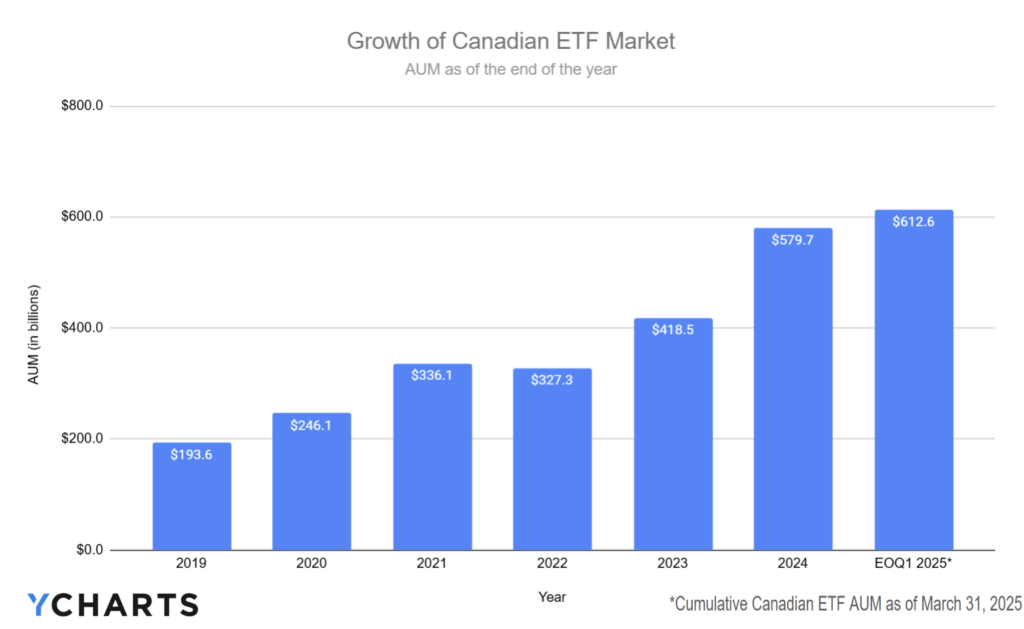
ETF adoption continues accelerating in Canada, fueled by growing demand from retail investors and advisors. As of the end of Q1 2025, total assets in Canadian-domiciled ETFs surged to $613 billion, more than tripling from under $200 billion in 2019.
Subscribe to the Fund Flow Report
This rapid growth reflects a broader shift toward transparent, tax-efficient, and typically lower-cost investment vehicles compared to mutual funds. As investors increasingly seek tailored exposures, ETF providers have responded by expanding their offerings across asset classes, sectors, and strategies.
This update highlights the ETFs and issuers that stood out in April 2025, across five key categories. These funds captured the strongest inflows during the month and are setting the pace for year-to-date asset growth.
For Canadian distribution teams looking to keep tabs on how both the mutual fund and ETF marketplaces are evolving in Canada, be sure to subscribe to our monthly fund flow report:
Short-Term Fixed Income ETFs Dominate Inflows
Advisors continued to lean into short-duration strategies in April 2025, with the Canadian Short-Term Fixed Income ETF category pulling in over $1.2B in net flows for the month. This activity reflects a meaningful slice of a growing market, with total assets in the peer group now exceeding $26B, underscoring a sizable TAM for providers.
Among individual funds, the BMO Short Corporate Bond Index ETF (ZCS.TO) led April inflows with $453M, followed by the BMO Ultra Short-Term Bond Fund (ZST.TO) at $208M. The iShares Core Canadian Short Term Bond Index ETF (XSB.TO) and the Vanguard Canadian Short-Term Bond Index ETF (VSB.TO) brought in $146M and $134M, respectively, while the TD Cash Management ETF (TCSH.TO) added $56M.
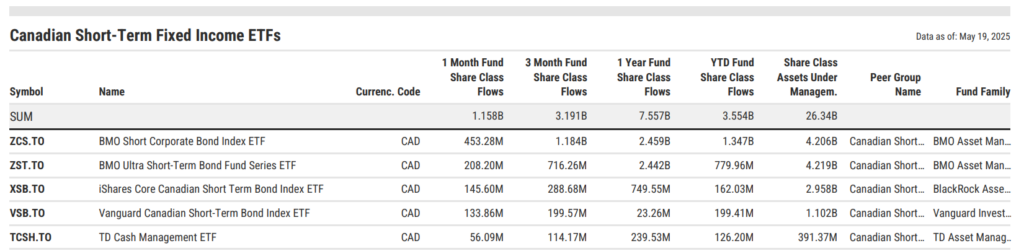
Year-to-date, ZCS.TO tops the category with $1.4B in flows, followed by ZST.TO with $780M, and VSB.TO and XSB.TO brought in $199M and $162M, respectively.
Momentum Builds in Canadian Global Fixed Income ETFs
With over $13.4B in total assets, the Canadian Global Fixed Income ETF peer group represents a growing TAM for firms looking to capture global diversification demand. The segment drew in $440M in April 2025, driven by rising interest in international and U.S. Treasury exposure.
The standout for the month was the Global X US 7-10 Year Treasury Bond Index ETF (HTB.TO), which hauled in $291M, accounting for more than 70% of category flows. The iShares Global Government Bond Index ETF (XGGB.NO) added $106M, and the BMO Long-Term US Treasury Bond Index ETF (ZTL.F.NO) followed with $61M.
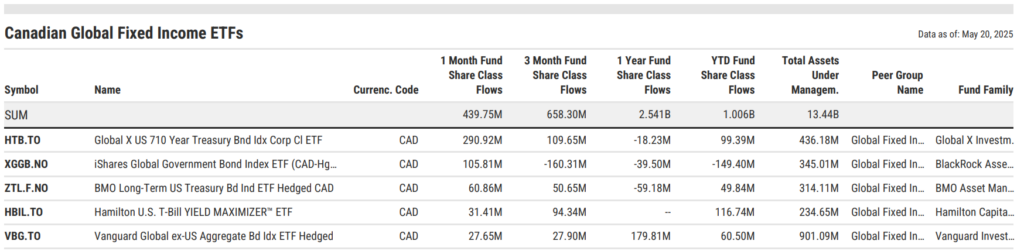
Year-to-date, the Vanguard US Aggregate Bond Index ETF Hedged (VBU.TO) leads the group with $170M in 2025 inflows. The RBC U.S. Discount Bond ETF (RUDB.TO) and the Hamilton U.S. T-Bill YIELD MAXIMIZER™ ETF (HBIL.TO) have also seen strong demand, reeling in $144M and $117M, respectively.
Capturing Flows in Canadian Fixed Income ETFs
Canadian Fixed Income ETFs continue to serve as foundational tools for managing interest rate and duration risk. The peer group has amassed $55B in total assets, making it one of the largest addressable markets within Canada’s ETF ecosystem.
In April 2025 alone, the group attracted nearly $589M in net new assets. The Brompton Wellington Square AAA CLO ETF (BAAA.TO) led the way, pulling in $628M in its first month. Other notable gatherers included the BMO Aggregate Bond Index ETF (ZAG.TO) with $135M, the BMO Core Plus Bond Fund ETF (ZCPB.TO) with $130M, and the Fidelity Systematic Canadian Bond Index ETF (FCCB.TO), which brought in $94M.
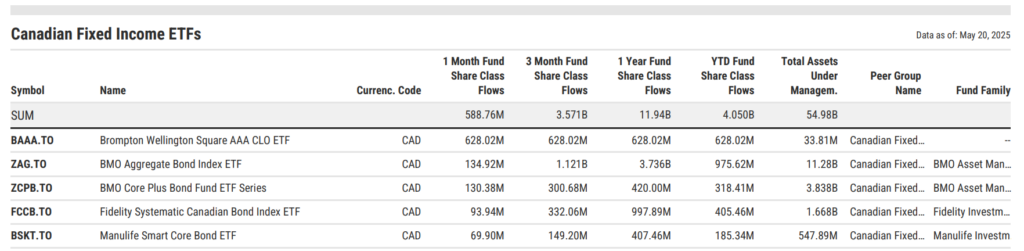
Year-to-date, ZAG.TO has led the way with $976M in flows, followed by BAAA.TO. The Scotia Canadian Bond Index Tracker ETF (SITB.NO) has attracted $515M, and FCCB.TO has reeled in $405M.
Canadian U.S. Equity ETFs: Where the Flows Are Going
Canadian-listed U.S. equity ETFs remain a cornerstone for advisors seeking broad market exposure, sector tilts, and strategic factor plays. As of May 2025, the category holds over $145B in assets, making it the largest equity peer group in the Canadian ETF market by TAM.
In April alone, the Canadian-denominated funds in the group pulled in $2.4B, with flows concentrated in the largest, lowest-cost names. The Vanguard S&P 500 Index ETF (VFV.TO) led the way with $665M, followed by the Vanguard US Total Market Index ETF (VUN.TO) with $332M, and the iShares Core S&P 500 Index ETF (XUS.TO) with $257M.
BMO’s S&P 500 Index ETF (ZSP.TO) and the Fidelity U.S. Value ETF (FCUV.TO) rounded out April’s top five, drawing $172M and $161M, respectively.
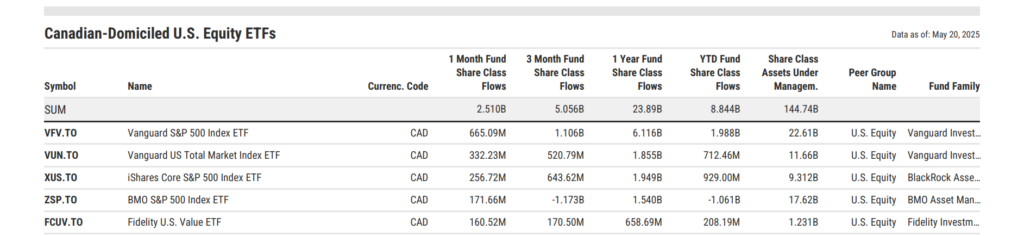
Year-to-date, VFV.TO remains the leader with nearly $2B in net inflows, while XUS.TO and VUN.TO follow with $929M and $712M, respectively.
The BMO S&P 500 Hedged to CAD Index ETF (ZUE.TO) and the Mackenzie US Large Cap Index ETF (QUU.TO) are also gaining traction, each pulling in over $400M YTD.
These trends confirm that Canadian advisors still favor U.S. exposure, particularly low-fee, index-based ETFs, amid ongoing market uncertainty and geopolitical tensions.
April’s Flow Leaders in Canadian International Equity ETFs
With total assets now surpassing $56.5B, Canadian International Equity ETFs continue to serve as a key building block for globally diversified portfolios. In April 2025 alone, the category brought in $2.2B, signaling strong appetite for developed market equity exposure beyond North America.
The month’s largest inflows went to the iShares Core MSCI EAFE IMI Index ETF (XEF.TO), which pulled in $461M, followed by the BMO MSCI EAFE Index ETF (ZEA.TO) with $326M, and the CIBC Qx International Low Volatility Dividend ETF (CQLI.NO) with $313M.
Rounding out the top five were the Vanguard FTSE Developed All Cap ex North America Index ETF (VIU.TO) and the Invesco S&P International Developed ESG Index ETF (IICE.TO), drawing $187M and $147M, respectively.
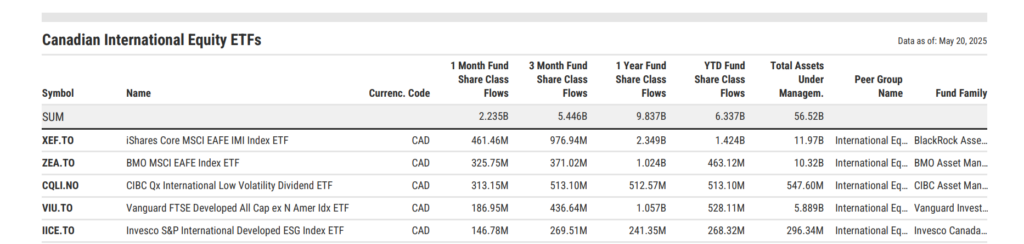
From a year-to-date perspective, XEF.TO leads with over $1.4B in new flows, while the TD International Equity Index ETF (TPE.TO) follows closely at $999M, and VIU.TO at $528M.
For Canadian distribution teams looking to keep tabs on how both the mutual fund and ETF marketplaces are evolving in Canada, be sure to subscribe to our monthly fund flow report:
The Most Popular Global Equity ETFs Among Canadian Advisors
Global equity exposure remains a powerful driver of ETF demand in Canada. As of May 2025, Canadian-listed Global Equity ETFs surpassed $45B in assets, cementing their role in advisors’ asset allocation strategies.
In April 2025, the category attracted $2.4B in net flows, led overwhelmingly by the BMO Global Equity Fund Active ETF Series (BGEQ.NO), which brought in $1.1B. This was followed by core building blocks like the iShares Core Equity ETF Portfolio (XEQT.TO) at $364M and the Vanguard All-Equity ETF Portfolio (VEQT.TO) at $303M. Also making the top five were the CI Munro Global Growth Equity ETF (CMGG.TO) with $130M and the Fidelity All-in-One Equity ETF (FEQT.NO) at $127M.
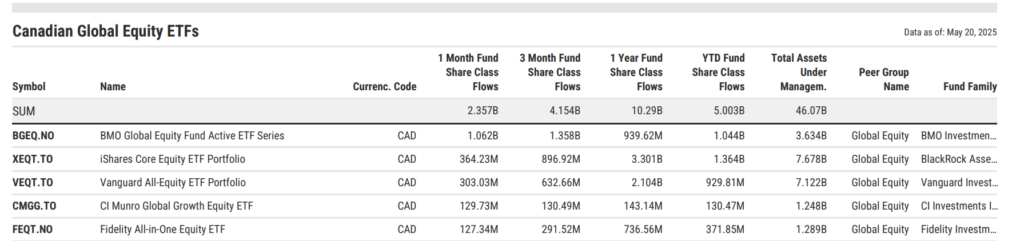
Year-to-date, XEQT.TO leads with $1.4B in inflows, edging out BGEQ.NO at $1B and VEQT.TO at $930M.
While core ETFs dominated the inflows, niche strategies like Fidelity Global Innovators (FINN.NO) and the TD Active Global Enhanced Dividend (TGED.TO) also saw strong YTD flows, suggesting growing advisor interest in innovation- and income-focused global exposures.
As market conditions evolve and the second half of 2025 unfolds, these trends offer key signals for asset managers, informing everything from product development to distribution priorities.
Want to keep a closer eye on capital movements? Subscribe to our Fund Flow Report to track inflows, monitor your TAM, and stay ahead of competitor trends in both Canada and the U.S.
And if you haven’t yet, book time with our asset management specialists to see why top firms choose YCharts to position strategies, lead engaging meetings, and win new business.
Whenever you’re ready, here’s how YCharts can help you:
1. Book time with our asset management specialists
2. Want to test out YCharts for free?
Start a no-risk 7-Day Free Trial.
3. Sign up for a copy of our Fund Flows Report and Visual Deck to stay on top of ETF trends:
Sign up to recieve a copy of our monthly Fund Flows Report:Disclaimer
©2025 YCharts, Inc. All Rights Reserved. YCharts, Inc. (“YCharts”) is not registered with the U.S. Securities and Exchange Commission (or with the securities regulatory authority or body of any state or any other jurisdiction) as an investment adviser, broker-dealer or in any other capacity, and does not purport to provide investment advice or make investment recommendations. This report has been generated through application of the analytical tools and data provided through ycharts.com and is intended solely to assist you or your investment or other adviser(s) in conducting investment research. You should not construe this report as an offer to buy or sell, as a solicitation of an offer to buy or sell, or as a recommendation to buy, sell, hold or trade, any security or other financial instrument. For further information regarding your use of this report, please go to: ycharts.com/about/disclosure.
Next Article
Top Dividend-Growth Stocks of the Last 3 Years: Income with MomentumRead More →