
Capital Gains Insights That Strengthen Advisor Partnerships
Free Live Workshop | Friday, October 30 | 11:30 AM CT
Turn Year-End Tax Planning Into Your Best Pitch
In 30 minutes, see how distribution teams use CapGainsValet data in YCharts Fund Screener and Comp Tables to find competing funds with the largest estimated year-end distributions, then position their funds as the tax-efficient answer before capital gains hit.
After a multi-year run of equity market gains, many mutual funds are carrying substantial embedded appreciation, and that sets up meaningful year-end capital gains distributions for advisors and their clients in 2026.
That is a significant opening for distribution teams with the right products, data, and talking points. Advisors don’t want to explain surprise tax bills to clients, and a wholesaler can show up with the solution.
With CapGainsValet in YCharts, distribution teams can pinpoint which funds will saddle advisors with heavy distributions and position their strategy as the tax-efficient alternative. Instead of waiting for advisors to ask the question, wholesalers can lead with the answer: “Here’s the tax bill coming from your current holdings, and here’s how my strategy avoids it.”
The CapGainsValet dataset breaks distributions down by source (income, short-term, or long-term capital gains) and quantifies them in dollars or as a percentage of net asset value (NAV).
Add Cap Gains Valet to your YCharts account to streamline tax-planning conversations and eliminate last-minute surprises.Where 2026 Capital Gains Risk Is Concentrated
An analysis of the full mutual fund universe using YCharts Fund Screener and CapGainsValet estimates as of October 2026 shows how the 2026 distribution landscape looks by peer group heading into year-end.
| Peer Group | Biggest Estimated Payer | Est. Total Distrib. | Peer Group Median |
|---|---|---|---|
| First Percentile (All Funds) | Columbia Seligman Technology & Info Fd C (SCICX) | 96.50% | 38.04% |
| Large Growth | Columbia Select Large Cap Growth Fund I (UMLGX) | 44.98% | 10.75% |
| Large Core | John Hancock Fundamental Large Cap Core Fund A (TAGRX) | 27.23% | 8.19% |
| Large Value | MFS Value Fund I (MEIIX) | 23.00% | 11.68% |
| Multi Growth | AB Concentrated Growth Fund Advisor (WPSGX) | 32.11% | 12.14% |
| Multi Core | Glenmede Strategic Equity Portfolio (GTCEX) | 47.72% | 9.35% |
| Multi Value | Glenmede Energy Resilience Portfolio (RESGX) | 31.00% | 12.36% |
| Equity Income | Russell Investments Equity Income Fund S (RLISX) | 19.63% | 10.22% |
| Mid Growth | Virtus KAR Mid-Cap Growth Fund I (PICMX) | 37.77% | 10.00% |
| Mid Core | Principal MidCap Value Fund I R-6 (PCMSX) | 25.08% | 11.00% |
| Mid Value | Victory RS Investors Fund Y (RSIYX) | 15.31% | 10.66% |
| Small Growth | Thrivent Small Cap Growth Fund S (TSCGX) | 31.88% | 16.67% |
| Small Core | Nationwide Renaissance Small Cap Growth Fund IS (NWGSX) | 55.43% | 13.07% |
| Small Value | Allspring Special Small Cap Value Fund I (ESPNX) | 25.79% | 16.22% |
| International Large-Cap Core | Ariel International Fund Institutional (AINIX) | 18.19% | 9.41% |
| International Large-Cap Growth | BNY Mellon International Stock Fund I (DISRX) | 20.00% | 8.20% |
Estimated distributions shown as a percentage of net asset value (NAV). Data source: YCharts, CapGainsValet, as of October 2026. Estimates are preliminary and subject to change.
Four standouts worth flagging for advisor conversations:
- Small caps run hot across the board. Small Growth has the highest median of any peer group at 16.67%, and Small Value is close behind at 16.22%. Elevated distributions there are category-wide, not limited to outliers.
- Small Core has the largest peer-group top payer. Nationwide Renaissance Small Cap Growth Fund IS (NWGSX) projects a 55.43% distribution, the highest top estimate of the 15 peer groups.
- Multi Core shows the widest spread. Glenmede Strategic Equity Portfolio (GTCEX) projects 47.72% against a 9.35% category median, more than five times the median and the widest ratio of any peer group. Managers in the same style box can behave very differently.
- Large Value outpaces Large Growth. The Large Value median of 11.68% sits above both Large Growth (10.75%) and Large Core (8.19%).
Strategies for Replacing High-Cost Funds in an Advisor’s Portfolio
YCharts serves distribution teams as a point-of-sale tool, and the CapGainsValet dataset extends that use.
Whether a wholesaler offers a capital gains consultation early in the engagement or has been asked to analyze an advisor’s portfolios, YCharts’ Quick Extract tool removes one of the most time-consuming tasks in asset management: importing portfolio data before analyzing it for opportunities.
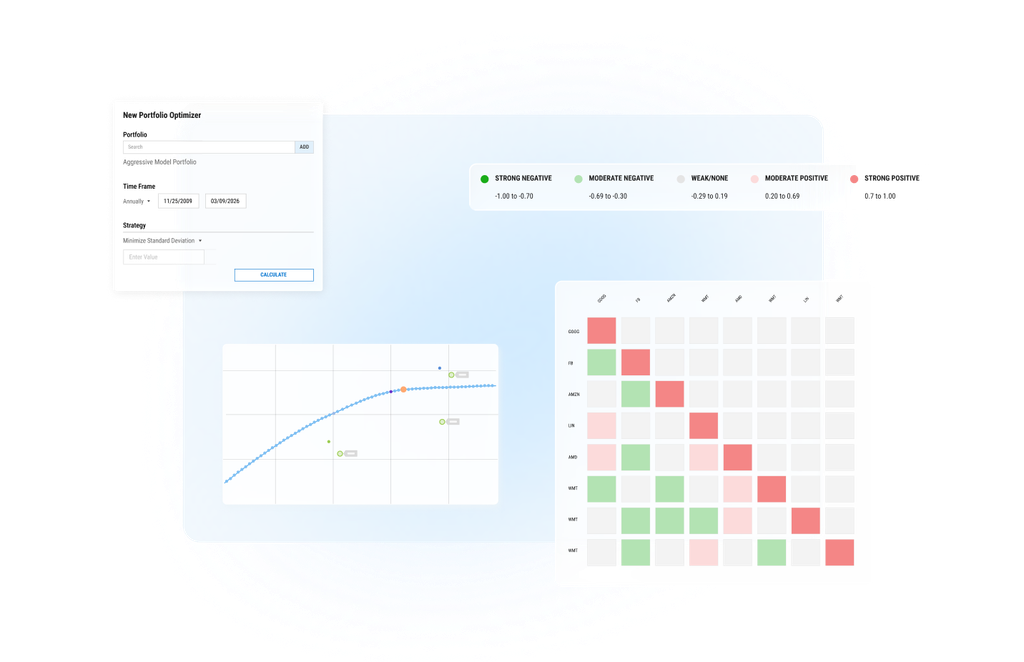
Whether the advisor’s portfolio comes in through Quick Extract or a manual holdings upload, the Holdings Cap Gains quickflow on the portfolio page pinpoints which funds are likely to distribute substantial capital gains, so positioning against those strategies can begin.
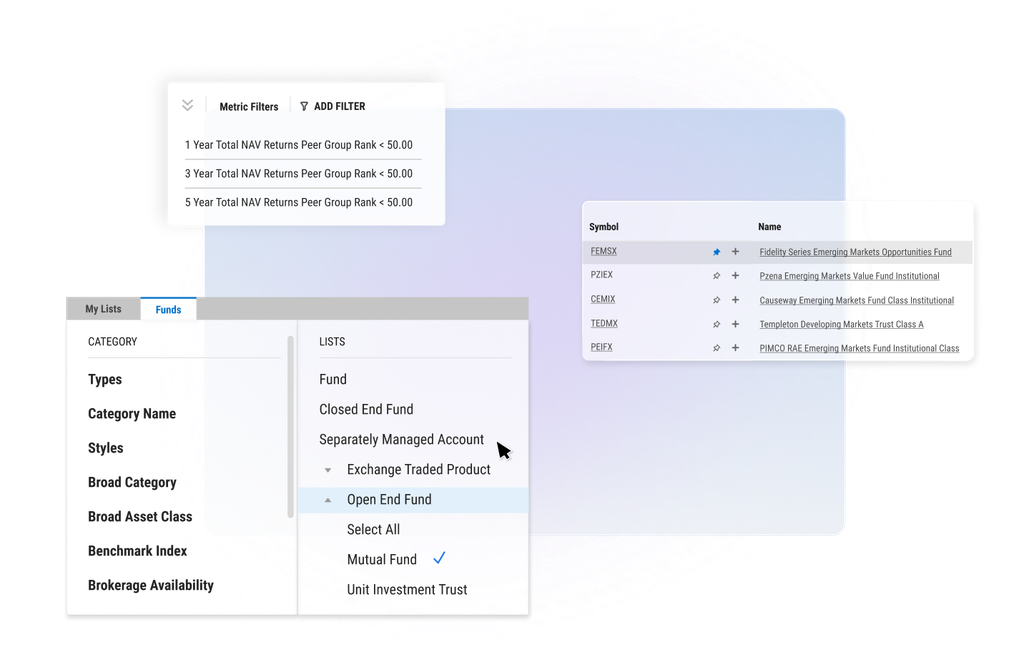
The next step is duplicating the advisor’s portfolio and substituting your strategy for the competitor fund being targeted. From there, Fundamental Charts, Holdings Overlap, and Scatter Plots in YCharts illustrate the strategy’s relative strengths on performance, risk, diversification, and tax efficiency.
The ETF Share Class Opportunity
This workflow is particularly powerful for ETF issuers. In November 2025, the U.S. Securities and Exchange Commission (SEC) granted Dimensional Fund Advisors exemptive relief to add exchange-traded fund (ETF) share classes to existing mutual funds, and it has since extended relief to dozens of managers. Dimensional launched the first actively managed ETF share class in March 2026.
Under this framework, investors can move from a mutual fund class into the ETF class without triggering a taxable event. That makes this capital gains season an even greater opportunity to educate advisors on the structural tax advantages ETFs carry relative to mutual funds.
Mutual funds and ETFs both pass net realized capital gains through to shareholders each year. The difference is how much each one realizes. ETFs typically rely on in-kind creation and redemption with market makers, so shareholder trading has little direct effect on realized gains. Mutual funds may need to sell securities to meet redemptions, creating taxable events for all shareholders.
Adding fund flow and performance metrics to a CapGainsValet screen surfaces competitors facing the “double” or even “triple whammy” of redemptions, poor performance, and capital gains payouts, so a strategy can be positioned as the cleaner, more tax-efficient alternative.
Aligning Sales Teams on the Opportunity
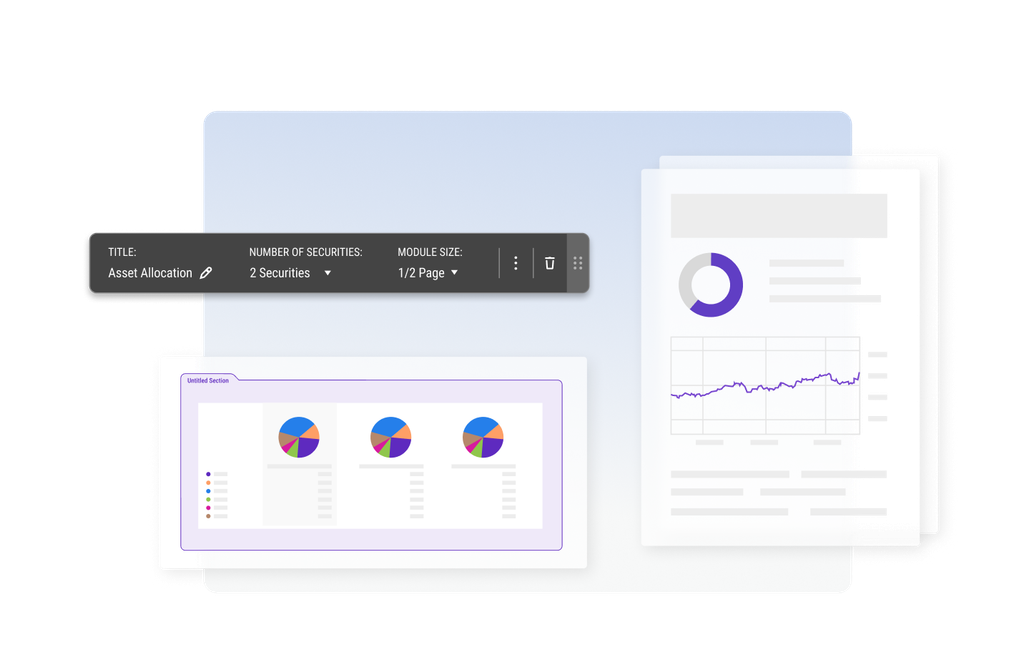
After building a capital gains analysis or visual, shareable YCharts dashboards align the distribution team on the sales story and keep everyone working from the same data.
The 2026 Capital Gains Watchlist Dashboard built for this analysis includes 16 modules, the first percentile plus 15 peer groups, each ranking funds by estimated total distribution with the long-term, short-term, and income breakdown. Regional directors and wholesalers can log in and immediately see which competitors are most exposed this season.
Dashboards can be shared after team or home-office meetings and can include notes on high-tax-cost funds, targeted firms, or links to internal resources detailing which products are available at a given firm. That keeps everyone in the field aligned on the strategy’s story and how to implement it.
Directors and managers can quickly identify which competitor funds are likely to trigger uncomfortable conversations with advisors, and whether their strategy offers a lower-cost, better-performing, or more tax-efficient alternative.
By using CapGainsValet in YCharts proactively, distribution teams can address potential capital gains tax liabilities before they become a client relations problem and position their offerings to attract or retain assets under management (AUM) as year-end approaches.
Frequently Asked Questions
Which mutual fund peer groups have the highest estimated 2026 capital gains distributions?
As of October 2026, Small Growth has the highest median estimated total distribution at 16.67% of NAV, followed by Small Value at 16.22%, based on CapGainsValet data in YCharts.
How can asset managers use capital gains estimates in advisor conversations?
Distribution teams can use CapGainsValet in YCharts to identify which competitor funds in an advisor’s portfolio are likely to make large year-end distributions, then use point-of-sale tools such as Holdings Overlap, Fundamental Charts, and Scatter Plots to position a more tax-efficient alternative.
Why do ETFs typically distribute fewer capital gains than mutual funds?
ETFs typically use in-kind creation and redemption with market makers, so shareholder trading has little direct effect on realized gains. Mutual funds may need to sell securities to meet redemptions, which can realize gains that are passed on to all shareholders.
Ready to Move On From Your Investment Research and Analytics Platform?
Add Cap Gains Valet to your YCharts account to streamline tax-planning conversations and eliminate last-minute surprises.Follow YCharts Social Media to Unlock More Content!
Next Article
2026 Capital Gains Watchlist: Biggest Payers by Peer GroupRead More →