Why the Dot-Com Comparison Falls Short in 2025

Executive Summary: AI-driven market leadership has raised fresh bubble concerns, but a closer look shows that today’s environment differs meaningfully from the late 1990s. This article breaks down why the dot-com comparison falls short, how history can frame current fears, and what advisors can use to help clients stay focused on long-term realities rather than headline anxiety.
Interested in testing out YCharts for free?
Start 7-Day Free TrialTable of Contents
AI Leadership and Market Anxiety
2025 has been defined by an increasingly concentrated market led by a handful of mega-cap names. The top ten holdings in the S&P 500 now comprise roughly 39 percent of the entire index, a level of concentration that raises questions about the index’s durability and risk.
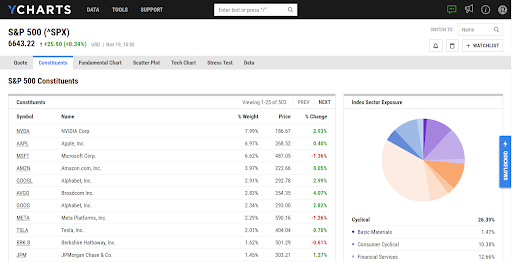
A key driver of this concentration has been the rapid expansion of artificial intelligence. The largest companies in tech and cloud computing continue to scale their AI capabilities, building more data centers and securing the hardware needed for the next generation of models.
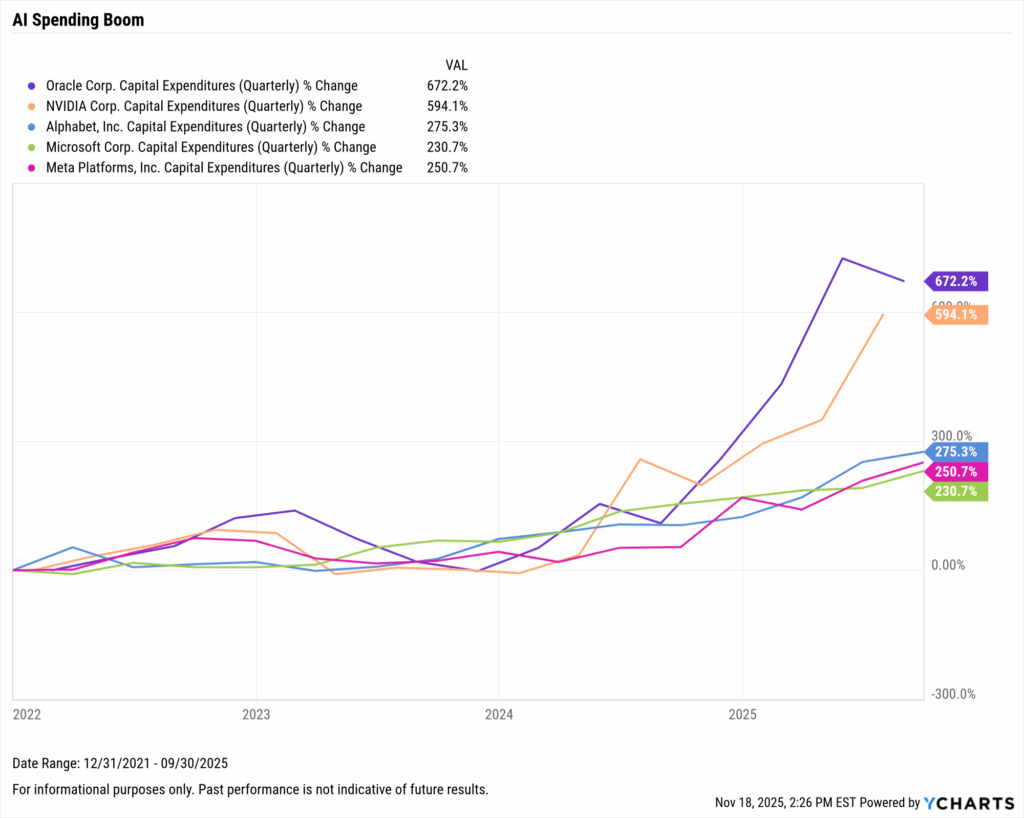
Explore in YCharts → AI leaders capital expenditures soar
With AI investment accelerating and leadership narrowing, investors are asking whether this reflects a lasting productivity shift or the early stages of another tech bubble.
The comparison that is most often made is to the late 1990s.
On the surface, both periods feature a breakthrough innovation, concentrated leadership, and rising expectations. However, headline similarities can overlook the structural differences that drive today’s cycle.
To understand today’s environment, it’s worth revisiting what actually defined the dot-com era and how this cycle differs from it.
The Dot-Com Blueprint
The dot-com era provides context, but it doesn’t mirror today’s market. The late 1990s were marked by enthusiasm that pushed prices far ahead of reason, a setup that helps clarify how different today’s environment is beneath the surface.
In the 17 months leading up to March 2000, the Nasdaq climbed more than 230% as investors flooded into anything with an internet story. Prices went vertical while earnings and cash flow barely moved.
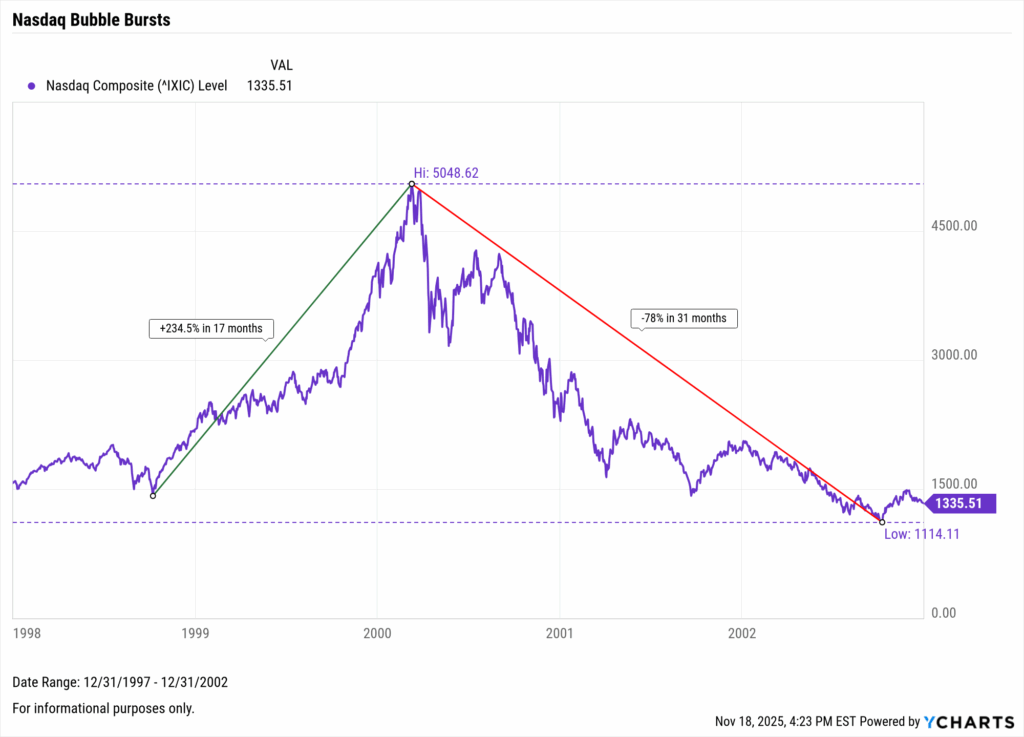
Explore in YCharts → The bubble eventually bursts
A parabolic climb that disconnected from financial reality:
- Prices accelerated far faster than underlying conditions
- Profit expectations rose without matching earnings
- Capital concentrated in unprofitable, speculative tech names
Consider Pets.com, which raised $82.5 million in its IPO yet declared bankruptcy just nine months later due to a lack of revenue. Or eToyz, which racked up $247 million in debt and fell from $86 to 9 cents per share, before filing for bankruptcy in 2001.
Today’s environment looks very different. Corporate earnings continue to rise, and forward expectations are increasing. This cycle is supported by real profitability, not speculation.
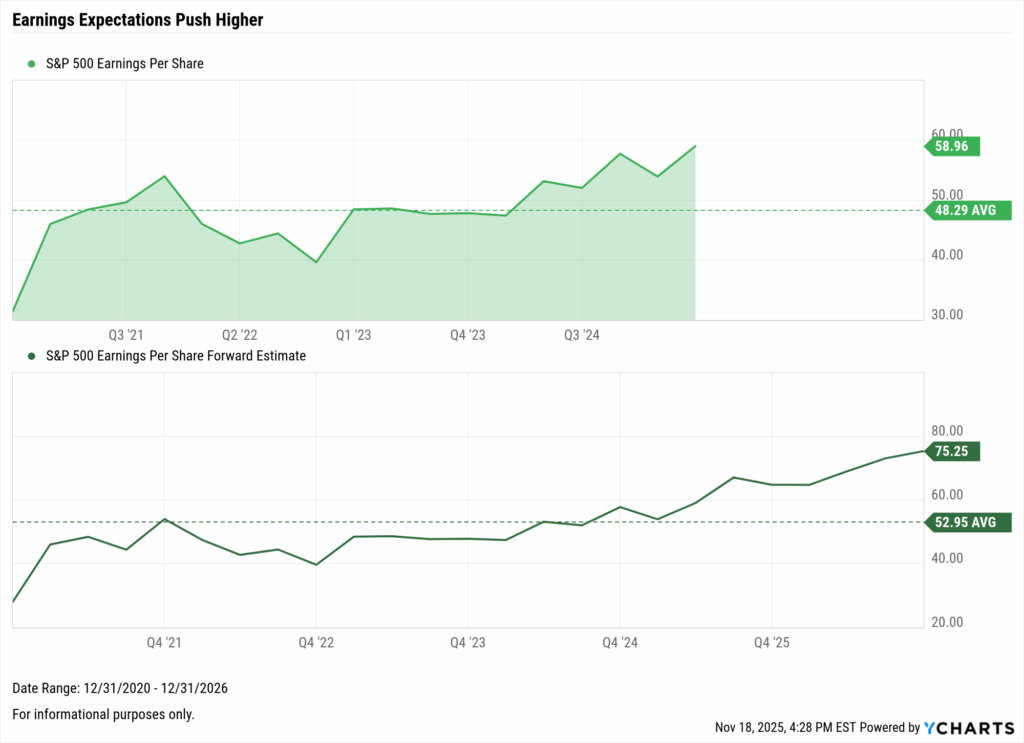
Explore in YCharts → Earnings expectations support rapid growth
This doesn’t eliminate uncertainty or guarantee a smooth path forward, but it does show that the current landscape is more than just euphoria.
Before calling something a bubble, it’s worth asking whether prices are outrunning earnings. Right now, the evidence points in the opposite direction.
There Is Always a Reason to Sell
Even in strong markets, investor sentiment rarely feels stable in real time. Every year brings new headlines that prompt investors to question their positioning, even when the data tells a different story.
Over the last several decades, investors have navigated recessions, political disruptions, debt crises, inflation spikes, pandemics, and more. Despite the frequency and severity of these events, markets have recovered 100 percent of the time.
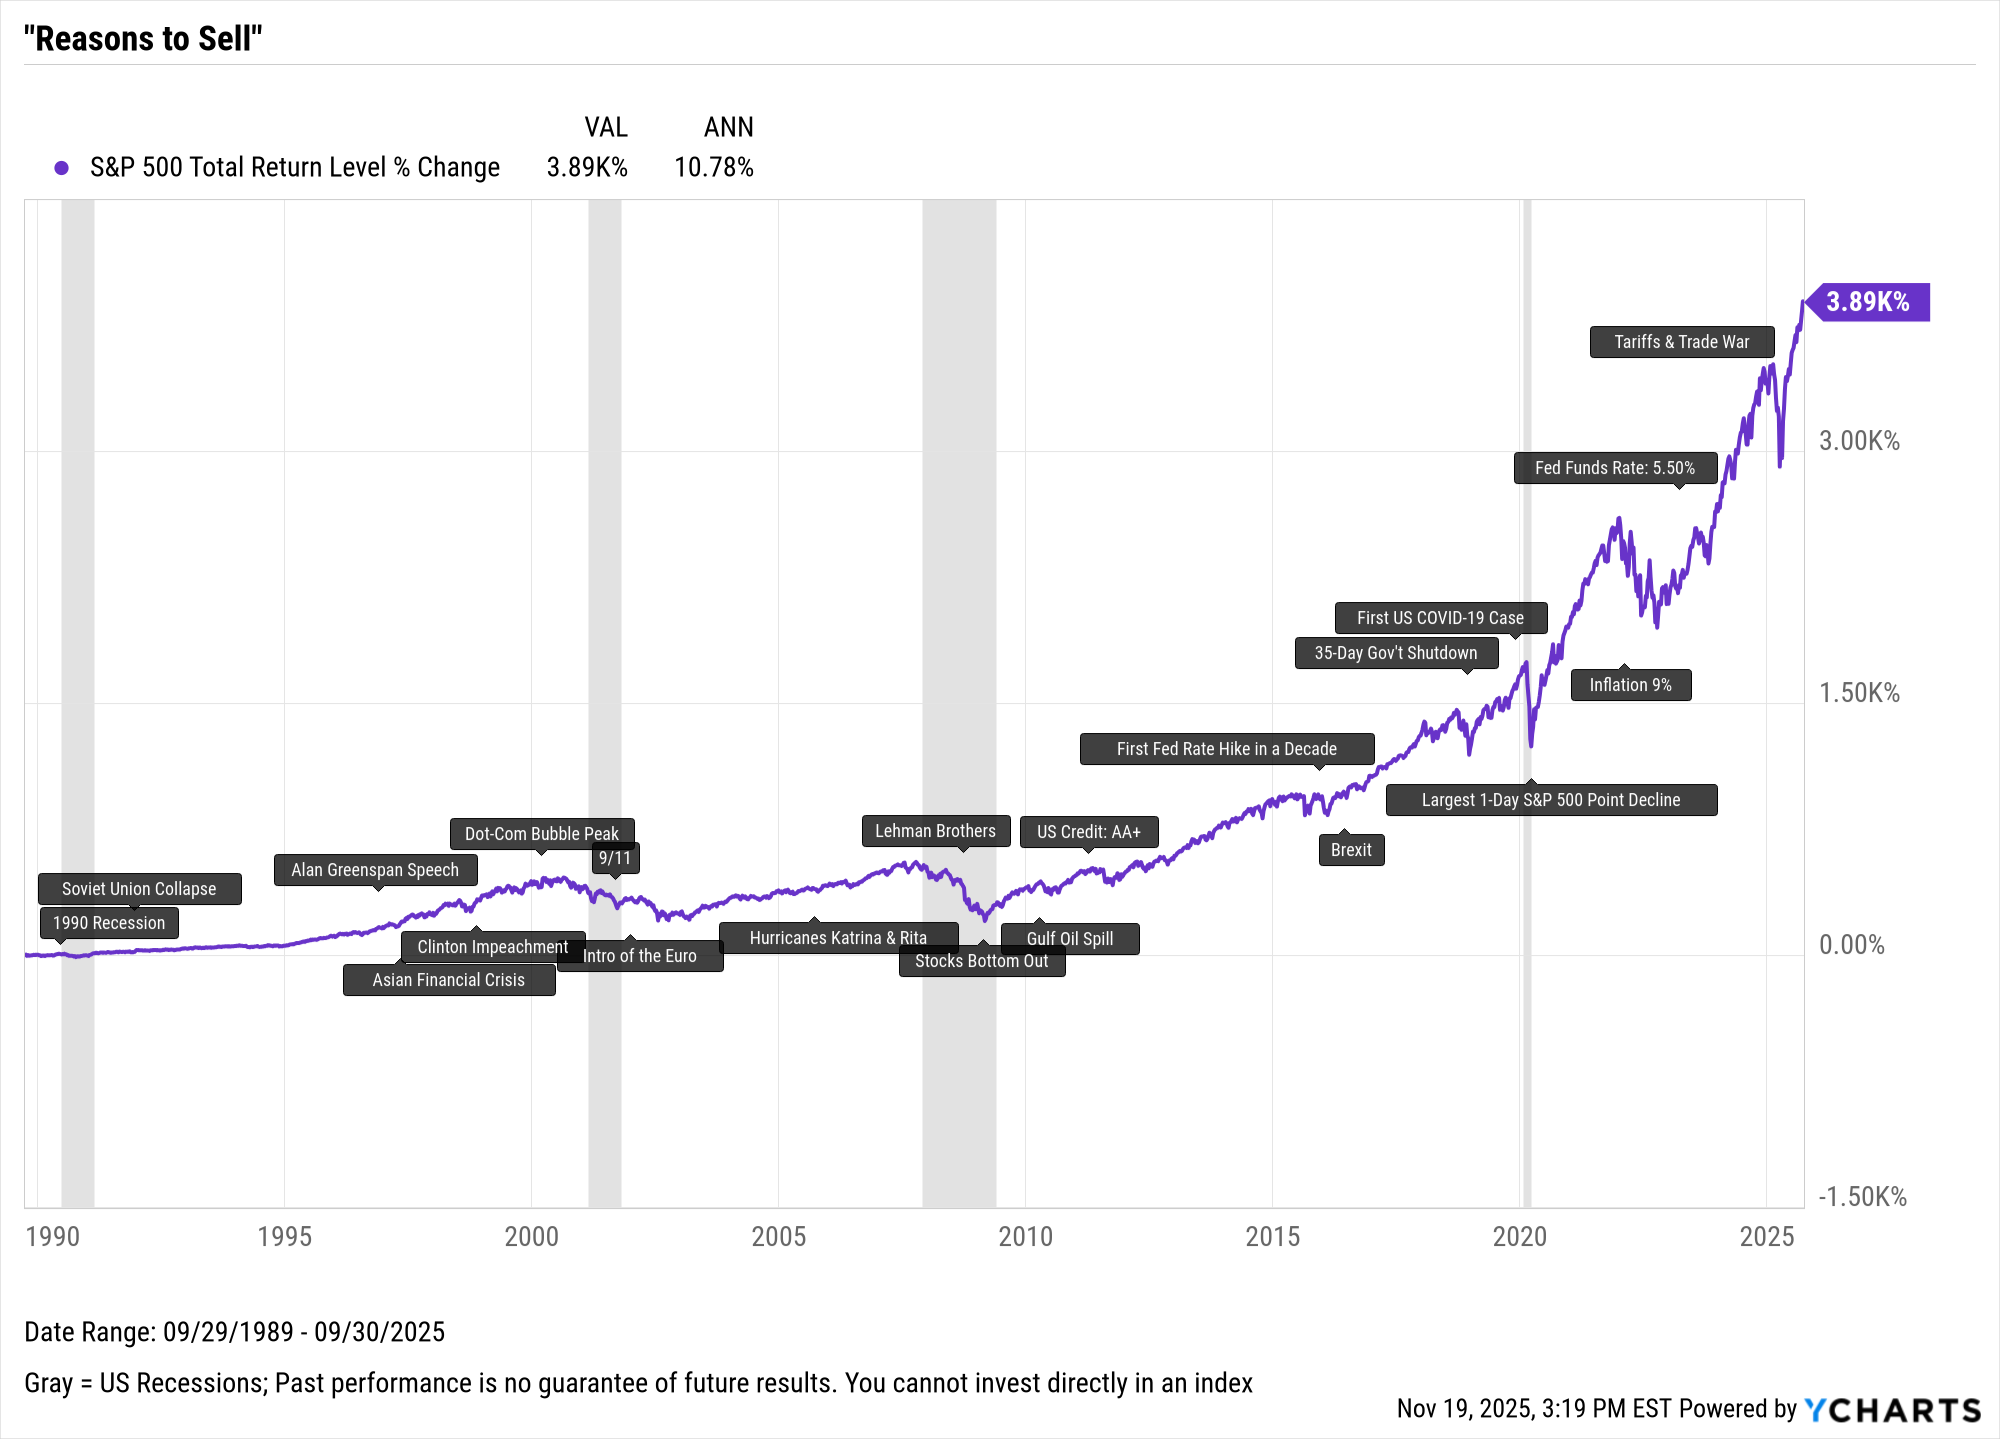
Explore in YCharts → How many of these events did you sell?
Headlines and shocks regularly prompt calls to de-risk portfolios, yet the market’s long-term trajectory has continued upward through each episode.
Risks tied to AI-driven speculation, high index concentration, or broader macro uncertainty may feel uneasy in the moment, but long-term outcomes have favored staying invested through uncertainty, rather than reacting to it.
Today’s Fundamental Differences
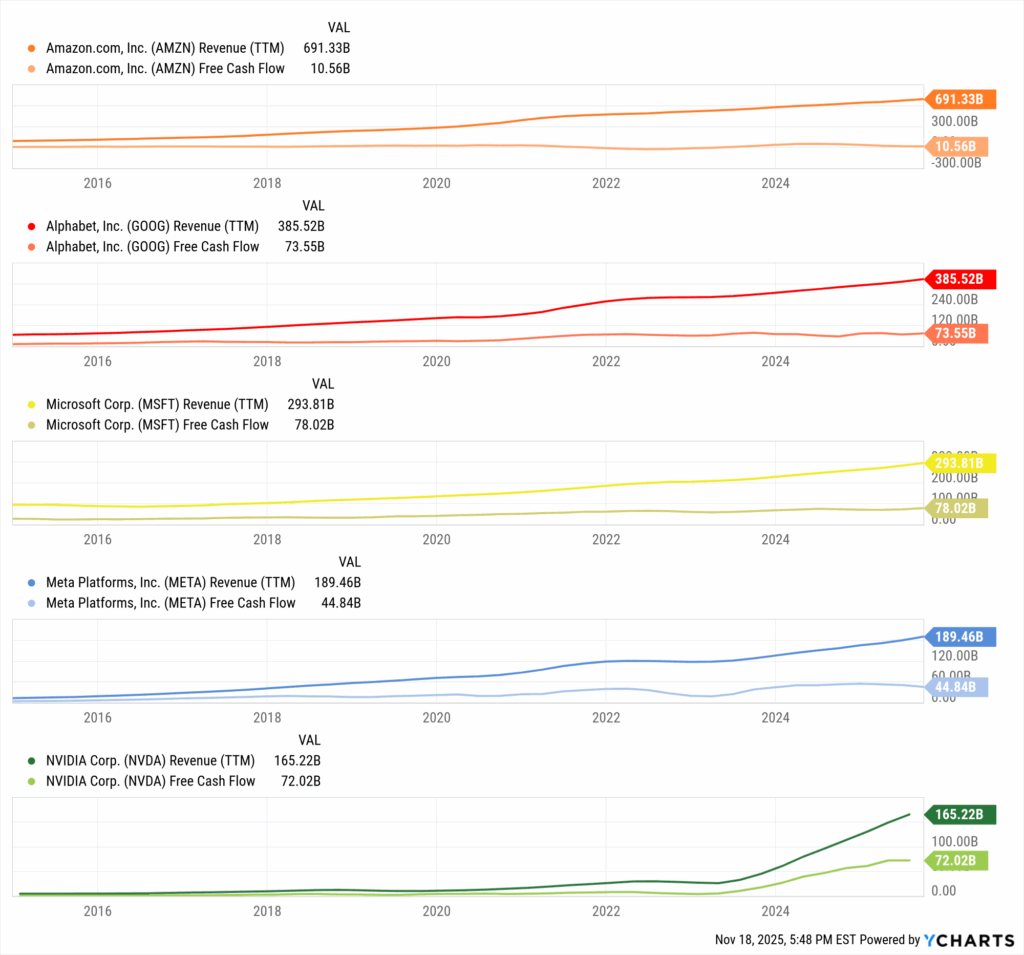
Today’s AI leaders aren’t early-stage businesses built on speculative revenue models. They are the largest and most profitable companies in the world, deploying record levels of revenue and free cash flow into AI infrastructure.
- Scale: Expanding revenue bases provide the stability needed for long-term AI investment.
- Profitability: Robust free cash flow enables self-funded AI development, unlike the dot-com era.
Federal Reserve Chairman Jerome Powell commented on this at the latest FOMC meeting, stating that this cycle, “is different in the sense that these companies, the companies that are so highly valued, actually have earnings and stuff like that”.
Explore in YCharts → Technological advancement backed by real profits
The companies committing billions of dollars to AI are doing so because they see durable demand from enterprises, developers, and cloud customers.
- “More than any transformation before it, this generation of AI is radically changing every layer of the tech stack.” (Satya Nadella, Microsoft CEO)
- “We’re also going to invest hundreds of billions of dollars into compute to build superintelligence. We have the capital from our business to do this.” (Mark Zuckerberg, Meta CEO)
- “This is that industry we were talking about. This is the Industrial Revolution” (Jensen Huang, Nvidia CEO)
Their public comments consistently frame AI not as a short-lived trend, but as a defining technological shift for the next decade and beyond.
Navigating the Narrative
Bubble concerns tend to surface quickly, especially when innovation outpaces investor comfort. Even in the most challenging periods, markets have recovered, and the conditions that shaped those downturns do not match the environment we see today.
Diversification plays an essential role in guiding clients through uncertainty. When equities experienced sharp drawdowns in 2025, bonds provided meaningful protection.
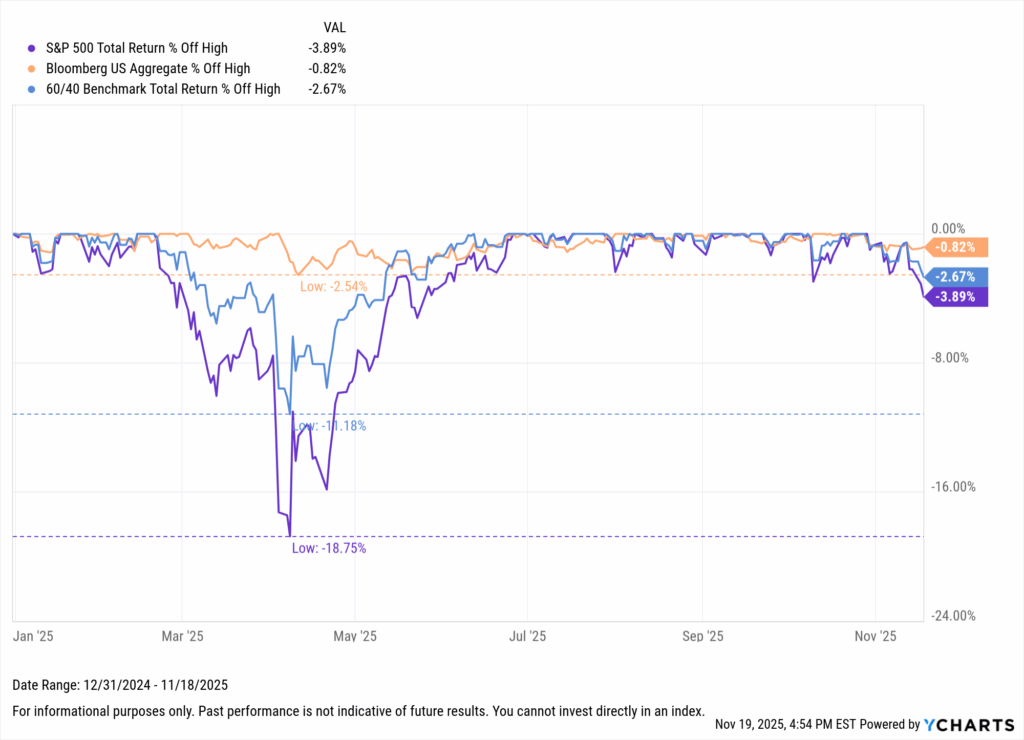
Explore in YCharts → Protecting clients during drawdowns
Advisors can also highlight the benefits of global diversification, particularly in a year where international markets have shown renewed strength.
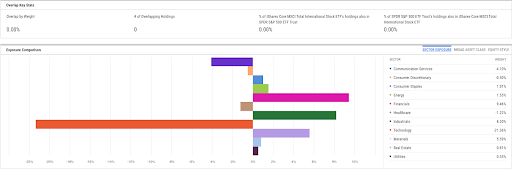
Emerging economies and developed markets outside the U.S. have both outpaced domestic equities, helping address concerns about reliance on a handful of mega-cap names.
Helping investors understand this reduces uncertainty and keeps decisions aligned with long-term objectives.
In a year defined by rapid innovation and constant debate, the ability to translate complex narratives into steady, informed guidance remains one of the most valuable services an advisor can provide.
Build these visuals in your own client reports → start a free trial today.
Ready to Move On From Your Investment Research and Analytics Platform?
Follow YCharts Social Media to Unlock More Content!
Disclaimer
©2025 YCharts, Inc. All Rights Reserved. YCharts, Inc. (“YCharts”) is not registered with the U.S. Securities and Exchange Commission (or with the securities regulatory authority or body of any state or any other jurisdiction) as an investment adviser, broker-dealer or in any other capacity, and does not purport to provide investment advice or make investment recommendations. This report has been generated through application of the analytical tools and data provided through ycharts.com and is intended solely to assist you or your investment or other adviser(s) in conducting investment research. You should not construe this report as an offer to buy or sell, as a solicitation of an offer to buy or sell, or as a recommendation to buy, sell, hold or trade, any security or other financial instrument. For further information regarding your use of this report, please go to: ycharts.com/about/disclosure.
Next Article
2025 Capital Gains Watchlist: The Biggest Estimated Distributions by Peer GroupRead More →