Economic Update — Reviewing Q1 2023
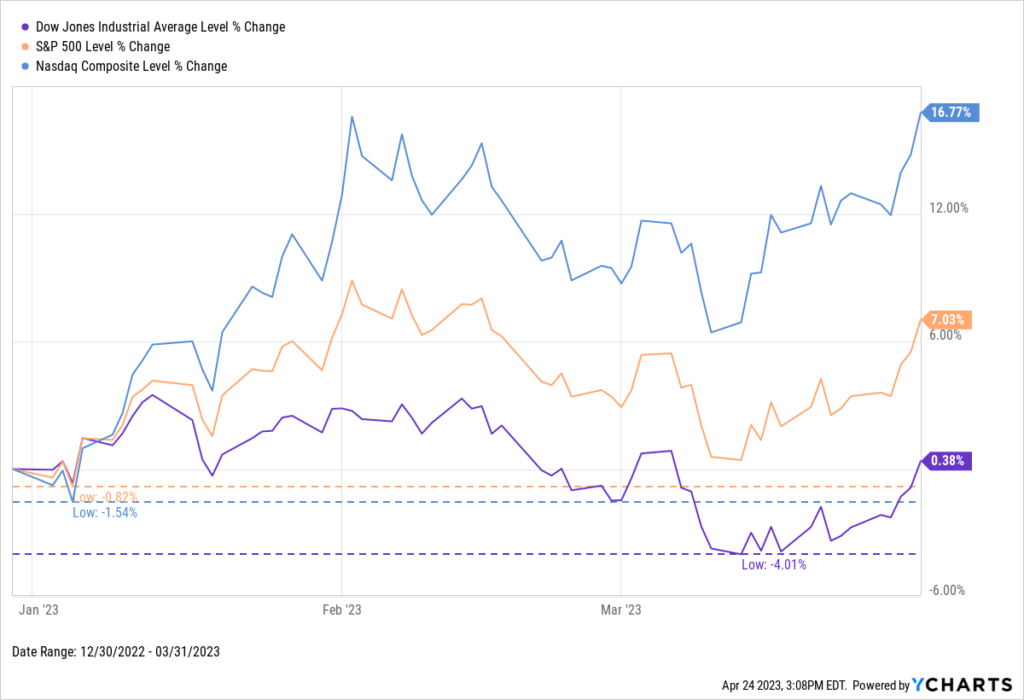
Q1 of 2023 is officially wrapped, and it was a positive one for US stocks. The NASDAQ led the way, rising 16.77% YTD, while the S&P 500 advanced 7.03%. The Dow Jones posted a more modest gain of 0.38% over the quarter.
Q1 marked a remarkable recovery for the growth-heavy NASDAQ, which finished 2022 down 33.1%. The Dow and the S&P both rebounded to a lesser degree, bouncing back from 2022’s -8.8% and -19.4% returns, respectively.
Download Visual | Modify in YCharts
Below is a sneak peek of insights from the YCharts Q1 2023 Economic Summary Deck. The deck, published quarterly, arms advisors and investors with key insights from the previous quarter to help you make smarter investment decisions going forward. Visuals can also be copied from the deck for your preferred use.
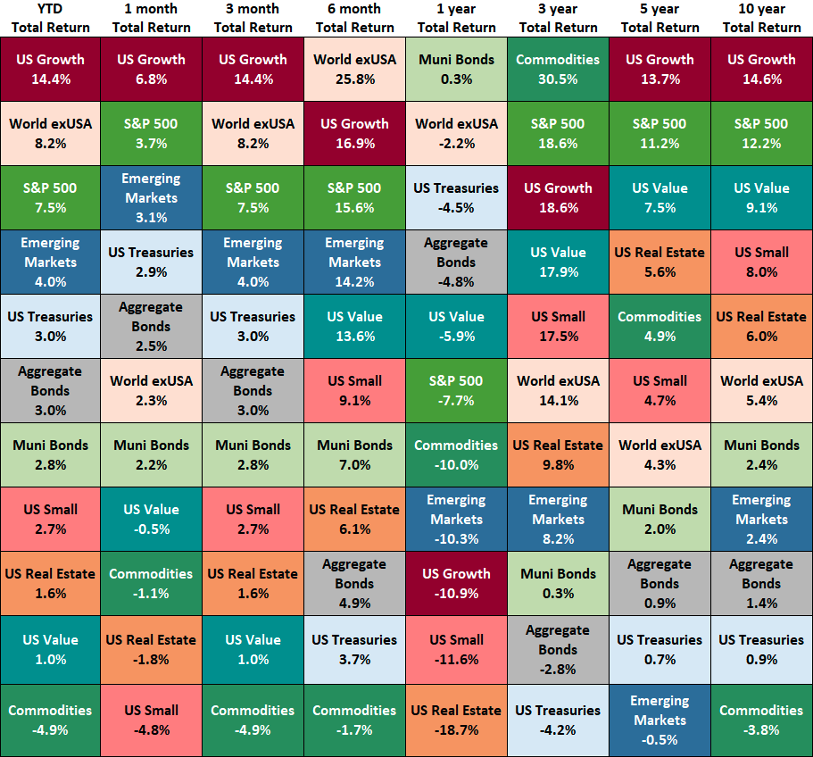
Asset Class Performance
The table below shows the performance of asset classes over increasingly longer lookback periods.
Click to Download The Economic Summary Deck
All but one asset class was positive in Q1 of 2023. US Growth outpaced all asset classes with a 14.4% return, followed by World ex-USA’s 8.2% return and the S&P 500’s 7.5% return. Commodities was the only laggard, posting a -4.9% return.
Major Technology companies helped lift the S&P 500 and Russell 1000 Growth. For example, Apple (AAPL), Microsoft (MSFT), Amazon (AMZN), NVIDIA (NVDA), and Alphabet (GOOGL) are the top 5 holdings in the S&P 500. Specifically, NVDA had a meteoric rise to start the year, gaining 90% in q1. Not to mention all of those other companies also had double-digit gains in Q1.
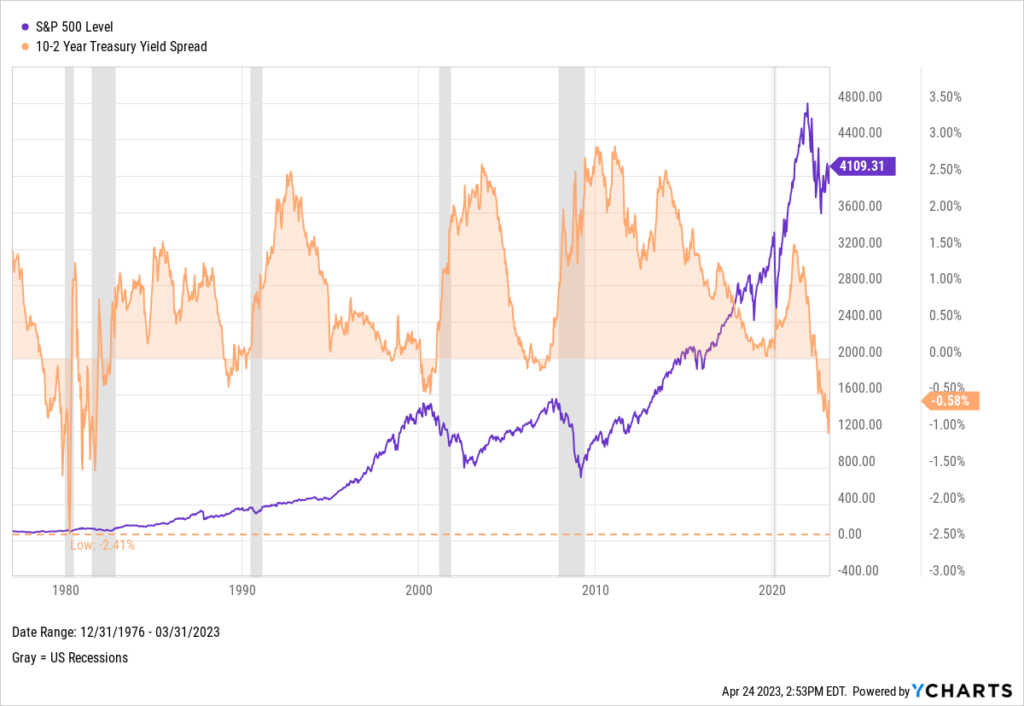
10-2 Treasury Yield Spread Hits Record Low: Is the Economy in Trouble?
The 10-2 Treasury Yield Spread, which measures the difference between the yields on 10-year and 2-year Treasury bonds, has been inverted since July 2022. An inverted yield curve can create significant challenges for banks and other financial institutions, leading to a credit crunch and decreased consumer spending, which can further weaken the economy.
With the exception of the brief recession in 2020, historically, a negative 10-2 Spread has been a leading indicator of a recession. With the 10-2 Spread hitting its lowest point in over four decades in March 2023, investors and economists are left wondering: could a recession be on the horizon, or will the economy prove resilient?
Click to Download The Economic Summary Deck
YCharts users—download the full deck in the Support Center. Not a current client? Reach out to get access, or enter your email below to receive a free version of the deck:
Get the Economic Update slide deck sent straight to your inbox:Connect with YCharts
To get in touch, contact YCharts via email at hello@ycharts.com or by phone at (866) 965-7552
Interested in adding YCharts to your technology stack? Sign up for a 7-Day Free Trial.
Disclaimer
©2023 YCharts, Inc. All Rights Reserved. YCharts, Inc. (“YCharts”) is not registered with the U.S. Securities and Exchange Commission (or with the securities regulatory authority or body of any state or any other jurisdiction) as an investment adviser, broker-dealer or in any other capacity, and does not purport to provide investment advice or make investment recommendations. This report has been generated through application of the analytical tools and data provided through ycharts.com and is intended solely to assist you or your investment or other adviser(s) in conducting investment research. You should not construe this report as an offer to buy or sell, as a solicitation of an offer to buy or sell, or as a recommendation to buy, sell, hold or trade, any security or other financial instrument. For further information regarding your use of this report, please go to: ycharts.com/about/disclosure
Next Article
Revolutionizing Client Relationships: A Guide to Using ChatGPT and YCharts for Financial AdvisorsRead More →