Economic Update: Reviewing Q1 2024
Below is a sneak peek of insights from the YCharts Q1 2024 Economic Summary Deck. This quarter, bullish sentiment pushed equities higher, while crude oil prices continued steadily climbing and fixed income asset classes declined slightly.
Download the Economic Summary Deck:YCharts recently took a deep dive into the latest Economic Summary Deck. Gain insights from Q1’s biggest market and economic storylines by watching the replay below:
Market and Asset Class Update
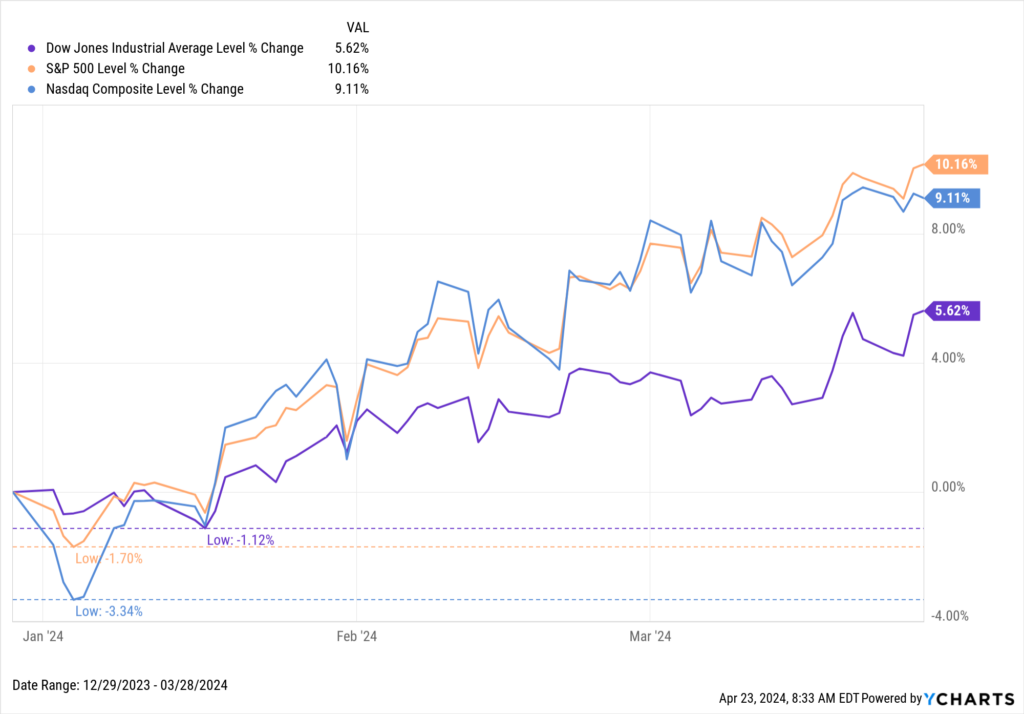
All three major indices ascended in Q1 2024, continuing 2023’s bullish market trends. The S&P 500 took the lead from the NASDAQ, rising 10.2% in Q1. The NASDAQ, for its part, advanced 9.1%, and the Dow Jones rose 5.6%.
Download Visual | Modify in YCharts
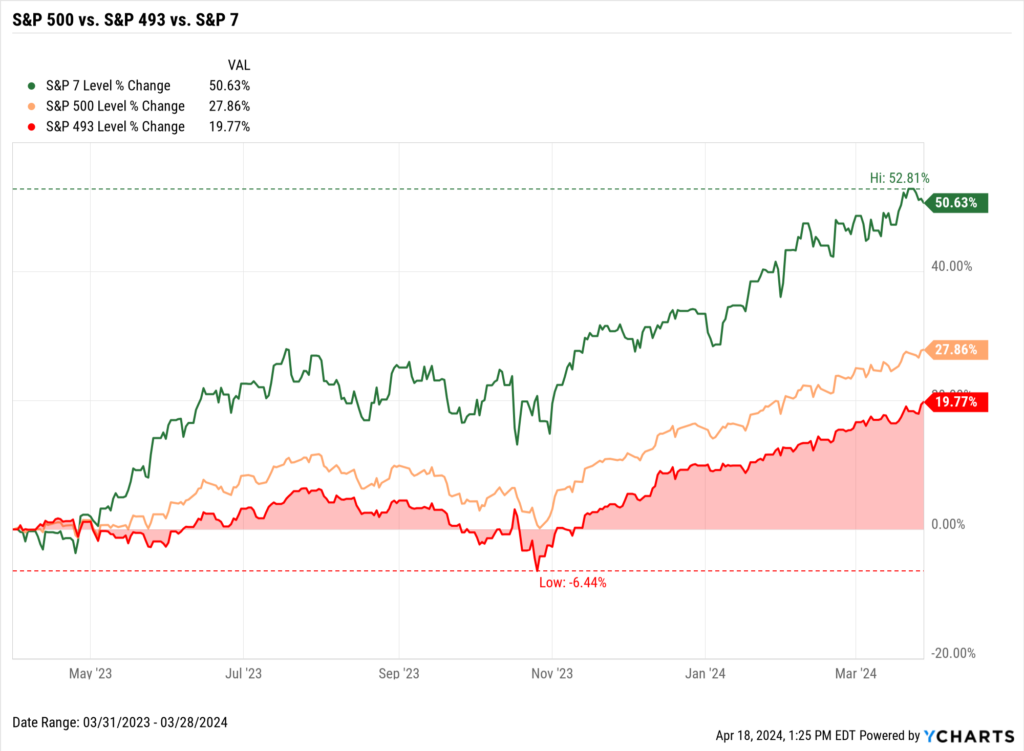
All three major US indices have produced positive double-digit returns over the last year (3/31/2023 – 3/31/2024). The NASDAQ surged 34%, the S&P increased 27.9%, and the Dow Jones climbed 19.6%. Yet, the S&P’s strong advance in Q1 was not exclusive to the “Magnificent Seven” or “S&P 7” stocks, suggesting a broadening of market leadership.
Download Visual | Modify in YCharts | Get in Touch to Access Chart
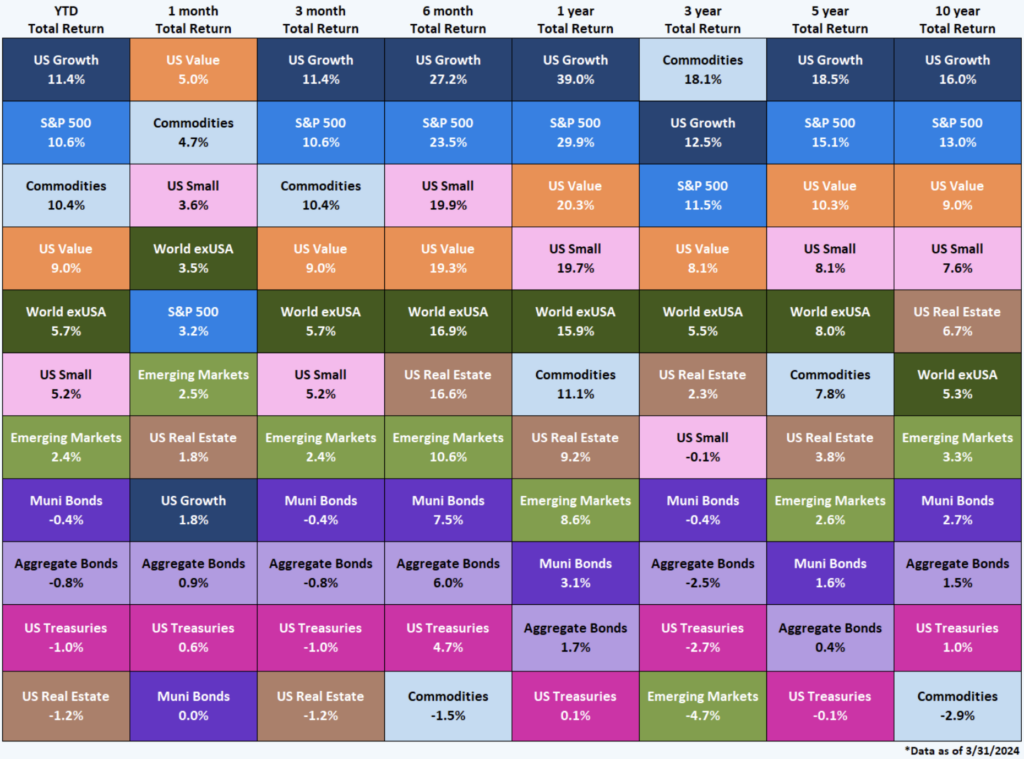
As for total returns across asset classes, US Growth was the leader in Q1, with an 11.4% gain. The S&P 500 was right behind, with the broader collection of US equities advancing 10.6%. Commodities followed both groups of equities and were up 10.4% in the quarter.
Download Visual | Contact Us to Access This Quilt
Keeping an Eye on Oil Prices
One of the commodities seeing a price surge is oil. Both Crude and US Retail Gas Prices are above their long-term averages. And though energy prices are not as big of a factor in core-inflation gauges, like core-CPI or core-PCE, they are the prices consumers regularly see when filling up their cars.
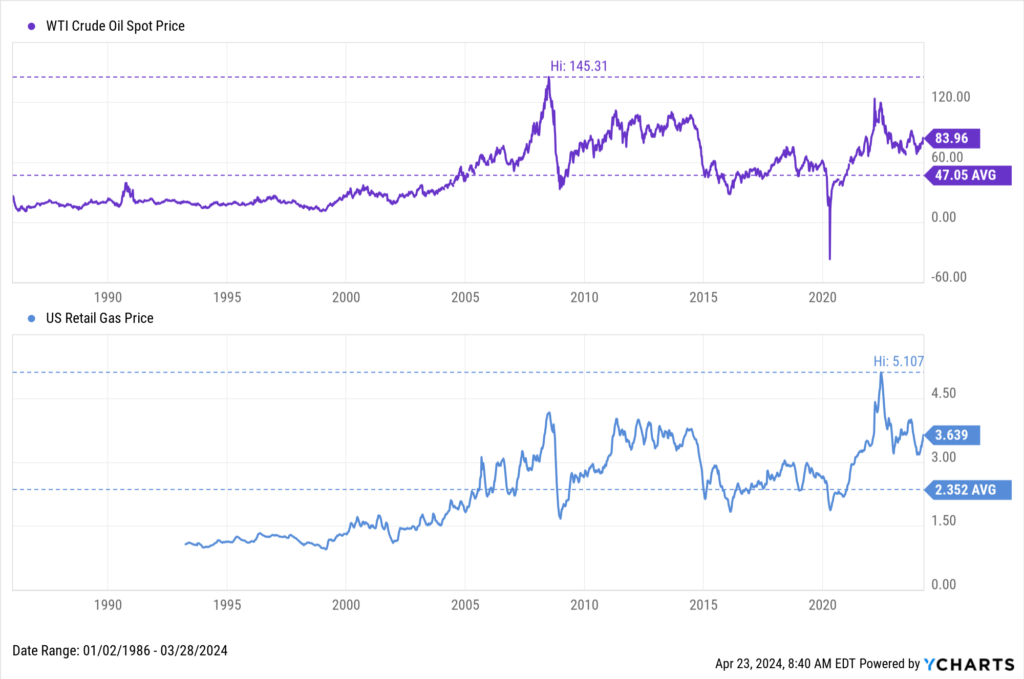
Download Visual | Modify in YCharts
Zooming into the last three years, the story is a bit different, as Crude and US Retail Gas Prices are more in line with their averages. However, there is significantly less supply in the Strategic Petroleum Reserve Stocks, which could lead to higher prices.
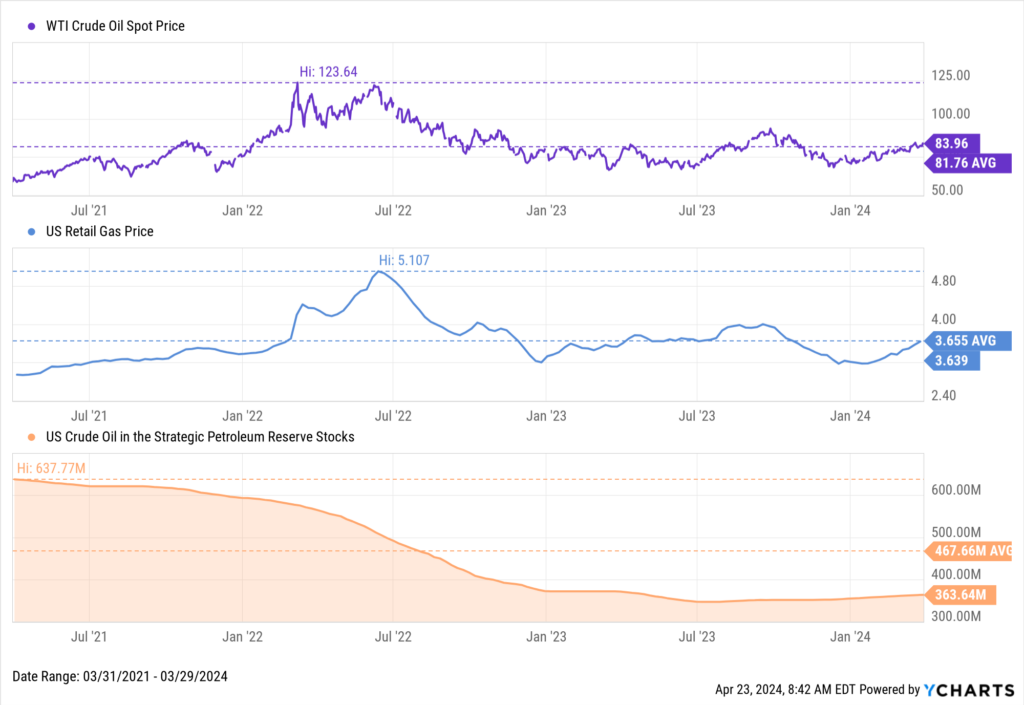
Download Visual | Modify in YCharts
Higher prices could also negatively impact consumer sentiment due to increased energy costs, which may be consequential in an election year. Moreover, increased oil prices could lead to good things for Q1’s sector leader: Energy.
Whenever you’re ready, there are 3 ways YCharts can help you:
1. Looking to better communicate the importance of economic events to clients?
Send us an email at hello@ycharts.com or call (866) 965-7552. You’ll be directly in touch with one of our Chicago-based team members.
2. Want to test out YCharts for free?
Start a no-risk 7-Day Free Trial.
3. Download a copy of the Quarterly Economic Update slide deck:
Download the Economic Summary Deck:Disclaimer
©2024 YCharts, Inc. All Rights Reserved. YCharts, Inc. (“YCharts”) is not registered with the U.S. Securities and Exchange Commission (or with the securities regulatory authority or body of any state or any other jurisdiction) as an investment adviser, broker-dealer or in any other capacity, and does not purport to provide investment advice or make investment recommendations. This report has been generated through application of the analytical tools and data provided through ycharts.com and is intended solely to assist you or your investment or other adviser(s) in conducting investment research. You should not construe this report as an offer to buy or sell, as a solicitation of an offer to buy or sell, or as a recommendation to buy, sell, hold or trade, any security or other financial instrument. For further information regarding your use of this report, please go to: ycharts.com/about/disclosure
Next Article
Charting the Success of etf.com's Past Winners Ahead of the 2024 AwardsRead More →