New on YCharts: ESG Visuals for Stocks, ETFs & Mutual Funds
Dedicated ESG pages for stocks, ETFs, and mutual funds are now available on YCharts! Accessible from any security’s Quote Page (e.g. AAPL or DODGX), the new ESG Tab adds visualizations and new functionality to the platform’s existing ESG data set.
Enabling you to research and evaluate a company’s or fund’s ESG traits and trends—and illustrate your insights to clients or prospects—the data and visualizations are available to YCharts Professional users, and as an add-on for asset manager users. ESG data on YCharts is sourced from MSCI, and updated daily to reflect the latest information and score or rating changes. To learn more about screening for stocks and funds using ESG data on YCharts, read here.
Analyze, Understand & Compare A Security’s ESG Traits
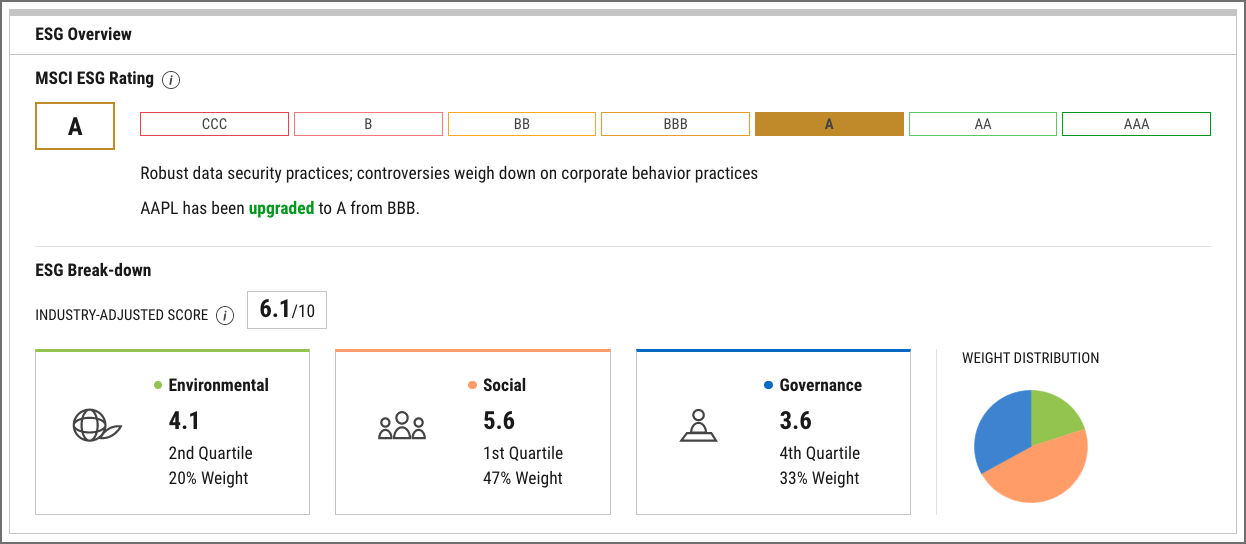
As part of your regular research process or in preparation for client meetings, a quick glance at any security’s ESG Tab provides a wealth of information with context-building stats and visuals. The ESG Overview module, shown here for Apple, includes two sections: the security’s ESG Rating from MSCI, and a breakdown of its industry-adjusted ESG Score by Environmental, Social, and Governance components.
The ESG Rating is supplemented with a brief, written explanation and a note on the security’s upgrade or downgrade trend. The ESG Breakdown provides a visual of component weights for that security’s industry, and includes the quartile in which it falls for each component score. (Note: the industry-Adjusted Score is calculated relative to the security’s industry; it is not a simple weighted average of the E, S, and G scores.)
Apple Inc (AAPL) – ESG Overview
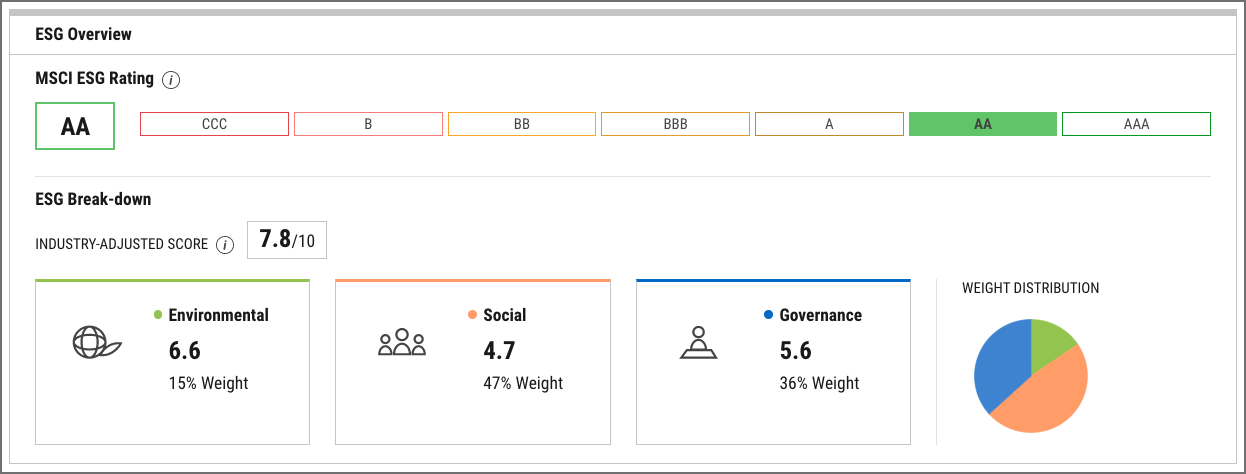
The ESG Rating and Breakdown sections are similar for ETFs and mutual funds, shown here for the Dodge & Cox Stock fund. ESG Ratings for funds rank managers on their abilities to manage ESG risks. Scores for funds are calculated as a weighted average of holdings’ ESG scores, and industry ties (discussed below) look at the percentage of a fund’s market value exposed to companies with a relevant industry tie.
Dodge & Cox Stock (DODGX) – ESG Rating & Breakdown
Illustrate ESG Insights to Clients & Prospects
YCharts’ ESG Tabs for stocks and funds lead with visuals and were designed to both inform decision-making, and be shared with clients. When looking for more granular insights on why a security was given a certain ESG Rating or component score, look to the broken-out Environmental, Social, and Governance modules.
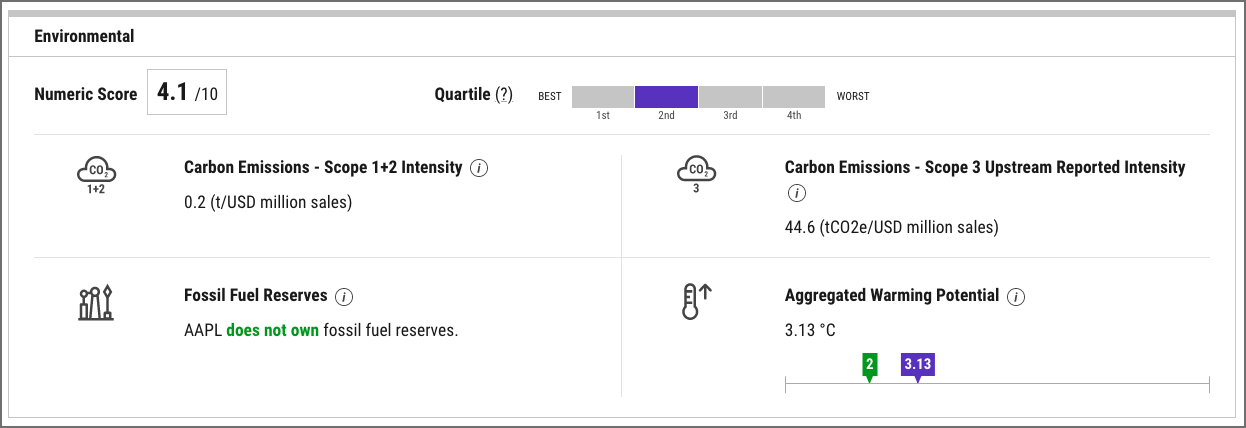
Apple Inc (AAPL) – Environmental Score
In addition to its Environmental Score, a security’s Environmental Score Quartile, Carbon Emissions (Scope 1+2), Carbon Emissions (Scope 3), Fossil Fuel Reserves, and Aggregated Warming Potential are included. (Note: Beyond those shown below, MSCI uses further Environmental factors to determine a security’s Numeric Score.)
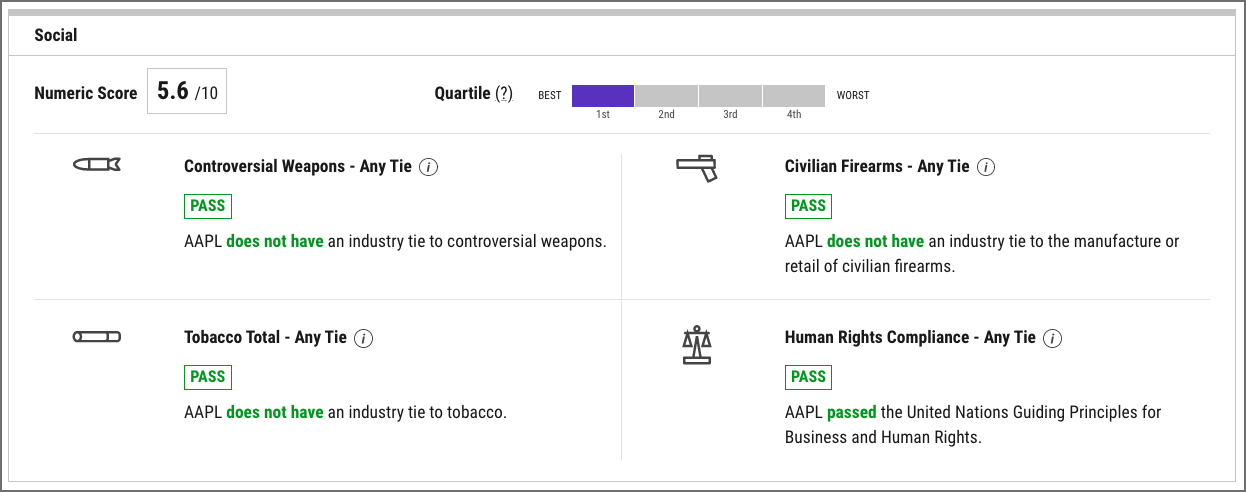
Apple Inc (AAPL) – Social Score
Accompanying the Social Score are the security’s Social Score Quartile and any ties to Controversial Weapons, Civilian Firearms, Tobacco, and Human Rights Compliance issues.
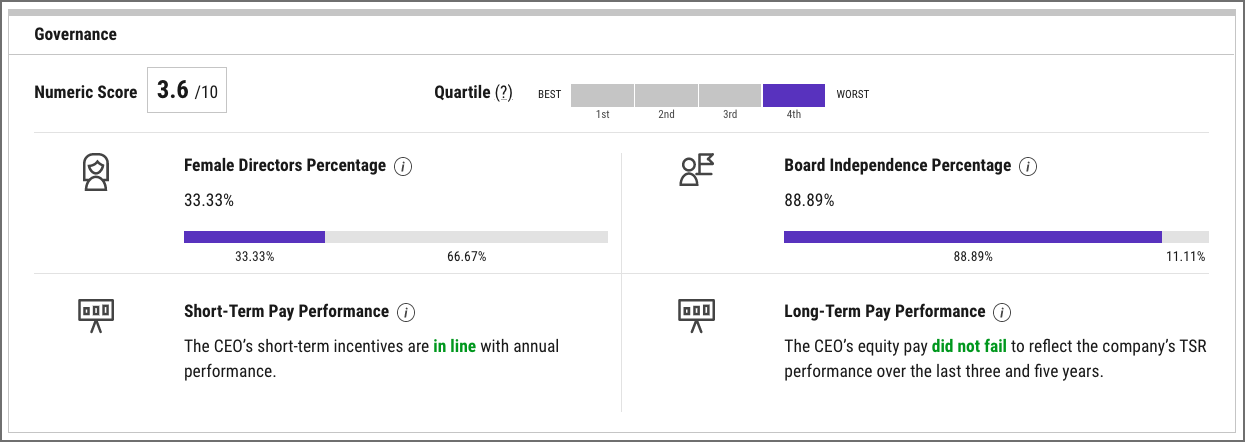
Apple Inc (AAPL) – Governance Score
Related to a security’s Governance Score, its Governance Score Quartile, Female Directors Percentage, Board Independence Percentage, and Short-Term and Long-Term Pay Performance are listed.
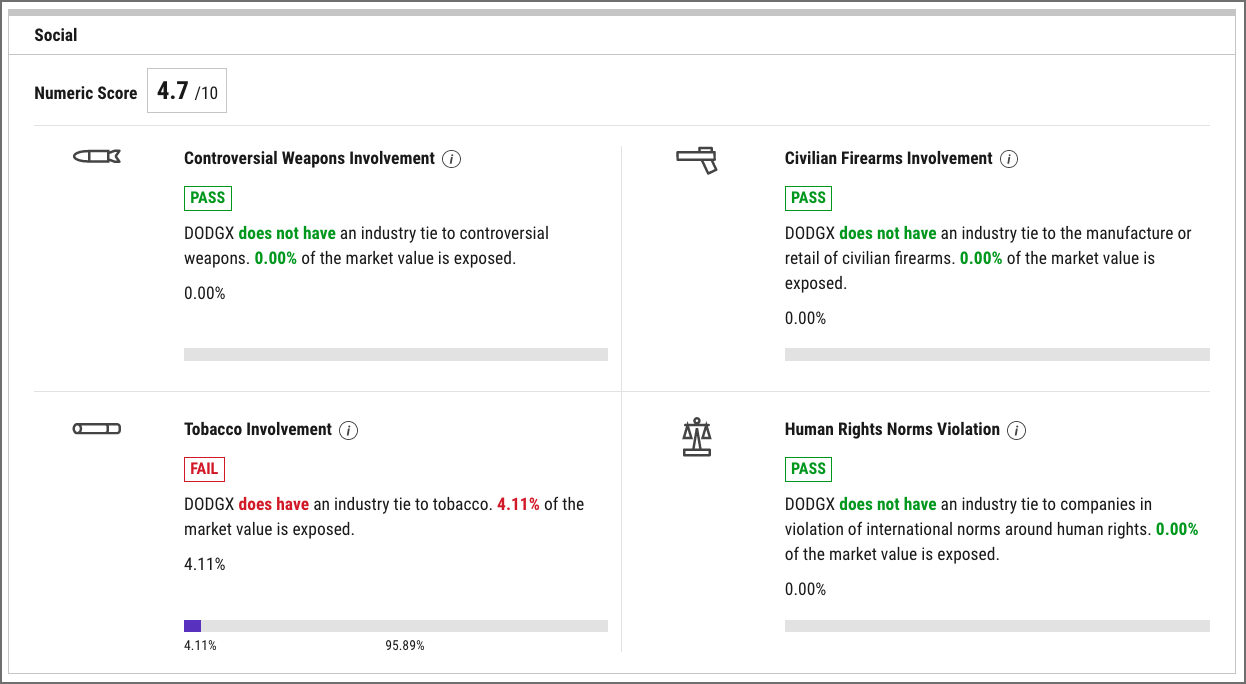
Dodge & Cox Stock (DODGX) – Social Score
ETFs and mutual funds also feature dedicated Environmental, Social, and Governance modules on their ESG tabs, but with slightly different data than equities.
Using Dodge & Cox Stock’s Social module as an example, the fund’s Social Score is supplemented by the percentage of its market value exposed to companies with ties to Controversial Weapons, Civilian Firearms, Tobacco, and Human Rights Norms Violations.
Dive Deeper into ETF & Mutual Fund Holdings’ ESG Merits
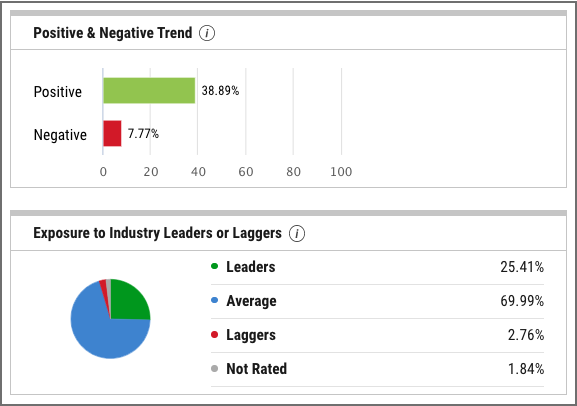
Ideal for informing your investment decisions with mutual funds and ETFs, funds’ ESG Tabs deliver even more insights. Still using Dodge & Cox Stock (DODGX) as an example, the Positive & Negative Trend and Exposure to Leaders or Laggers modules show percentages of the fund’s market value by both directional ESG trend and ESG Rating.
Positive & Negative Trend: the percentage of a fund’s market value with a positive or negative ESG Rating trend, compared to the year prior.
Exposure to Leaders or Laggers: the percentage of a fund’s market value with an ESG Rating of AAA or AA (Leaders), A or BBB or BB (Average), B or CCC (Laggards), and those not rated by MSCI.
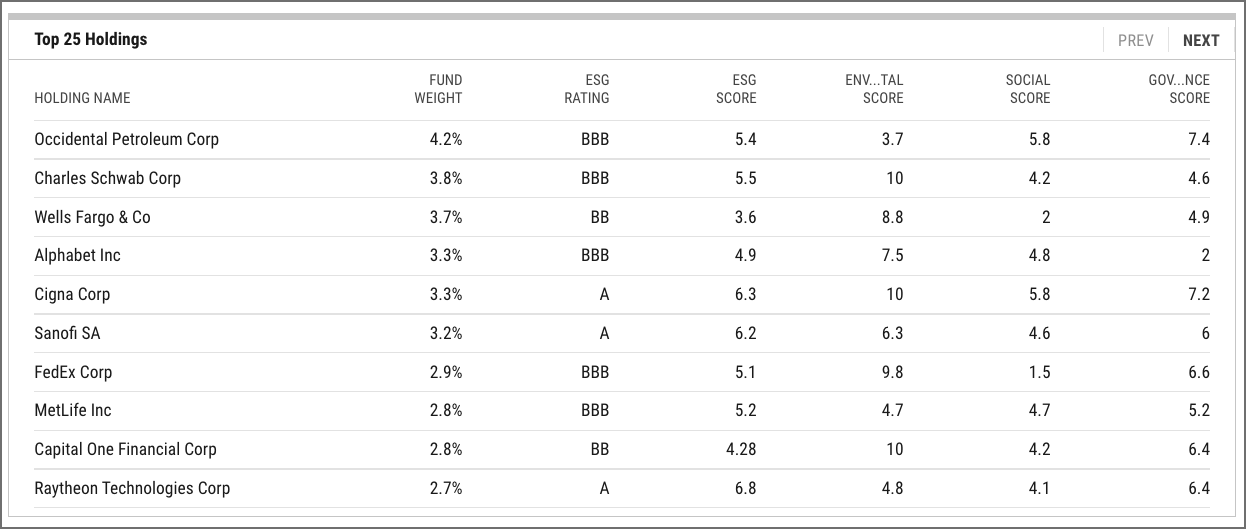
The Top 25 Holdings – ESG module, shown here for DODGX, is a scrollable list of any ETF’s or mutual fund’s largest holdings and their most important ESG traits. For each holding, its weight within the fund, ESG Rating, ESG Score (industry-adjusted), Environmental Score, Social Score, and Governance Score are included.
Coming Soon…
Further enhancements to our ESG data and functionality are already underway!
Coming soon are ESG Tabs and visuals for Model Portfolios on YCharts.
Connect with YCharts
To get in touch, contact YCharts via email at hello@ycharts.com or by phone at (866) 965-7552
Interested in adding YCharts to your technology stack? Sign up for a 7-Day Free Trial.
Disclaimer
©2022 YCharts, Inc. All Rights Reserved. YCharts, Inc. (“YCharts”) is not registered with the U.S. Securities and Exchange Commission (or with the securities regulatory authority or body of any state or any other jurisdiction) as an investment adviser, broker-dealer or in any other capacity, and does not purport to provide investment advice or make investment recommendations. This report has been generated through application of the analytical tools and data provided through ycharts.com and is intended solely to assist you or your investment or other adviser(s) in conducting investment research. You should not construe this report as an offer to buy or sell, as a solicitation of an offer to buy or sell, or as a recommendation to buy, sell, hold or trade, any security or other financial instrument. For further information regarding your use of this report, please go to: ycharts.com/about/disclosure
Next Article
$SHOP Price Cut, Record Low Oil Reserves, Short-Duration Funds | What's Trending on YCharts?Read More →