7 Categories Where Advisors Chose ETFs Over Mutual Funds in 2025
For much of the past decade, advisors and industry analysts debated whether ETFs would replace mutual funds. In 2025, that question quietly became where the shift accelerated fastest.
Across multiple equity categories, advisors actively abandoned the mutual fund wrapper in favor of ETFs.
Subscribe to the Fund Flow Report
| Peer Group | Mutual Fund 1Y | ETF 1Y | Difference (ETF minus MF) |
|---|---|---|---|
| S&P 500 Index | -263.93B | 226.18B | 490.11B |
| Large-Cap Growth | -133.26B | 92.67B | 225.93B |
| Large-Cap Core | -90.38B | 65.96B | 156.34B |
| Multi-Cap Core | -49.81B | 56.62B | 106.43B |
| International Multi-Cap Core | -24.21B | 71.28B | 95.49B |
| Equity Income | -53.76B | 29.04B | 82.80B |
| Multi-Cap Value | -37.33B | 29.95B | 67.28B |
| Emerging Markets | -30.33B | 30.20B | 60.53B |
| Large-Cap Value | -39.19B | 16.39B | 55.58B |
| Short U.S. Treasury | 0.17B | 50.84B | 50.67B |
| Mid-Cap Value | -14.71B | 33.90B | 48.61B |
| Mid-Cap Growth | -42.19B | 4.92B | 47.11B |
| Small-Cap Core | -47.00B | -4.32B | 42.68B |
| Mid-Cap Core | -23.93B | 17.61B | 41.54B |
| Multi-Cap Growth | -21.44B | 15.12B | 36.56B |
| International Large-Cap Growth | -36.54B | -0.91B | 35.63B |
| High Yield | -4.09B | 21.94B | 26.03B |
| Small-Cap Growth | -25.12B | -2.35B | 22.77B |
| Corporate Debt Funds (BBB Rated) | -0.68B | 20.02B | 20.70B |
| Core Plus Bond | -4.29B | 16.35B | 20.64B |
| General U.S. Treasury | 6.44B | 25.20B | 18.76B |
| Core Bond | 40.19B | 58.80B | 18.61B |
| Short Investment Grade Debt Funds | 1.99B | 19.12B | 17.13B |
| Loan Participation | -6.83B | 8.91B | 15.74B |
| International Large-Cap Core | 7.42B | 20.21B | 12.79B |
| International Income | 10.95B | 23.33B | 12.38B |
| European Region | 0.51B | 12.14B | 11.63B |
| International Multi-Cap Value | -5.46B | 5.80B | 11.26B |
| International Multi-Cap Growth | -10.60B | 0.32B | 10.92B |
| Ultra-Short Obligations Funds | 14.40B | 23.62B | 9.22B |
| U.S. Mortgage | 0.87B | 9.54B | 8.67B |
| Small-Cap Value | -5.83B | 2.01B | 7.84B |
| International Large-Cap Value | -4.09B | 3.66B | 7.75B |
| Corporate Debt Funds (A Rated) | -6.78B | 0.48B | 7.26B |
| International Small/Mid-Cap Value | -2.14B | 4.39B | 6.53B |
| International Small/Mid-Cap Growth | -6.34B | -0.05B | 6.29B |
| Short U.S. Government | -0.13B | 4.92B | 5.05B |
| International Equity Income | 1.02B | 5.84B | 4.82B |
| International Small/Mid-Cap Core | -2.48B | 2.27B | 4.75B |
| GNMA | -4.70B | 0.03B | 4.73B |
| Latin American | -0.02B | 2.93B | 2.95B |
| Intermediate U.S. Government | 2.50B | 5.34B | 2.84B |
| Pacific ex-Japan | -0.52B | 2.07B | 2.59B |
| Global Income | -0.50B | 2.05B | 2.55B |
| Inflation Protected Bond | 7.97B | 9.98B | 2.01B |
| Convertible Securities | -1.13B | 0.63B | 1.76B |
| General U.S. Government | -1.24B | -0.15B | 1.09B |
| Flexible Income | -0.39B | -0.06B | 0.32B |
| Emerging Mkts Hard Currency Debt | 1.33B | 1.61B | 0.28B |
| Short-Intermediate U.S. Government | -0.14B | 0.14B | 0.28B |
| India Region | -0.46B | -0.55B | -0.09B |
| Japanese | -0.18B | -0.84B | -0.66B |
| Pacific Region | 0.35B | -0.74B | -1.09B |
| Emerging Mkts Local Currency Debt | 3.11B | 1.55B | -1.56B |
| Specialty Fixed Income | 1.33B | -0.37B | -1.70B |
| High Yield Municipal Debt | 6.63B | 4.69B | -1.94B |
| China Region | 0.13B | -3.29B | -3.42B |
| Equity Leverage | -0.66B | -10.23B | -9.57B |
| General Bond | 12.89B | 0.77B | -12.12B |
| Multi-Sector Income | 46.74B | 22.72B | -24.02B |
The data shows significant and persistent mutual fund outflows paired with equally robust ETF inflows, often within the same category. These seven peer groups highlight where wrapper choice was the dominant decision, driven by cost efficiency, tax awareness, scalability, and ease of implementation in model-driven portfolios.
While the S&P 500 Index sits at the top of the ETF–mutual fund ranking, it is excluded from the analysis below. Its scale reflects a long-standing structural shift that predates 2025, and that story is largely written, and well, vanilla.
Table of Contents
Large-Cap Growth
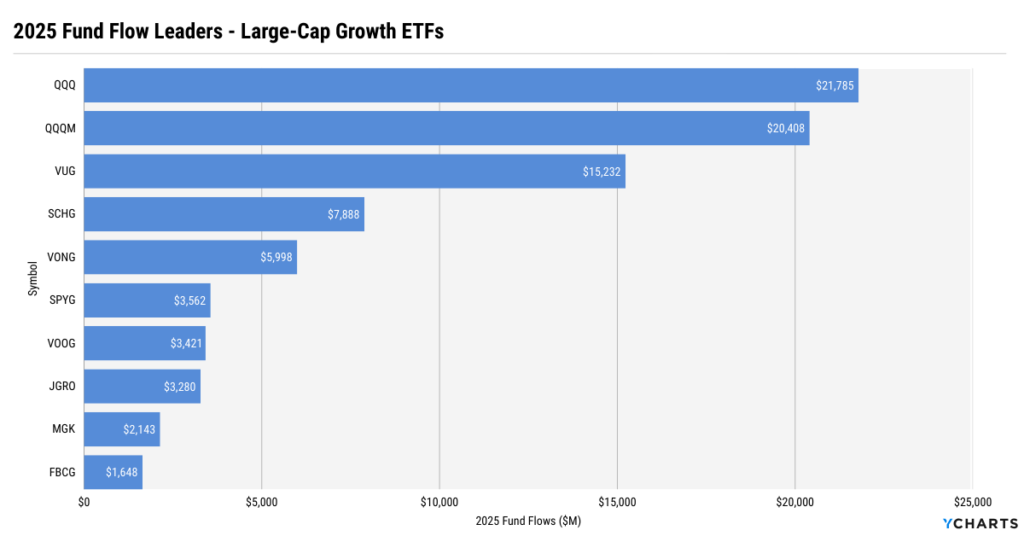
Large-Cap Growth mutual funds saw $133.3B in outflows, while ETFs absorbed $92.7B in inflows, a $225.9B swing toward ETFs. ETFs now hold $1.2T of the category’s $3T total AUM, meaning roughly 39% of Large-Cap Growth assets now sit in ETFs.
Get the Fund Flow Data in YCharts
The Invesco QQQ Trust (QQQ) led Large-Cap Growth ETF flows in 2025, with $21.8B in inflows, adding roughly 5% to its $412B AUM, while QQQM followed with $20.4B, an outsized 29% of its $74B AUM, highlighting advisor sensitivity to fees within the same exposure set. Vanguard Growth ETF (VUG) gathered $15.2B, equal to 7.5% of its $204B AUM, reinforcing its role as a default growth allocation.
Schwab U.S. Large-Cap Growth ETF (SCHG) attracted $7.9B, growing assets by 15%, while Vanguard Russell 1000 Growth ETF (VONG) added $6B, or 17% of AUM. State Street’s SPYG ($3.6B; 8% of AUM) and Vanguard S&P 500 Growth ETF (VOOG, $3.4B; 16% of AUM) further show that Large-Cap Growth demand is consolidating around efficient, transparent ETF wrappers.
Large-Cap Core
Advisors pulled $90.4B from Large-Cap Core mutual funds while allocating $66B to ETFs, producing a $156.3B ETF advantage in 2025. ETFs now account for $536B of the $1.8T category ($536B ETF vs. $1.3T mutual), or about 30% of total AUM.

Get the Fund Flow Data in YCharts
The largest winner, iShares U.S. Equity Factor Rotation Active ETF (DYNF), pulled in $13.4B, equal to 43% of its AUM, signaling growing advisor comfort using systematic and active ETFs as primary core allocations. Similar dynamics played out in iShares S&P 100 ETF (OEF), which gathered $10.3B, or 35% of AUM, as advisors leaned into concentrated mega-cap exposure for core equity positioning.
Momentum strategies also played a prominent role in the wrapper shift. The Invesco S&P 500 Momentum ETF (SPMO) added $7.7B, representing 57% of its AUM, one of the highest flow-to-asset ratios in the category, while iShares MSCI USA Momentum Factor ETF (MTUM) attracted $4.1B, increasing its asset base by nearly 20%.
Broad and enhanced core strategies continued to gain traction. Invesco MSCI USA ETF (PBUS) took in $3.3B (31% of AUM), Capital Group Core Equity ETF (CGUS) added $3B (36% of AUM), and Columbia Research Enhanced Core ETF (RECS) grew assets by 54% with $2.6B in inflows.
At the extremes, Fundstrat Granny Shots U.S. Large-Cap ETF (GRNY) surged 75% on $2.9B in inflows, while Schwab U.S. Large-Cap ETF (SCHX) added $2.5B, a modest 4% AUM increase, underscoring the split between fast-growing innovators and mega-scale core defaults.
Multi-Cap Core
Multi-Cap Core mutual funds lost $49.8B, while ETFs gained $56.6B, resulting in a $106.4 gap in favor of ETFs. ETFs now hold $1T of $3.5T in total AUM, putting ETF penetration at roughly 29%.

Get the Fund Flow Data in YCharts
The Vanguard Total Stock Market ETF (VTI) topped the list with $37.6B in inflows, adding roughly 6.6% to its $571B AUM, reinforcing its role as a default core allocation. iShares US Thematic Rotation Active ETF (THRO) followed with $6.6B, an exceptional 90% of AUM, signaling early advisor adoption of active core strategies.
The iShares Core S&P Total U.S. Stock Market ETF (ITOT) gathered $4.2B (5.2% of AUM), while the DFA US Equity Market ETF (DFUS) and T. Rowe Price Capital Appreciation ETF (TCAF) added $2.8B (16% of AUM) and $2.6B (40% of AUM), respectively. JPMorgan US Quality Factor ETF (JQUA) and Avantis US Equity ETF (AVUS) rounded out the leaders, highlighting growing advisor preference for rules-based quality and factor-aware core exposure.
International Multi-Cap Core
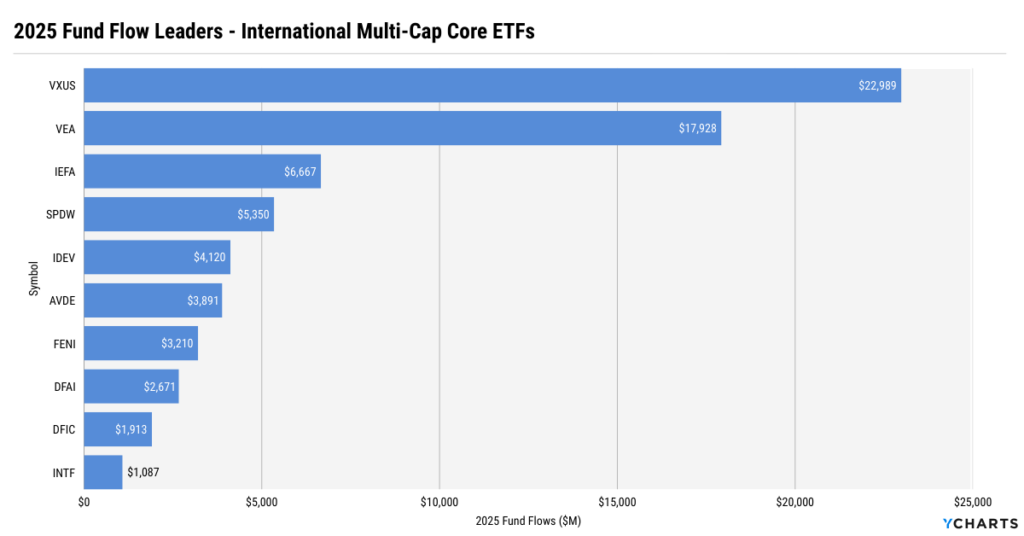
International Multi-Cap Core saw $24.2B leave mutual funds as $71.3B flowed into ETFs, a $95.5B swing toward ETFs. ETFs now represent $628B of the $1.3T category, or ~47% of total AUM.
Get the Fund Flow Data in YCharts
The category’s flows in 2025 were dominated by large, benchmark-oriented vehicles. Vanguard Total International Stock ETF (VXUS) led with $23B in 1-year inflows, adding 19% to its AUM, while Vanguard Developed Markets ETF (VEA) followed with $17.9B, a more modest 9% AUM increase given its larger base. iShares Core MSCI EAFE ETF (IEFA) also attracted $6.7B, and the SPDR Portfolio Developed World ex-US ETF (SPDW) pulled in$5.4B, equal to 16% of its asset base.
Beyond the mega-funds, advisors showed an appetite for differentiated approaches. The Avantis International Equity ETF (AVDE) gained $3.9B, equal to 34% of AUM, while Fidelity Enhanced International ETF (FENI) added $3.2B, expanding assets by 54%. Other strategies, such as DFA Dimensional International Core Equity Market (DFAI) and DFA Dimensional International Core Equity 2 ETF (DFIC), saw flows equal to 21% and 16% of AUM, respectively, underscoring how quickly international core exposure is consolidating into ETF wrappers.
Equity Income
Equity Income mutual funds experienced $53.8B in outflows, while ETFs attracted $29B, creating an $82.8B ETF advantage. ETFs now hold $478B of $953B in category assets, meaning just over 50% of Equity Income AUM now sits in ETFs.

Get the Fund Flow Data in YCharts
Flows in this category were led by dividend strategies that combined yield discipline with quality and growth screens. Capital Group Dividend Value ETF (CGDV) topped the category with $10.1B in inflows, equal to 38% of its AUM, underscoring strong advisor demand for active dividend management in an ETF wrapper.
First Trust Rising Dividend Achievers ETF (RDVY) followed with $3.6B (19% of AUM), while Vanguard Dividend Appreciation ETF (VIG) and Schwab U.S. Dividend Equity ETF (SCHD) each gathered roughly $3–3.5B, modest relative to their scale but reinforcing their role as core income allocations.
The Fidelity High Dividend ETF (FDVV) added $2.7B, expanding assets by 34%, while Amplify CWP Enhanced Dividend Income ETF (DIVO) grew 22% on $1.3B in inflows. Overall, flows suggest advisors are favoring dividend growth, quality tilts, and active income frameworks as they continue to migrate equity income allocations into ETFs.
Multi-Cap Value
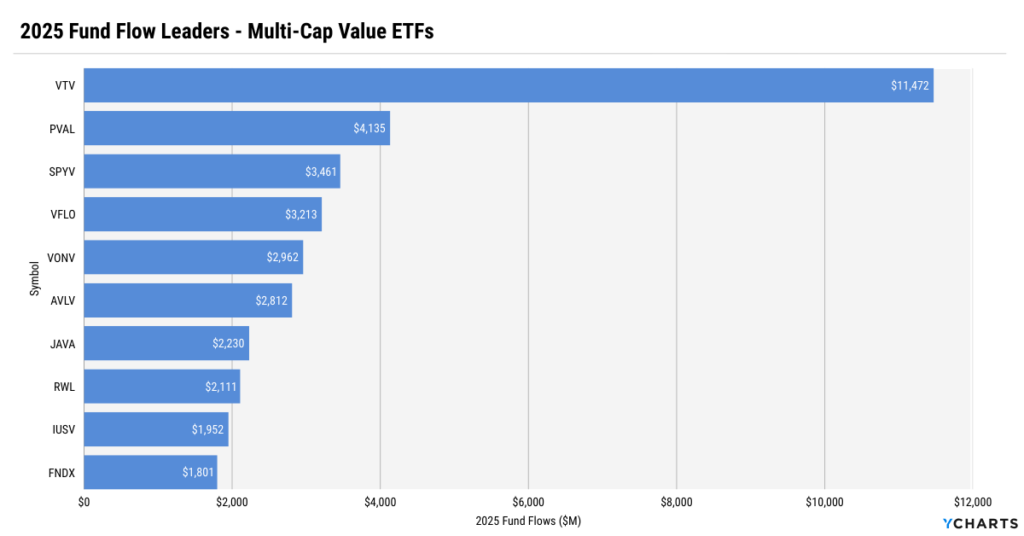
Multi-Cap Value mutual funds lost $37.3B, while ETFs gathered $30B, producing a $67.3B shift toward ETFs. ETFs now account for $490B of $1.1T in total AUM, or roughly 46% of the category’s assets.
Get the Fund Flow Data in YCharts
The Vanguard Value Index ETF (VTV) dominated in absolute terms, gathering $11.5B, equivalent to 7.3% of its $158B AUM, reinforcing its role as a core value building block. More striking, however, was the pace of adoption among smaller funds: Putnam Focused Large Cap Value ETF (PVAL) added $4.1B, a massive 62% of AUM, while VictoryShares Free Cash Flow ETF (VFLO) pulled in $3.2B, representing 57% of assets.
Advisors also showed strong interest in active and factor-tilted value. Avantis US Large Cap Value ETF (AVLV) gained $2.8B (31% of AUM), JPMorgan Active Value ETF (JAVA) added $2.2B (43% of AUM), and Invesco S&P 500 Revenue ETF (RWL) attracted $2.1B (29% of AUM). Overall, flows suggest value exposure is increasingly being accessed through rules-based, cash-flow-aware, and active ETF frameworks.
Emerging Markets
Emerging Markets mutual funds saw $30.3B in outflows, while ETFs absorbed $30.2B, resulting in a $60.5B ETF–mutual fund divergence. ETFs now hold $388B of $915B in total AUM, putting ETF penetration at approximately 42%.

Get the Fund Flow Data in YCharts
Core beta Emerging Markets vehicles led ETF flows in 2025. The iShares Core MSCI Emerging Markets ETF (IEMG) topped the category with $15.3B in inflows, equal to 12.7% of its $139B AUM, while Vanguard FTSE Emerging Markets ETF (VWO) followed with $8.6B, or 8.1% of AUM.
The Avantis Emerging Markets Equity ETF (AVEM) added $5.8B, a striking 36% of AUM, while SPDR Portfolio Emerging Markets ETF (SPEM) gathered $2.8B, or 18% of assets. The DFA Dimensional EM Core Equity ETF (DFEM) also saw meaningful adoption, with flows representing 17% of AUM, while Capital Group New Geography ETF (CGNG) stood out with inflows equal to nearly 80% of AUM, as the fund surpassed $1B in assets within a year of inception.
Conclusion
Taken together, these seven categories make one thing clear: the ETF migration is structural. Advisors are increasingly intentional about wrapper selection, consolidating core, income, value, and international exposure into ETFs that align with modern portfolio construction, operational efficiency, and client expectations.
Ready to Move On From Your Investment Research and Analytics Platform?
Sign up for a copy of our Fund Flows Report: to keep tabs on flows into ETFs and Mutual Funds:
Sign up for our free monthly Fund Flow Report:Follow YCharts Social Media to Unlock More Content!
*Legacy Provider’s name withheld due to respect of our competitors
Next Article
Why Advisors Who Modernize Their Reporting Outperform PeersRead More →