February 2025 Fund Flows: What’s Driving Demand for International Funds?
If you’d like to dive right into the international fund flow leaderboards, click here. You can also subscribe to the Fund flow report to stay updated on what’s driving demand.
Sign up to recieve a copy of our monthly Fund Flows Report:In the face of early 2025 volatility, international fund flows are showing strength—offering advisors yet another timely counterpoint to clients asking, “Why not just invest in the S&P 500?”
As of market close on March 21, 2025, the S&P 500 was down 3.3% in 2025 and was 7.6% off its all-time high (ATH) after reaching correction territory early in the month.

Download Visual | Modify in YCharts
That said, investors solely focusing on the S&P 500 or any other US-based index may be overlooking another portion of their equity sleeve: international equities.
A Decade of U.S. Outperformance
For much of the past decade, the relative outperformance of U.S. equities might have made it easy to neglect international positions. But as laid out in Merrill Lynch’s March 11th market update, Chris Hyzy, Chief Investment Officer for Merrill and Bank of America Private Bank, highlighted that Europe and other developed markets are now becoming “more attractive.”
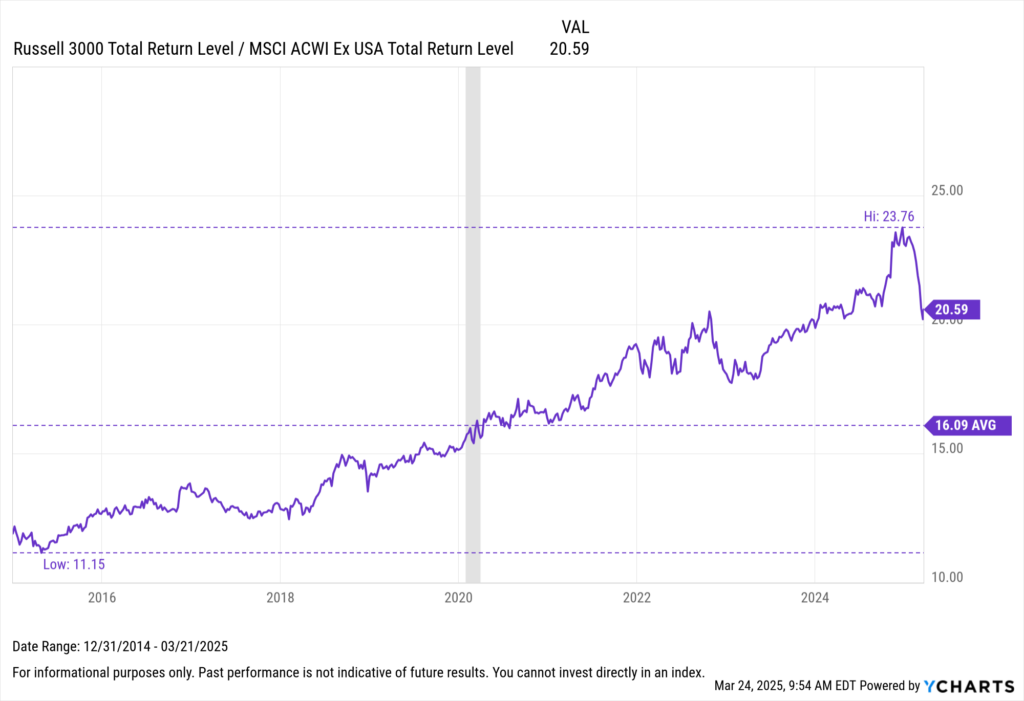
If you look at the total returns, U.S. stocks (tracked by the Russell 3000 Index) have really pulled ahead of international stocks (tracked by the MSCI ACWI Ex USA Index). Ten years ago, U.S. stocks were leading international stocks by a ratio of about 11 to 1. Now, that lead has widened to around 20 to 1.
Download Visual | Modify in YCharts
This type of relative outperformance has served as justification for American investors’ home-country bias during the observed timeframe. However, the concentration of a few stocks—such as the ‘Magnificent Seven’—that drove much of the gains in U.S. equities has also been a significant factor in the recent downturn (further details on what happened to the Magnificent Seven can be found here).
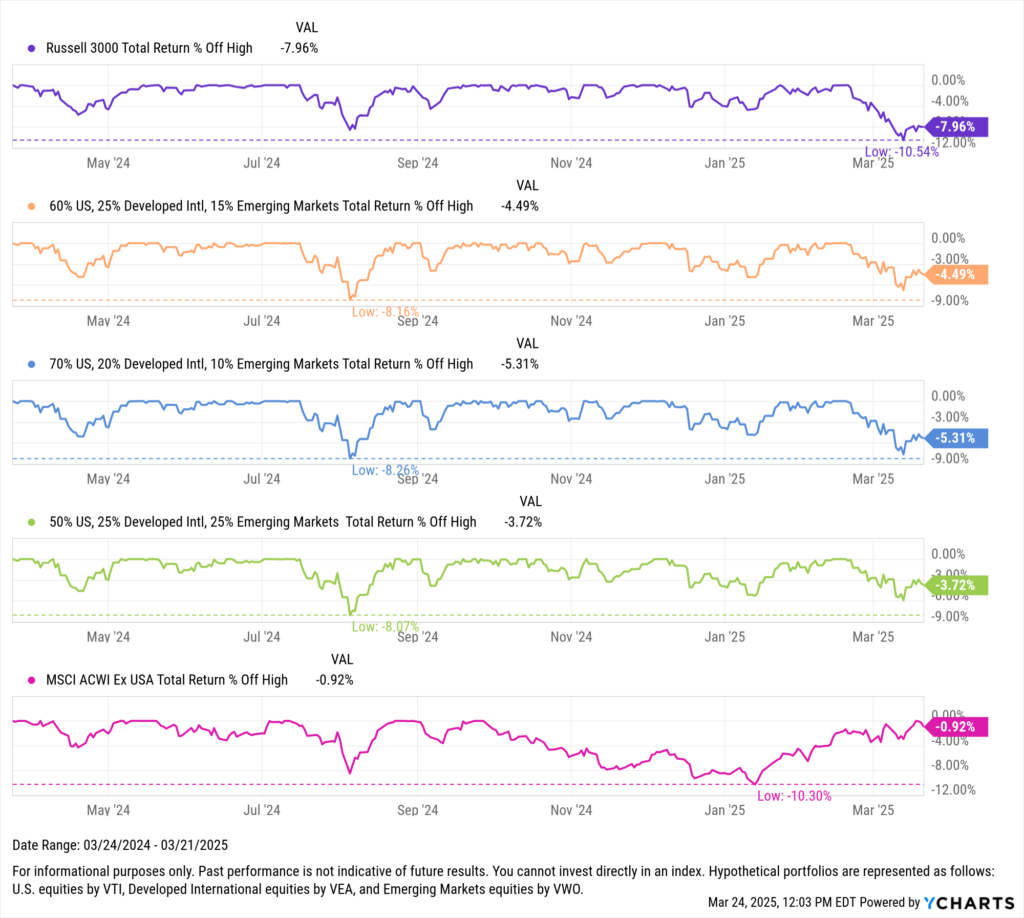
On the other hand, maintaining a geographically diverse mix of funds within an equity sleeve has mitigated the current downturn.
For instance, while the Russell 3000 currently sits 8% below its all-time high, an equity sleeve with 60% U.S. equity exposure is only 4.5% off its peak.
Download Visual | Modify in YCharts
Several other factors are enhancing the appeal of international equities. Firstly, and most headline-worthy, the prospect of tariffs may reconfigure global trade dynamics, potentially favoring companies positioned in markets less affected by these tariffs.
Secondly, broad assumptions of global rates falling could lower borrowing costs for international companies, boosting profitability.
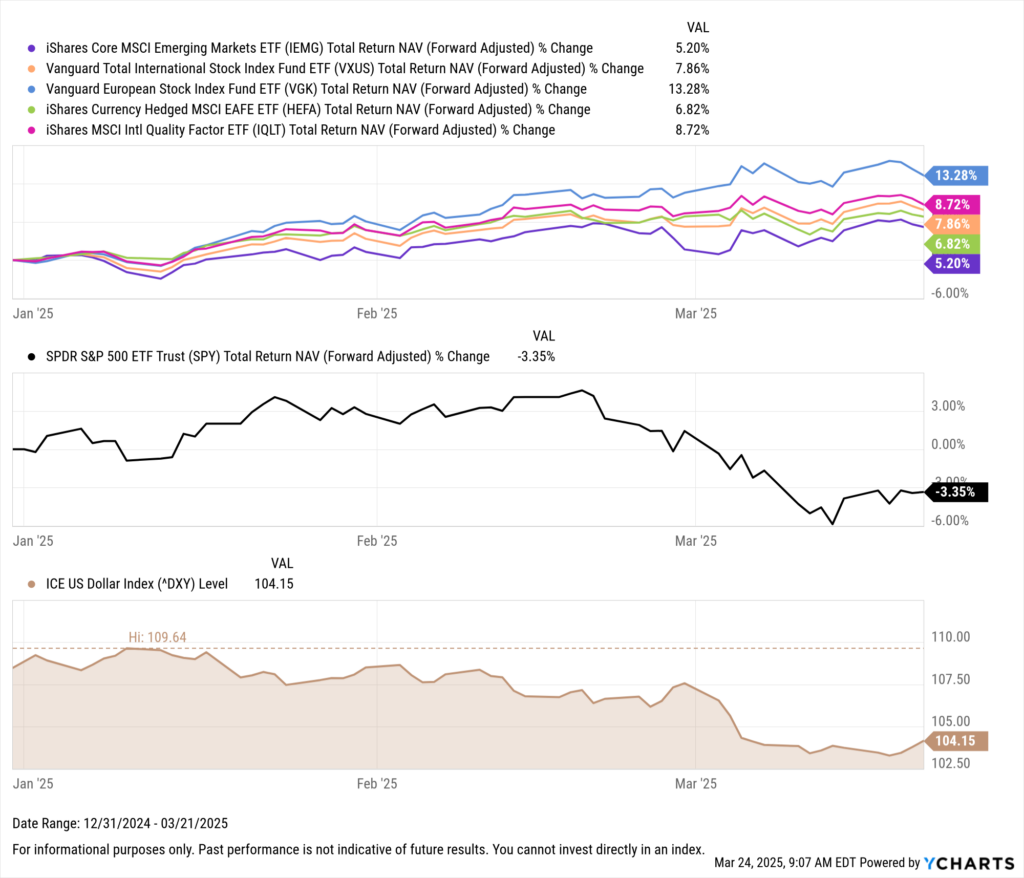
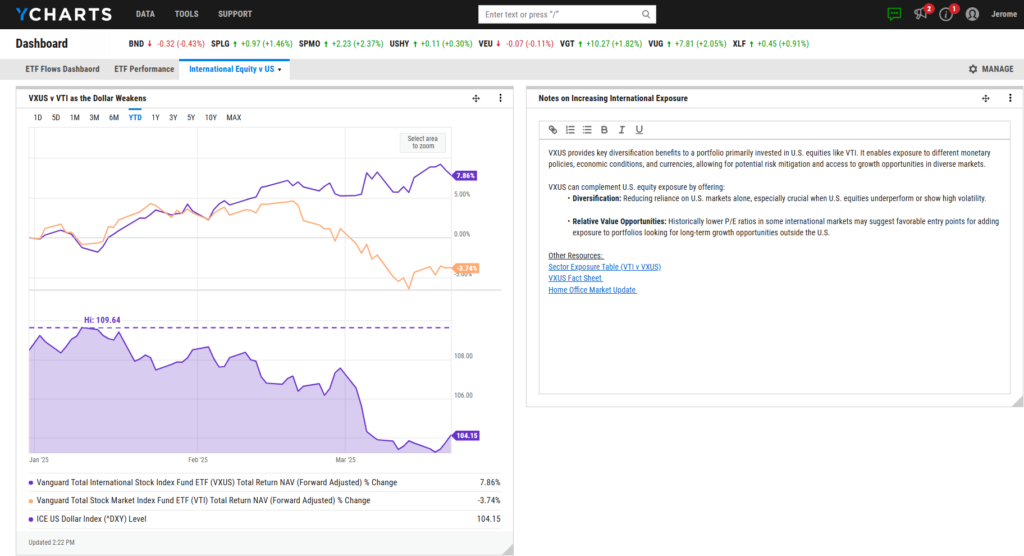
Lastly, the dollar’s waning relative strength serves as a significant tailwind, as a weaker dollar makes international companies’ goods more competitive in global markets and increases the value of overseas earnings when converted back to dollars.
Download Visual | Modify in YCharts
Now with a backdrop of international trade established, let’s take a look at the strategies that benefitted the most in terms of net new assets in February.
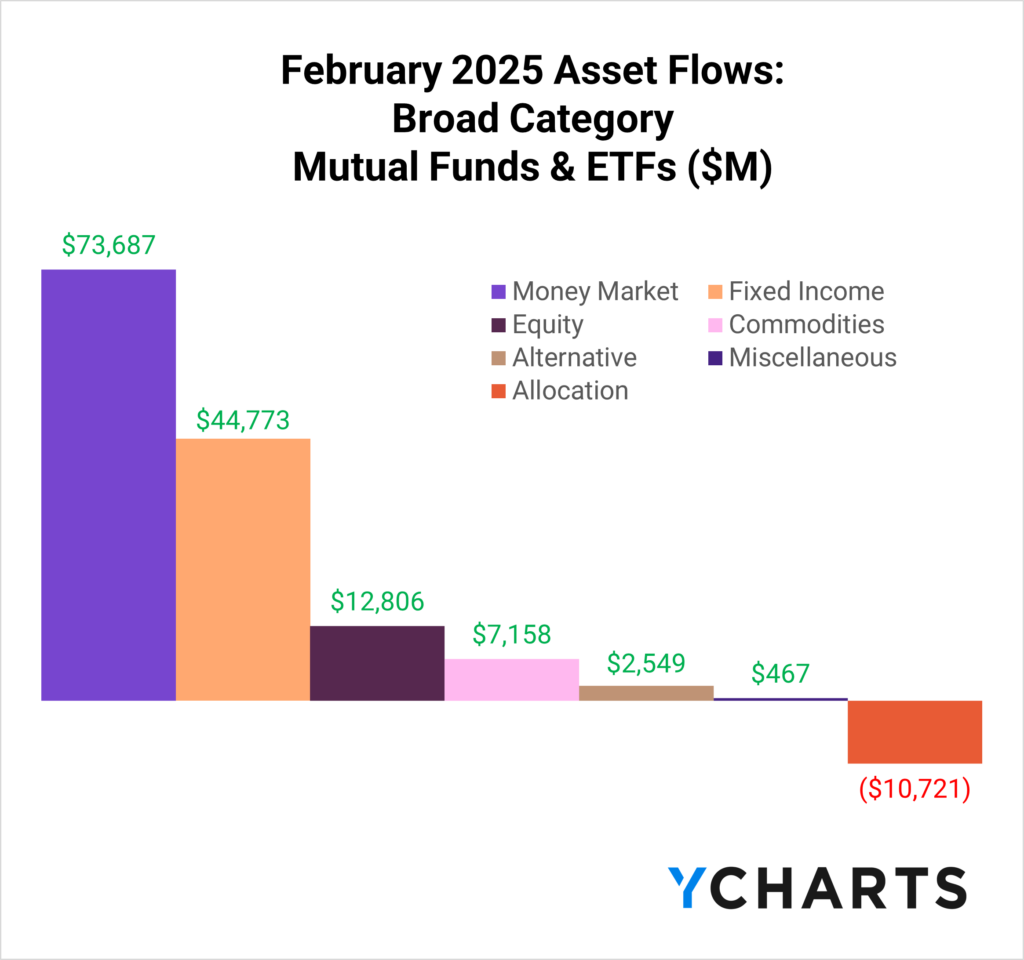
February Broad Category Fund Flows
Just as geographic diversification benefits the equity component of portfolios, diversification across asset classes also enhances the overall portfolio—and flows reflect this.
In February 2025, Fixed Income Funds amassed $44.8 billion in inflows, while money market funds led all asset classes with $73.7 billion. Both categories showed a significant increase from January. (For monthly insights on trends in active fixed-income ETFs, subscribe to the Fund Flow Report)
Importantly, after a setback in January, equity funds turned the tide in February, drawing $12.8 billion in net new assets across both ETFs and mutual funds.
Subscribe to the Fund Flow Report
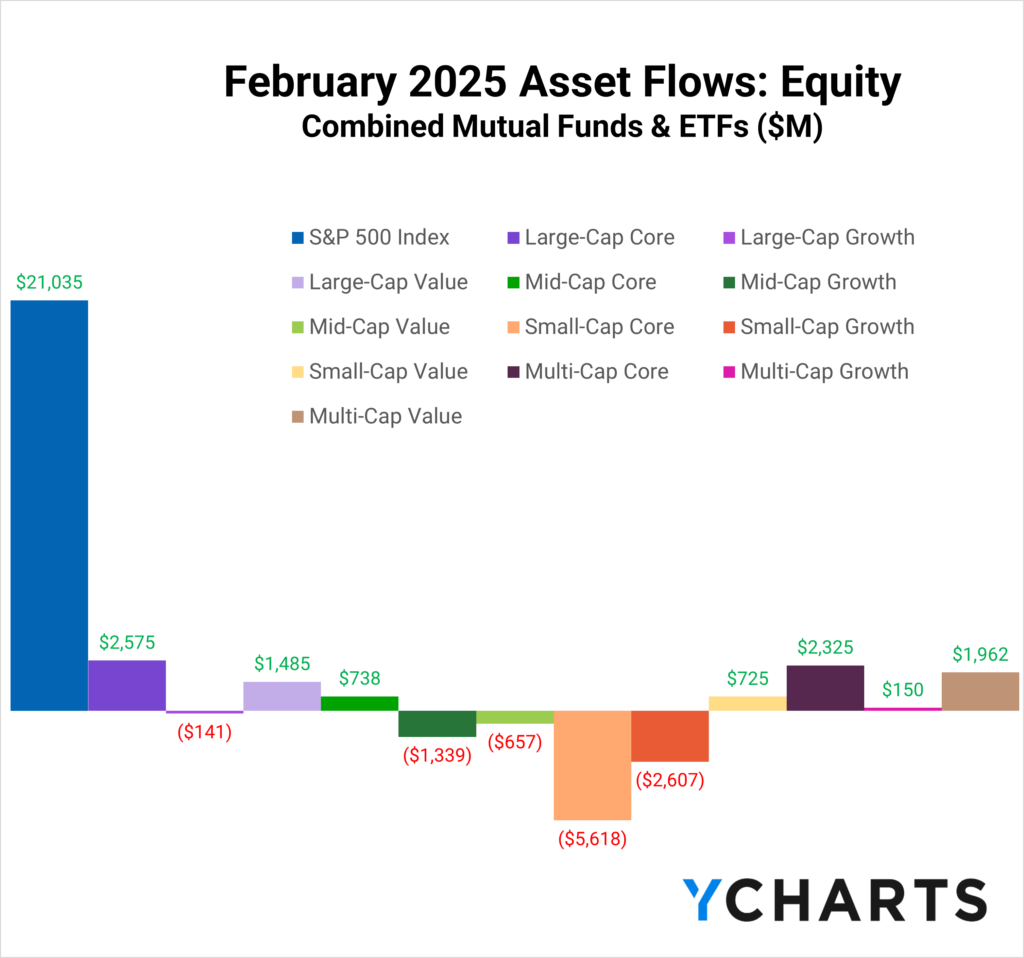
When looking at where those flows went, investors largely favored value-oriented strategies. Across market caps, the only growth segment to attract net positive inflows was multi-cap funds.
Subscribe to the Fund Flow Report
Flows Into International ETFs and Mutual Funds
When analyzing international fund flow trends, it’s crucial to distinguish between global strategies, which may include U.S. exposure and thus share similar risks with exclusively U.S.-based funds, particularly those employing a market-cap-based methodology.
To clarify, we focused on flows into exclusively ex-U.S. and region-specific funds.
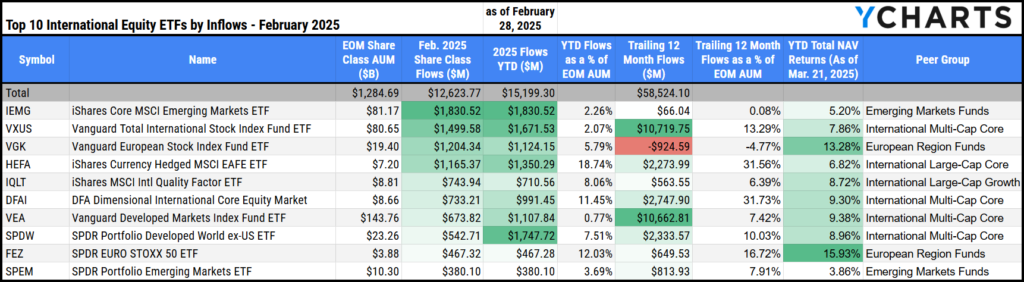
In February, the ETF leaderboard featured the iShares Core MSCI Emerging Markets ETF (IEMG), leading the charge with $1.8 billion in net new assets. It was closely followed by the Vanguard Total International Stock Index Fund ETF (VXUS), an international multi-cap strategy that attracted $1.5 billion. Rounding out the top three, Vanguard’s Europe-specific ETF, the Vanguard European Stock Index Fund ETF (VGK), garnered $1.2 billion in net new assets.

View & Modify the Comp Table in YCharts
On the mutual fund side, the Principal International Equity Fund R-6 (PIIDX) stood out with a whopping $5.1 billion in net inflows for the month. It was followed by the Fidelity Strategic Advisers Fidelity EM Fund (FGOMX), which brought in $1.7 billion, and the Fidelity SAI Canada Equity Index Fund (FSCJX), which collected $1.3 billion in new assets.
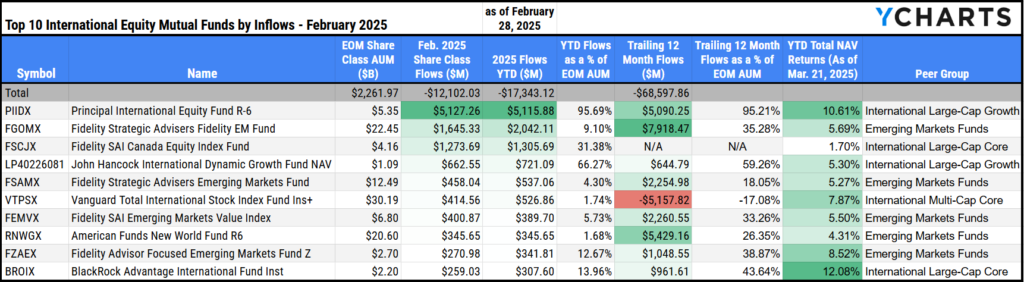
View & Modify the Comp Table in YCharts
Flows Into Active International ETFs and Mutual Funds
As with other investment trends, it’s important to evaluate active strategies in the international equity space. Investors may choose active management for non-domestic equities to benefit from a portfolio manager’s specialized expertise or deep understanding of specific geographic markets.
In February, the top active international equity ETFs in terms of flows were the iShares MSCI International Quality Factor ETF (IQLT), leading with $744 million on the month, followed closely by the DFA Dimensional International Core Equity Market (DFAI), which attracted $733 million. The Principal International Equity ETF (PIEQ) also had a strong month, bringing in $367 million in new assets.
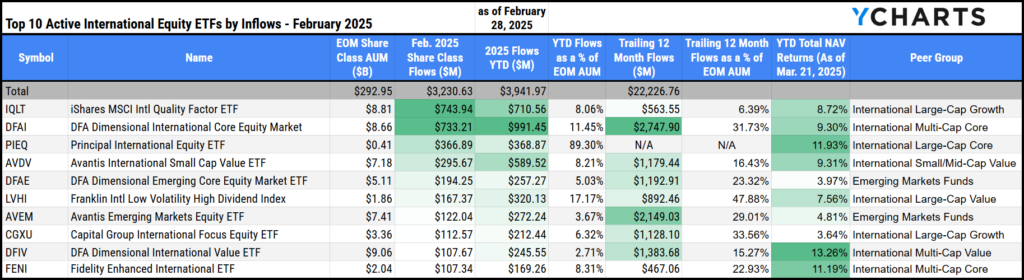
View & Modify the Comp Table in YCharts
Turning to mutual funds, PIIDIX and FGOMX led the pack. The John Hancock International Dynamic Growth Fund also stood out, bringing in $662 million in net inflows.
Not far behind, the Fidelity Strategic Advisers Emerging Markets Fund (FSAMX) and the American Funds New World Fund R6 (RNWGX) attracted $458 million and $345 million, respectively.
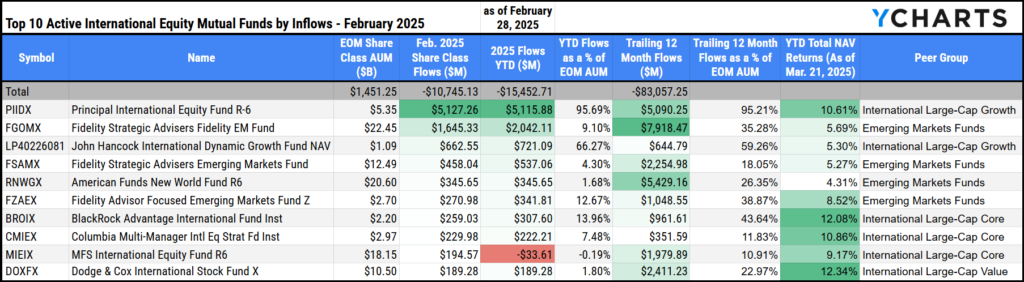
View & Modify the Comp Table in YCharts
Exploring the Allocation Differences in International Funds
When evaluating how international funds differ from domestic benchmark equity funds, Quickflows and YCharts AI Chat can help you quickly surface key differences in sector and geographic exposure—as well as valuation metrics like P/E ratios. With a simple query, the tool generates a customizable comparison table, making it easy to visualize and communicate the relative value international markets may offer compared to U.S. equities.
For example, a comparison table focused on sector exposure and weighted average P/E ratio reveals a key valuation story: February’s most popular international ETFs tend to have lower weighted average P/E ratios—generally in the low-to-mid 20s—compared to the S&P 500’s 32 (as represented by SPY).
This is largely due to their relative underweighting in high-multiple sectors like Technology, and overweighting in more value-oriented sectors like Industrials and Materials.
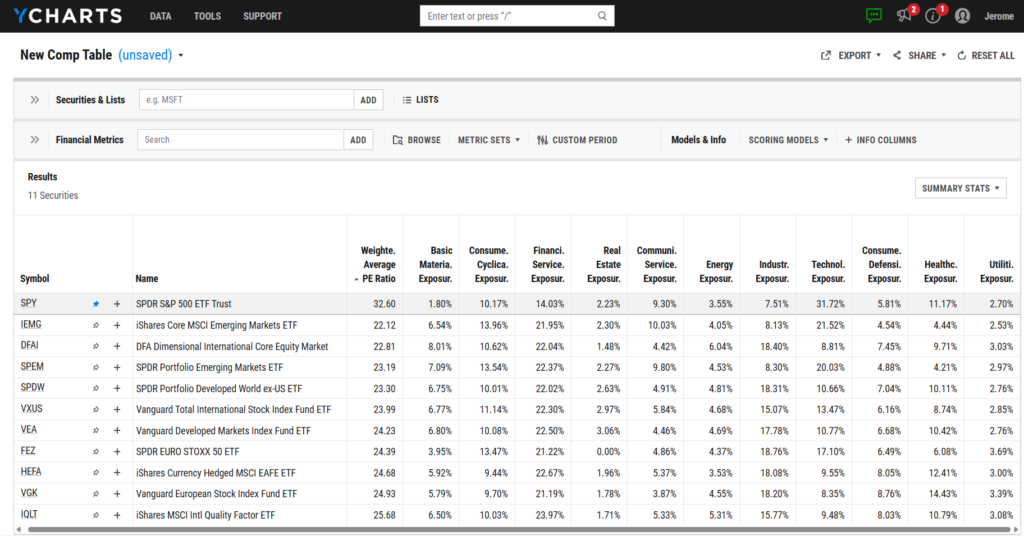
View & Modify the Comp Table in YCharts
To get the most out of AI Chat, we recommend using the Task–Audience–Guidance (TAG) methodology when crafting your prompt. Start by defining the Task (e.g., compare sector weights and valuation metrics between VXUS and VTI), identifying the Audience (e.g., advisor-facing or internal wholesaling teams), and offering specific Guidance on tone and format (e.g., “Make it concise and conversational for a team dashboard update”).
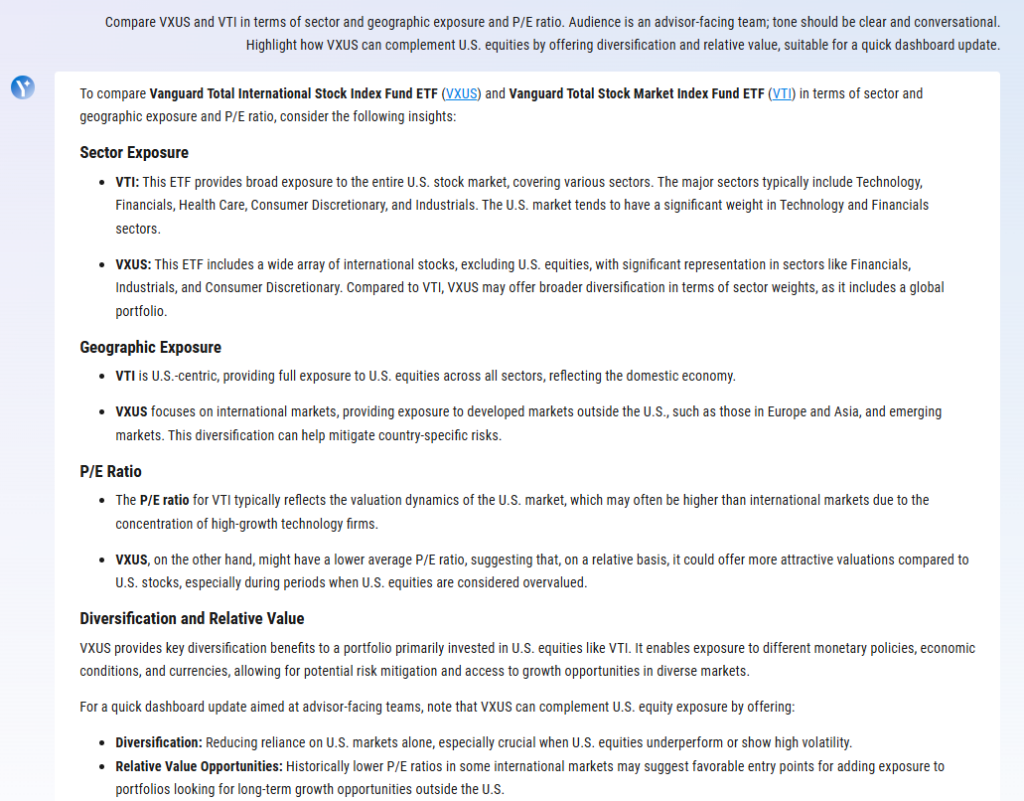
This structure helps generate a clear, insight-driven note that highlights your strategy’s differentiated value—ready to be shared across your distribution team.
Example Prompt:
“Compare VXUS and VTI in terms of sector exposure and P/E ratio. Audience is an advisor-facing team; tone should be clear and conversational. Highlight how VXUS can complement U.S. equities by offering diversification and relative value, suitable for a quick dashboard update.”
As investor interest in international strategies continues to grow, staying on top of fund flow trends can help distribution teams proactively position global opportunities. For deeper monthly insights, be sure to subscribe to the full Fund Flow Report and never miss a shift in what’s driving demand.
Whenever you’re ready, there are three ways YCharts can help you:
Have questions about how YCharts can help you grow AUM and prepare for meetings?
Email us at hello@ycharts.com or call (866) 965-7552. You’ll get a response from one of our Chicago-based team members.
Unlock access to our Fund Flows Report and Visual Deck by becoming a client
Sign up for a copy of our Fund Flows Report and Visual Deck:
Sign up to recieve a copy of our monthly Fund Flows Report:Disclaimer
©2025 YCharts, Inc. All Rights Reserved. YCharts, Inc. (“YCharts”) is not registered with the U.S. Securities and Exchange Commission (or with the securities regulatory authority or body of any state or any other jurisdiction) as an investment adviser, broker-dealer or in any other capacity, and does not purport to provide investment advice or make investment recommendations. This report has been generated through application of the analytical tools and data provided through ycharts.com and is intended solely to assist you or your investment or other adviser(s) in conducting investment research. You should not construe this report as an offer to buy or sell, as a solicitation of an offer to buy or sell, or as a recommendation to buy, sell, hold or trade, any security or other financial instrument. For further information regarding your use of this report, please go to: ycharts.com/about/disclosure
Next Article
S&P 500 Forecasts for 2025: Major Bank Predictions & 2024 Accuracy ReviewRead More →