Fed Rate Cut Looms: How Advisors Can Position Clients Now
Uncover the implications of the first Fed Fund Rate cut of 2025:
- Typical shifts in bond prices and Treasury yields.
- Consumer impacts on loans, credit cards, and savings yields.
- Historical stock market trends following rate cuts.
- Advisor considerations for client conversations and strategy.
Want to see how a rate cut impacts your clients’ portfolios?
Table of Contents
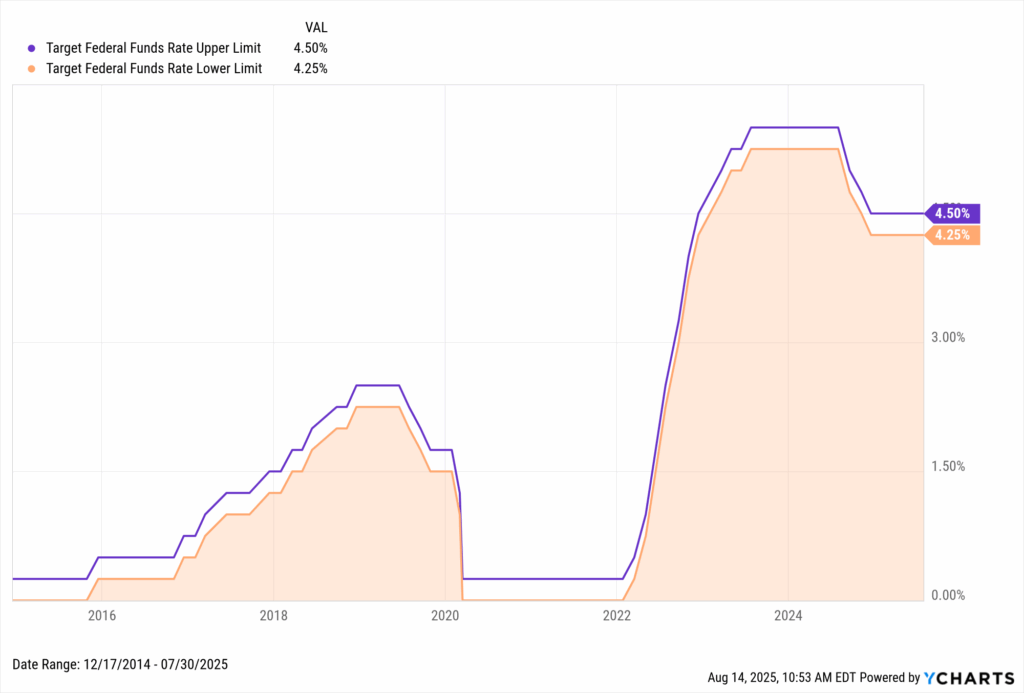
The Federal Reserve held the Fed Funds Rate at 4.25%-4.50% all year, but CME FedWatch shows over 90% chance of a 25 basis-point cut on September 17. While this would be the first cut in 2025, it would mark the fourth since September of 2024, when the Fed began lowering rates from 5.50%.
Even a quarter-point move can shift bond prices, equity momentum, lending costs, and portfolio strategy. This blog breaks down the likely impact across asset classes and consumer markets and how to position clients for opportunity in a falling-rate environment.
Download Visual | Modify in YCharts
How Bonds React to Fed Rate Cuts
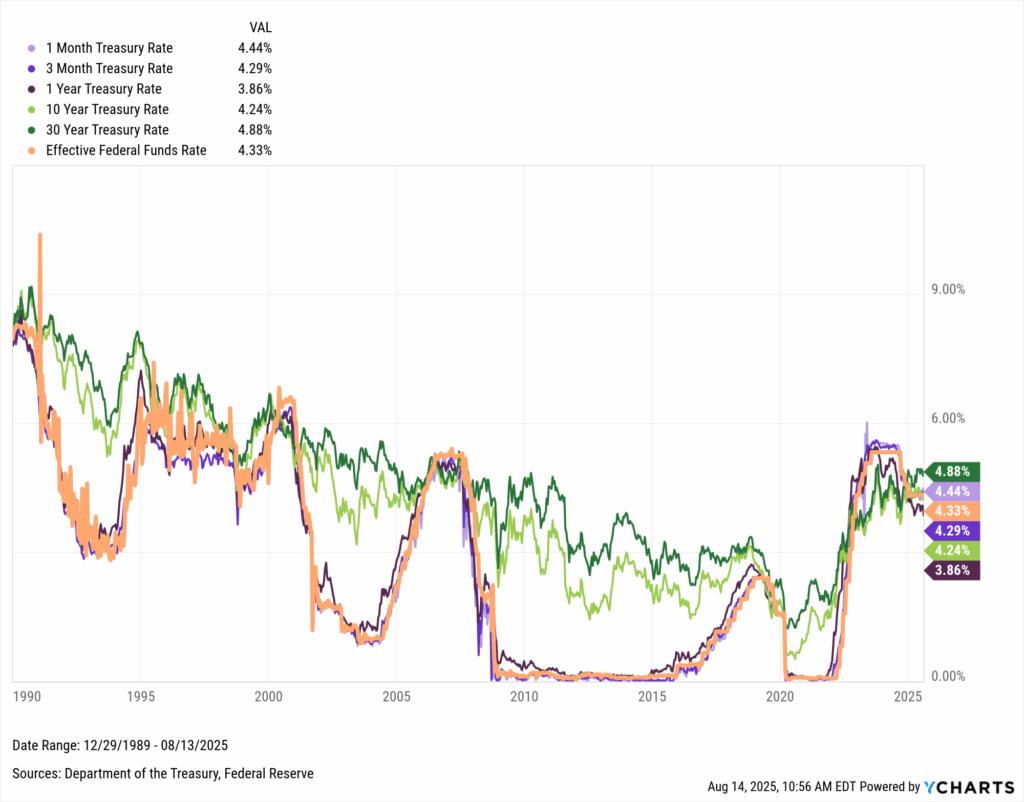
Short-term Treasury Bills and the yields they can offer are most directly affected by the Fed’s monetary policy, as stated by the Fed. Though any fixed-income instrument is subject to the ebbs and flows of the open market, short-term treasuries have historically moved in near lockstep with the Fed Funds Rate. This relationship is strongest for T-Bills, denoted in 1-Month, 3-Month, 6-Month, and 1-Year durations.
Longer-term treasuries, like the 10-Year Note and 30-Year Bond, don’t typically follow the Fed Funds Rate as closely, though they have trended along its general direction over the last 30 years. This is because the Fed does not directly target long-term interest rates, and the maturities on these instruments are denoted years or even decades out in time.
Download Visual | Modify in YCharts
Bond prices typically rise when rates fall. In a declining rate environment, new bonds come to market with lower coupons, making older issues with higher payouts more attractive and more valuable. Additional cuts could amplify this advantage, pushing existing bond prices higher as their yields outshine new, lower-rate offerings.
How Consumers Are Impacted
- Mortgage Rates → Slight drop but still high
- Credit Cards → Minimal relief
- CDs → Falling yields
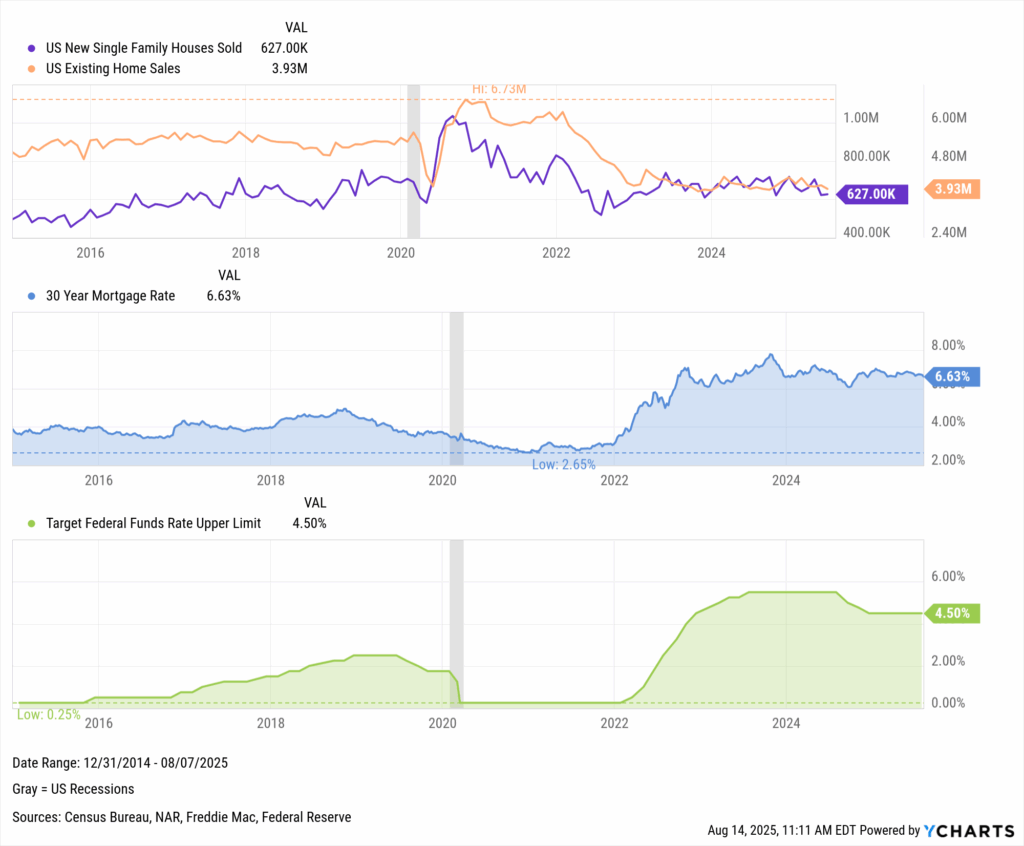
Mortgage Rates
Mortgage costs are among the most closely watched consumer impacts of Fed policy.
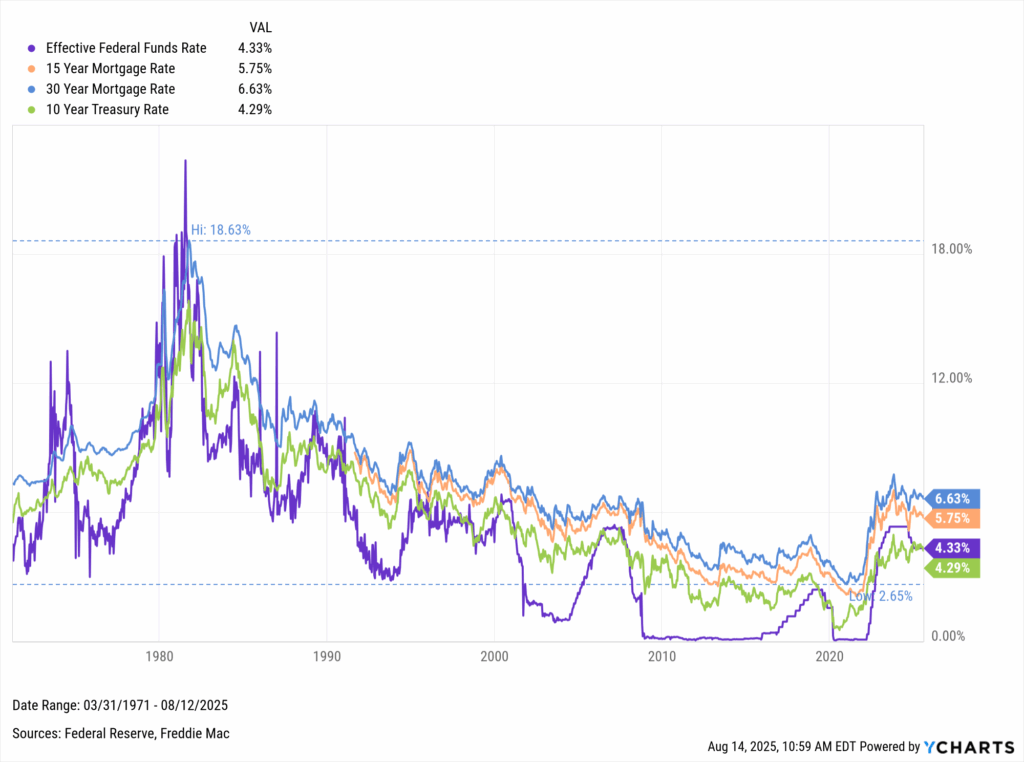
The prevailing 30-Year Mortgage Rate and its 15-Year counterpart tend to follow the 10-Year Treasury Rate more so than the Fed Funds Rate. Mortgages are backed by bonds and securities, which align more with an instrument like the 10-year treasury.
The Fed doesn’t directly target long-term instruments, but since rates of most shapes and sizes experience a ripple effect from the Fed’s actions, mortgage rates tend to do the same.
The 30-year rate peaked at 7.80% in October 2023, up from just 2.65% in January 2021. Late-2024 cuts pulled rates down from those highs, with 2025 holding steady during the Fed’s pause.
Download Visual | Modify in YCharts
So far, easing hasn’t broken the housing market’s “lock-in effect” where owners hesitate to swap low-rate mortgages for higher ones. Additional cuts could shift that dynamic, creating better conditions for buyers and potentially spurring more transactions.
Download Visual | Modify in YCharts
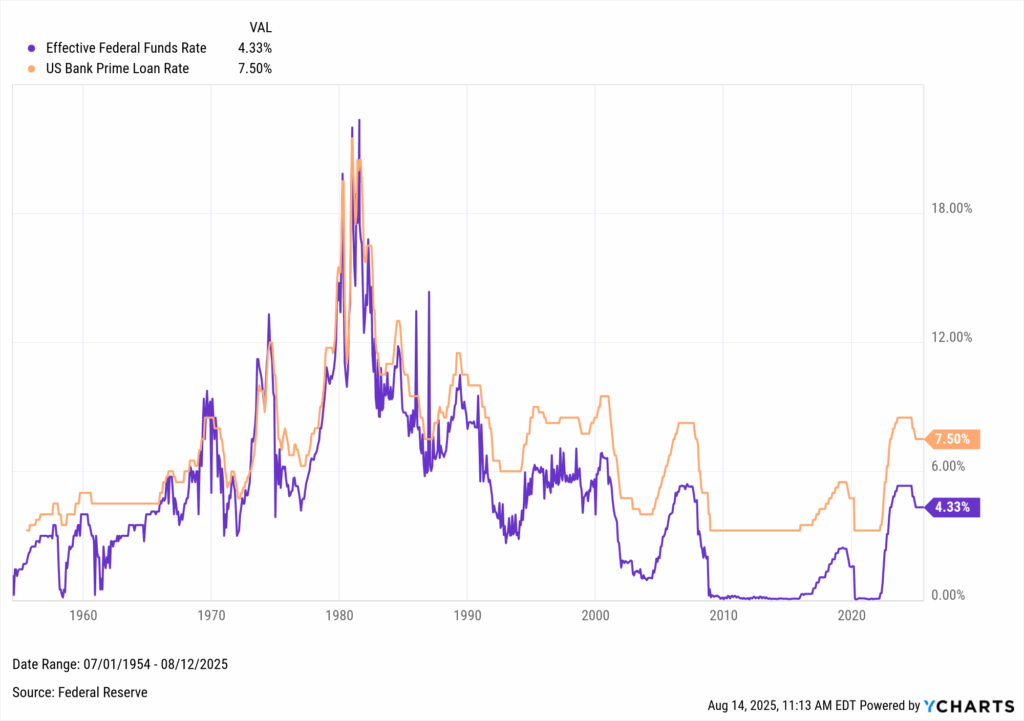
Prime Loan Rate
The Prime Loan Rate (Fed Funds Rate + roughly three percentage points) is the benchmark for banks lending to their best customers. It moves almost in lockstep with Fed policy.
The US Bank Prime Loan Rate is strongly correlated with the Fed Funds Rate. As seen in the chart below, the three Fed rate cuts toward the end of 2024 have brought the current Prime Loan Rate to 7.5%, one percentage point below its highest level in over 20 years.
Any further Fed rate cuts are likely to lower the Prime Loan Rate by a proportional amount, leading to lower borrowing costs and thereby stimulating economic activity.
Download Visual | Modify in YCharts
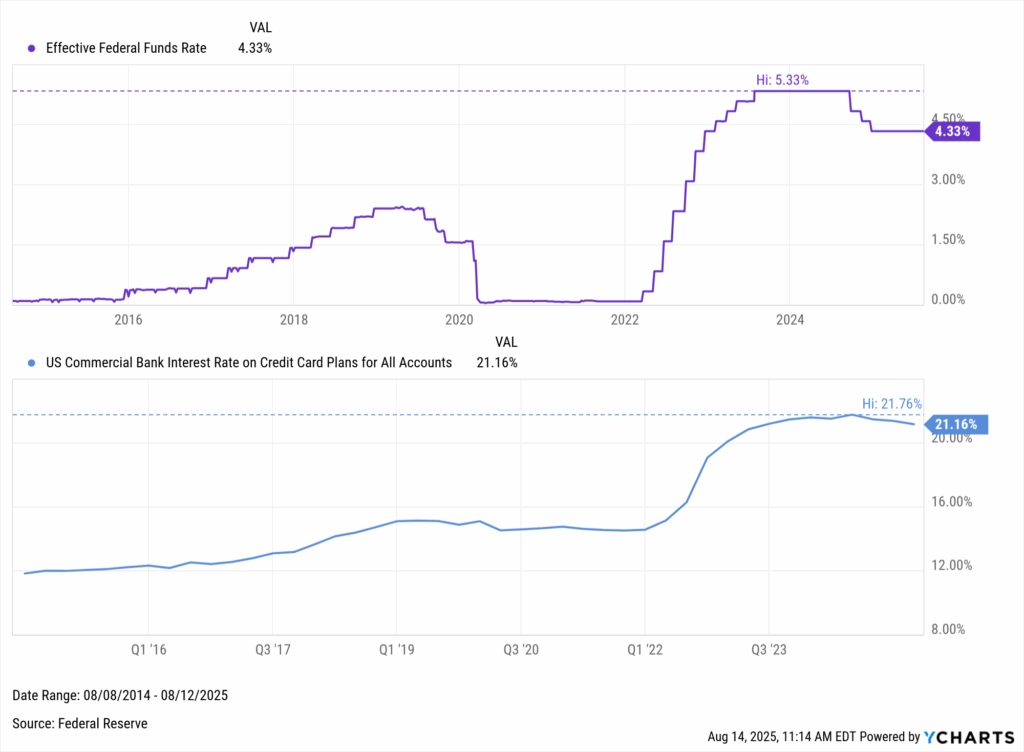
Credit Card Interest
Changes to the Fed Funds Rate can also influence credit card interest rates, known as Annual Percentage Rate (APR).
The link to Fed policy is somewhat inconsistent. APR barely moved lower when the Fed cut to 0% in 2020, yet surged alongside recent hikes, hitting 21.76% in Q3 2024.
APRs held steady in early 2024 as the Fed paused at 5.5%, but recent cuts have nudged rates down, offering modest relief to borrowers and supporting consumer spending.
Download Visual | Modify in YCharts
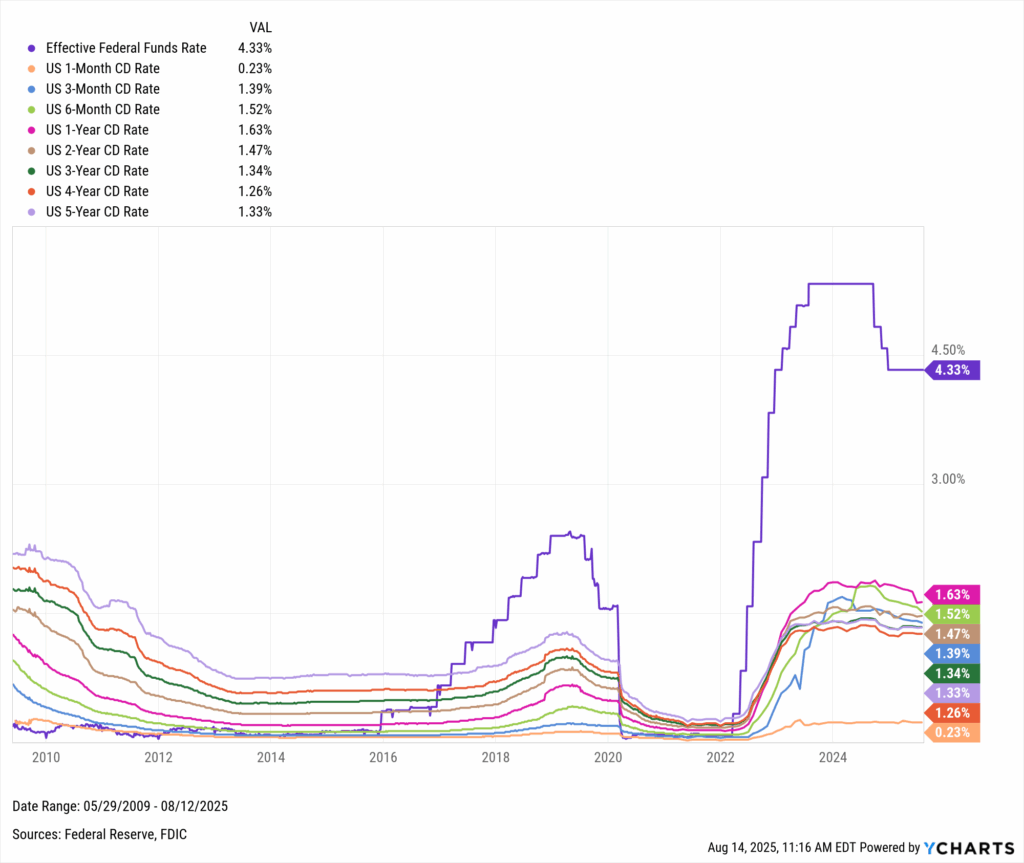
Savings Accounts & CDs
Rate cuts tend to hurt savers. When the Fed hikes, banks compete for deposits with higher yields on savings accounts and certificates of deposits (CDs). When rates fall, that incentive fades.
CD yields surged in the 2022–2023 hike cycle but have slipped since recent cuts. Further easing would likely push them lower, prompting savers to seek alternative investments with stronger return potential, especially those with longer time horizons or higher risk tolerance.
Download Visual | Modify in YCharts
How Stocks React to Fed Rate Cuts
Lower rates reduce borrowing costs, freeing capital for business expansion and fueling consumer spending, both of which are tailwinds for corporate earnings.
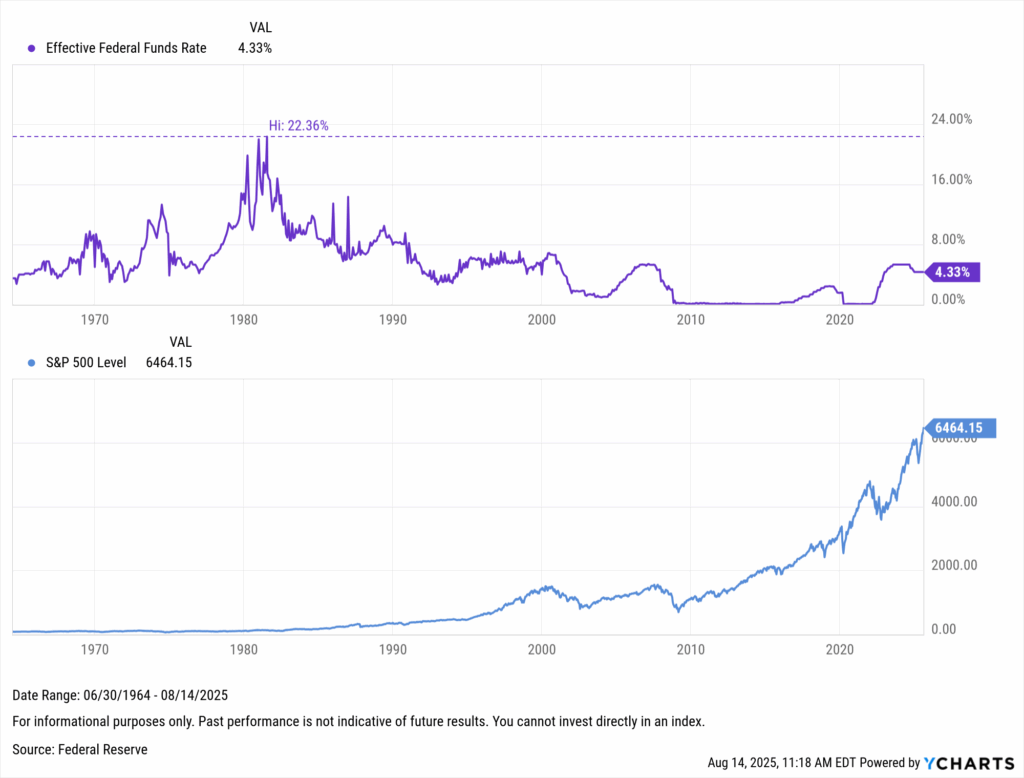
Equity markets have historically welcomed cuts. Since the Fed Funds Rate began falling from its 1981 peak, the S&P 500 has delivered a 9.27% annualized return, with many rallies kicking off in low-rate environments.
Download Visual | Modify in YCharts
A pause in rate hikes could help maintain or even boost current market momentum, offering opportunities for investors to capitalize on equities, and providing companies with more attractive financing options.
The S&P 500 popped 1.7% the day after the half-point rate cut announcement on September 18th, 2024, supporting a positive narrative on the impact of rate cuts for equities.
The longer-term impact for equities may be tied to whether the Federal Reserve can navigate a soft-landing for the economy, which has tended to benefit all asset classes, especially equities.
What Happened to Stocks in the Two Recent Rate Cut Cycles?
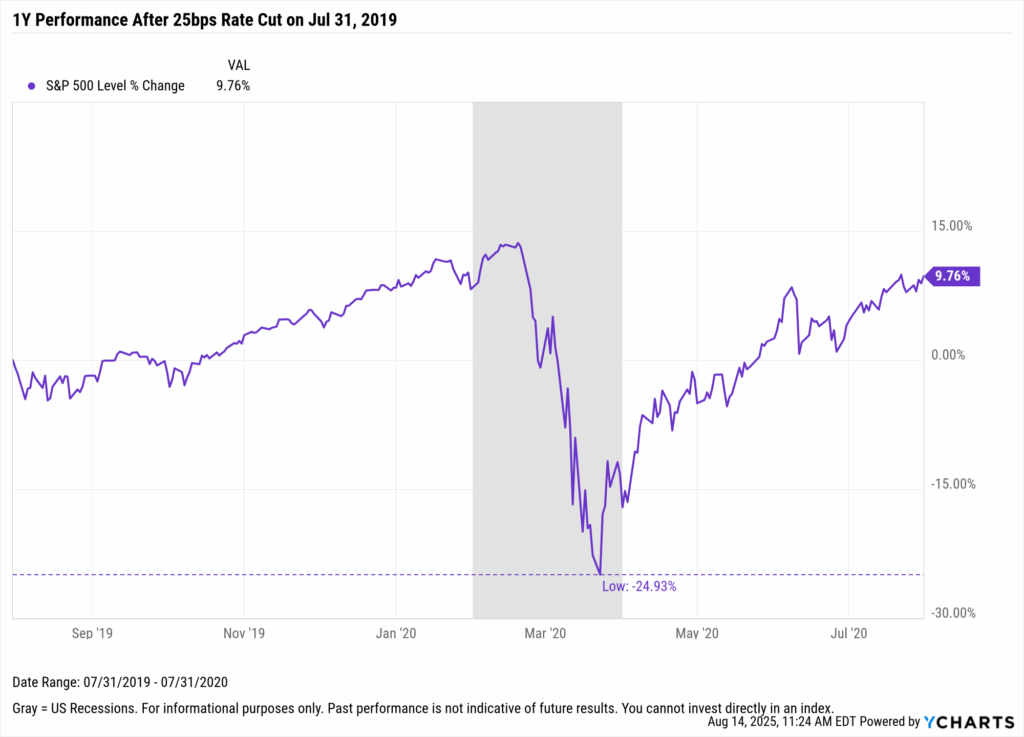
Both of the last two easing cycles saw major market shocks within a year of the first cut, yet stocks still posted strong gains.
In the one year following the 2019 cycle’s first rate cut on July 31, the S&P 500 sank nearly 25% at its lowest point during the COVID selloff but ultimately finished up 9.8%.
Download Visual | Modify in YCharts
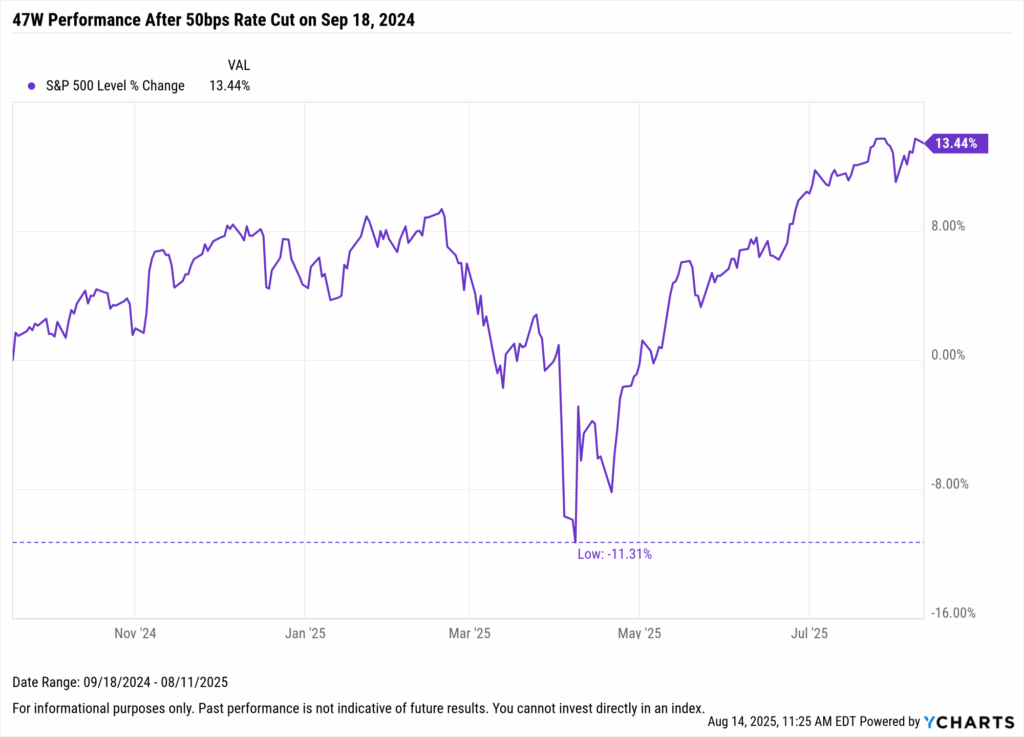
Fast forward September 18, 2024, where the Fed opened the next rate cut cycle with a 50 basis-point cut followed by two more that year. Stocks climbed early, dipped on tariff threats, then closed the near one-year period ending August 11th, 2025 with a 13.6% gain, supported by a stable Fed stance and no further hikes.
Download Visual | Modify in YCharts
Proactively Plan With Confidence
Rate cuts reshuffle the winners and losers across markets. Advisors who anticipate the shift and show clients the “why” behind their strategy turn volatility into opportunity. YCharts gives you the data, visuals, and tools to do it all in one place.
When rate cuts hit, will you be reacting or ready? See how YCharts can help you visualize the impact, adjust portfolios in real time, and keep client confidence high. Strong second halves start with smart midyear moves. Access our Midyear Planning Resources to uncover strategies, tools, and visuals that drive better client conversations.
The next rate cut is coming! See how YCharts can help you prepare:
Follow YCharts Social Media to Unlock More Content!
Disclaimer
©2025 YCharts, Inc. All Rights Reserved. YCharts, Inc. (“YCharts”) is not registered with the U.S. Securities and Exchange Commission (or with the securities regulatory authority or body of any state or any other jurisdiction) as an investment adviser, broker-dealer or in any other capacity, and does not purport to provide investment advice or make investment recommendations. This report has been generated through application of the analytical tools and data provided through ycharts.com and is intended solely to assist you or your investment or other adviser(s) in conducting investment research. You should not construe this report as an offer to buy or sell, as a solicitation of an offer to buy or sell, or as a recommendation to buy, sell, hold or trade, any security or other financial instrument. For further information regarding your use of this report, please go to: ycharts.com/about/disclosure.
Next Article
Advisor Technology ROI: Why Usage Drives Real ReturnsRead More →