Federal Reserve Easing: Long-term Treasury Purchases Update
The Federal Reserve’s long-term Treasury purchasing, often referred to as quantitative easing (QE), is a monetary policy tool used to stimulate the economy when traditional methods, such as lowering short-term interest rates, are insufficient.
Through QE, the Fed buys long-term Treasury securities to inject liquidity into the financial system, lower long-term interest rates, and encourage borrowing and investment. This approach aims to support economic growth, increase employment, and achieve the Fed’s inflation targets. Initiated during the financial crisis of 2008, these purchases have become a significant aspect of the Fed’s strategy to manage economic stability and mitigate downturns.
Treasury securities are grouped into three categories based on length of maturity. These are Treasury Bills (referred to as T-Bills), Treasury Notes, and Treasury Bonds.
The Federal Reserve Bank of Cleveland’s Credit Easing report is the source of long-term Treasury purchases data.
Latest Data Release
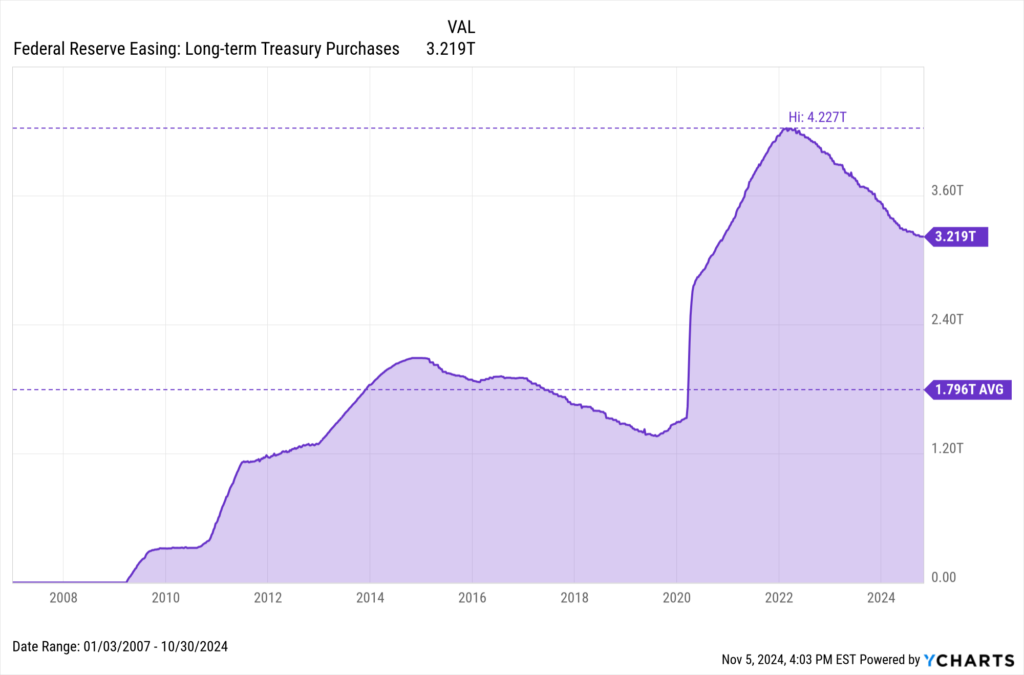
The Cleveland Fed released its latest weekly long-term Treasury purchases data on Friday, November 1st, 2024. Long-term Treasury Purchases are at a current level of $3.219T. The chart below shows the trend of long-term Treasury purchases over time.
Download Visual | Modify in YCharts
Analysis and Insights
Long-term Treasury purchases are unchanged from $3.219T last week but down from $3.636T one year ago, representing a -12.2% YoY change.
Long-term Treasury purchases peaked at $4.227T on February 23rd, 2022. Since then, the figure has steadily declined and is currently 23.8% below that all-time high. While long-term Treasury purchases are still above the long-term average of $1.796T, the downward trend in treasury purchases signifies a tapering of quantitative easing aligned with the Fed’s shift to a tighter monetary policy stance.
Historical long-term Treasury purchases data on YCharts spans back to 2007, providing a comprehensive view of how the Fed’s balance sheet has evolved over time. Users can create interactive charts to visualize trends and correlate them with other economic indicators. This can help in analyzing the impacts of monetary policy decisions on financial markets and the broader economy.
Access long-term Treasury purchases Data on YCharts by following these simple steps:
- Log on to YCharts.com.
- From anywhere on the platform, type “Federal Reserve Easing: Long-term Treasury purchases” into the search bar and click on the result.
- Once on the indicator page, users can toggle the navigation bar to browse historical data on a week-by-week basis or view data in an interactive chart.
Clicking “View Full Chart” will open data in an interactive Fundamental Chart to compare against other economic indicators, such as the target Federal Funds Rate. Additionally, users can export historical data to a CSV file for offline analysis by clicking the “Export” button.
Related Financial Indicators
YCharts’ Credit Easing Policy Tools report contains several additional related indicators to long-term Treasury purchases. Some of the indicators on YCharts can also be found on the Cleveland Fed’s Credit Easing report. The indicators on YCharts’ report include:
- Federal Agency Debt Securities Holdings
- Federal Agency Mortgage-backed Securities Holdings
- Federal Agency Debt Securities Holdings
- Traditional Security Holdings
- Lending to Financial Institutions
- Provided Liquidity to Key Credit Market
- Target Upper Limit Federal Funds Rate
- Effective Federal Funds Rate
- Treasury Bills
- Treasury Notes
- Treasury Bonds
Implications for Investors and Policymakers
Changes in long-term Treasury purchases by the Federal Reserve have significant impacts on various investment strategies and policy decisions. Here’s an analysis of how these changes affect different areas:
Investment Strategies
- Bond Market Investments
- Price and Yield Movements: When the Federal Reserve increases its purchases of long-term Treasuries, it drives up the prices of these securities, leading to lower yields. This impacts bond investors who may seek higher returns by shifting to corporate bonds or other higher-yield securities.
- Portfolio Rebalancing: Investors might rebalance their portfolios towards riskier assets, such as stocks or high-yield bonds, to achieve desired returns. This shift can be seen as a move towards equities and away from fixed-income securities, altering the risk profile of portfolios.
- Stock Market
- Increased Liquidity: The liquidity injected into the market through these purchases can lead to higher stock prices as investors search for higher returns in equities. This can result in a “wealth effect,” where increased asset prices boost consumer confidence and spending.
- Valuation Impacts: Lower long-term yields reduce the discount rate used in equity valuation models, often leading to higher stock valuations. This can create more favorable conditions for equity investments, potentially driving up stock prices further.
- Real Estate
- Lower Mortgage Rates: By reducing long-term interest rates, the Fed’s Treasury purchases can lead to lower mortgage rates, which stimulate housing demand and increase property values. This impacts investment strategies in real estate, making it a more attractive asset class.
- REITs Performance: Real Estate Investment Trusts (REITs) may benefit from lower financing costs and increased property values, making them more appealing to income-focused investors.
Policy Decisions
- Monetary Policy
- Accommodative Stance: The Fed’s long-term Treasury purchases signal a commitment to an accommodative monetary policy. This influences other central banks’ policies as they might adopt similar measures to prevent currency appreciation and support their economies.
- Inflation Management: By lowering long-term rates, the Fed aims to boost economic activity and counter deflationary pressures. Policymakers must balance these actions with the risk of future inflation, influencing decisions on interest rates and forward guidance.
- Fiscal Policy
- Government Borrowing Costs: Lower long-term interest rates reduce the government’s borrowing costs, potentially encouraging increased fiscal spending and investment in infrastructure and other public goods. This can support economic growth but also impacts fiscal policy decisions regarding deficit and debt management.
- Government Borrowing Costs: Lower long-term interest rates reduce the government’s borrowing costs, potentially encouraging increased fiscal spending and investment in infrastructure and other public goods. This can support economic growth but also impacts fiscal policy decisions regarding deficit and debt management.
- Financial Stability
- Market Stability and Risk: Prolonged low-interest rates can lead to excessive risk-taking and asset bubbles. Policymakers must monitor financial stability risks and may implement macroprudential measures to mitigate these risks, such as stricter lending standards or increased capital requirements for banks.
Changes in the Federal Reserve’s long-term Treasury purchases influence investment strategies by affecting asset prices, yields, and market liquidity. They also play a crucial role in shaping both monetary and fiscal policy decisions, with broader implications for economic stability and growth.
YCharts Feature Highlights
Fundamental Charts
Visualize the Fed’s purchasing activity of long-term Treasuries over time by building a Fundamental Chart. Additional economic indicators, securities, funds, and indices can be added for an enhanced visual comparison. Emphasize critical junctures with interactive annotations, static Min, Max, and Average annotation lines, as well as aesthetic modifications such as custom colors or an Area Chart.
Timeseries Analysis
Import the long-term Treasury purchases indicator into Timeseries Analysis to conduct a thorough historical lookback across custom frequency periods. Data can be exported into CSV format for analysis in YCharts’ Excel Add-in or as a standalone file.
Comp Tables
Select the long-term Treasury purchases indicator in Comp Tables along with additional indicators to compare movements over time, spot trends, and make informed investment decisions. Results can be exported to a CSV file or even a printable PDF for convenient, single-page analysis.
Conclusion
The Federal Reserve’s long-term Treasury purchases are a key component of its monetary policy, aimed at fostering healthy economic conditions by managing interest rates and liquidity in the financial system. Available on YCharts.com, this indicator offers valuable insights into the scale and direction of these purchases, serving as an important tool for economists, analysts, and policymakers.
The Cleveland Fed’s analysis underscores the importance of long-term Treasury purchases in the Federal Reserve’s toolkit and their role in promoting economic recovery and stability. For more detailed information regarding Federal Reserve Easing indicators, you can visit the Cleveland Fed’s official website.
To arm yourself with YCharts’ extensive library of economic indicators, charting software, and analysis tools, get in touch for a personalized information session or start a free trial.
Whenever you’re ready, there are 3 ways YCharts can help you:
1. Looking to better communicate the importance of economic events to clients?
Send us an email at hello@ycharts.com or call (866) 965-7552. You’ll be directly in touch with one of our Chicago-based team members.
2. Want to test out YCharts for free?
Start a no-risk 7-Day Free Trial.
3. Download a copy of the Quarterly Economic Update slide deck:
Disclaimer
©2024 YCharts, Inc. All Rights Reserved. YCharts, Inc. (“YCharts”) is not registered with the U.S. Securities and Exchange Commission (or with the securities regulatory authority or body of any state or any other jurisdiction) as an investment adviser, broker-dealer or in any other capacity, and does not purport to provide investment advice or make investment recommendations. This report has been generated through application of the analytical tools and data provided through ycharts.com and is intended solely to assist you or your investment or other adviser(s) in conducting investment research. You should not construe this report as an offer to buy or sell, as a solicitation of an offer to buy or sell, or as a recommendation to buy, sell, hold or trade, any security or other financial instrument. For further information regarding your use of this report, please go to: ycharts.com/about/disclosure
Next Article
A Closer Look at Q3 2024 Fund Flows: Key Trends in Active ETFs and ETF LaunchesRead More →