Financial Plan vs. Investment Plan: Why Illustrating the “How” is the Key to Organic Growth

The advisory profession has steadily shifted from an investment-first model to one that prioritizes comprehensive financial planning. According to Orion’s 2025 Investor Survey, more than 80% of investors now have a financial plan they review annually with their advisor.
While financial planning explains why money matters and the importance of setting goals, the investment plan shows how those goals will be achieved.
In Orion’s survey, two-thirds of investors say “beating the market” is a key reason they work with an advisor, with Millennials rating it “extremely important” nearly twice as often as Boomers.
This suggests that the next generation of clients, from whom most of the growth in the advisory business will come, will require attention to investment planning.
Moving forward, the most successful firms will connect financial and investment planning. The ability to clearly illustrate the how will not only build client trust but also become a key driver of advisor growth.
Financial Plan vs. Investment Plan
The Financial Plan: The “Why”
- Defines purpose. It covers retirement readiness, taxes, estate planning, and insurance—providing clarity and peace of mind.
The Investment Plan: The “How”
- It defines asset allocation, benchmarks performance, and aligns portfolios with client goals. According to Orion, when meeting with their advisor, investors often want to discuss market conditions, new opportunities, and portfolio performance—all elements of the investment plan.
And this is where proposals become essential. A well-built proposal translates the investment plan into something clients can see, understand, and react to.
Instead of abstract models or jargon, proposals package allocations, scenarios, and performance expectations into a clear story that connects directly back to the client’s financial plan. By making the “how” tangible, proposals build trust, strengthen relationships, and create more opportunities for growth.
The Proposal Gap
Despite the importance of proposals, adoption is surprisingly low.
The 2025 Kitces Report found that only 29% of broker-dealers and 11% of RIA-only firms currently use proposal software. What makes this striking is that advisors rated proposal generation 7.8/10 in importance, signaling strong demand but frustration with tools that don’t fit seamlessly into workflows.
According to Kitces, key frictions include:
- Sales Enablement Gap – Many advisors built practices “one meeting at a time” and never adopted formal proposal workflows.
- Planning-Centric Shift – With planning in the spotlight, proposals are often delivered only after onboarding—limiting their effectiveness as a growth tool.
- Workflow Silos – Statement extraction, portfolio modeling, and proposal delivery are rarely integrated into one platform. (Spoiler: YCharts puts them together.)
- Pricing vs. Volume – With most advisors adding only 3-6 new clients annually, standalone tools feel too costly.
The research shows that proposals must be workflow-integrated and embedded into broader advisor platforms, not siloed solutions.
Interested in learning more about YCharts Proposals?YCharts Proposals: Illustrating the “How”
Financial planning sets the foundation, but clients—especially Millennials and Gen Z—want to see how their goals will be achieved.
YCharts Proposals make that connection possible by turning abstract strategies into compelling, visual stories that help advisors win new business and reinforce their value:
- Illustrate the “How” – Translate allocations, risk profiles, and performance metrics into clear, client-ready narratives demonstrating how portfolios achieve goals.
- Engage Next-Gen Clients – Deliver investment conversations in a modern, visually-appealing, and data-driven format that resonates with performance-conscious, younger investors.
- Reinforce Value Over Time – Reuse proposals in quarterly reviews and client check-ins, giving advisors a consistent framework to highlight progress and strengthen relationships.
- Integrate Seamlessly – Conduct research, monitor models, and run stress tests with the tools advisors already love in YCharts. At the same time, integrations with eMoney, Schwab, Orion, Redtail, Black Diamond, Addepar, and others link proposals to financial plans and client holdings.
By making the investment plan tangible and tied to financial goals, YCharts Proposals help advisors win new households, deepen existing relationships, and create repeatable engagement that fuels organic growth.
See How Alan Doubled His Business Using YCharts Proposals
Interested in learning more about YCharts Proposals?Why Organic Growth Matters for RIA Valuation
Strong RIA business models balance profitability with growth.
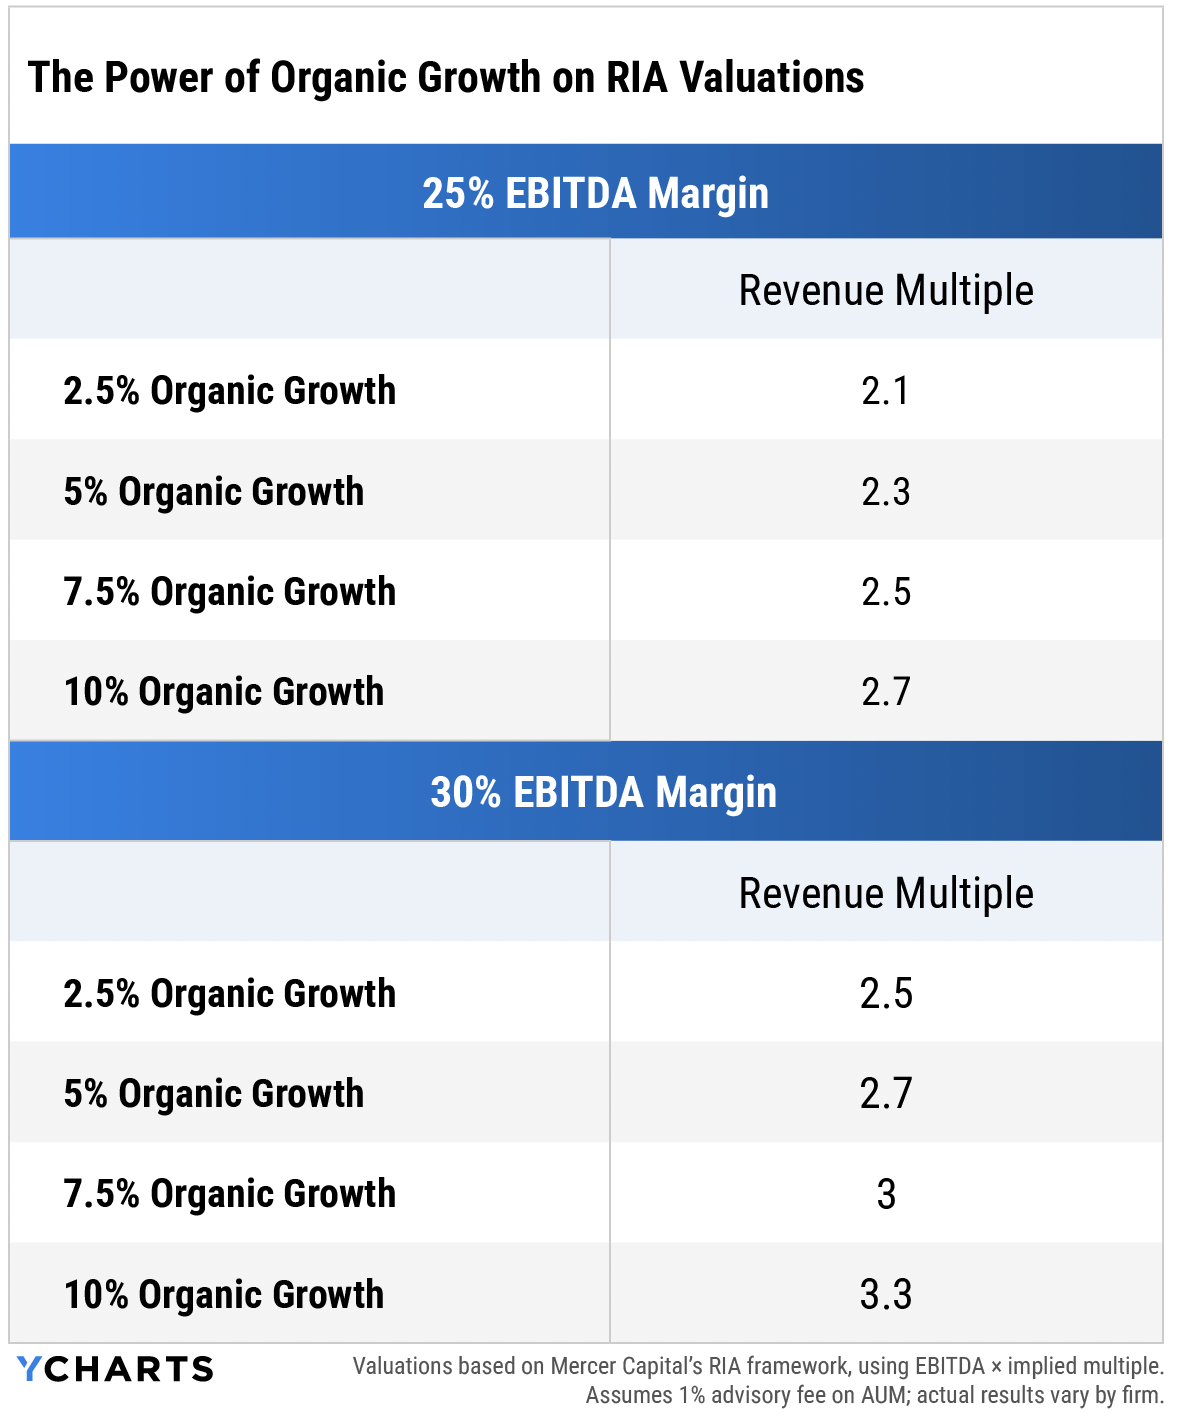
In SaaS, investors look for a combined “Rule of 40” score (growth + margin ≥ 40%). While not a perfect comparison, RIAs that hit 30-40% combined growth and margin typically represent durable, scalable businesses. Mercer Capital shows how this balance translates directly into valuations. Even modest improvements in organic growth drive significant valuation gains.
Lisa Salvi, Managing Director at Schwab Advisor Services, reinforced this in her 2025 Outlook, noting that organic growth will be the top metric RIAs focus on. She stated, “Firms that want to get a high valuation should absolutely look at their organic growth rate.”
As Mercer’s framework shows, moving from 2.5% to 10% organic growth can lift revenue multiples from 2.1x to 2.7x at 25% margins, or from 2.5x to 3.3x at 30% margins, adding tens of millions in valuation. That’s why RIAs are sharpening their focus on growth levers and turning to tools like YCharts that help power them.
Technology Premium: Why Modern Platforms Command Higher Multiples
Growth is critical, but so is technology adoption.
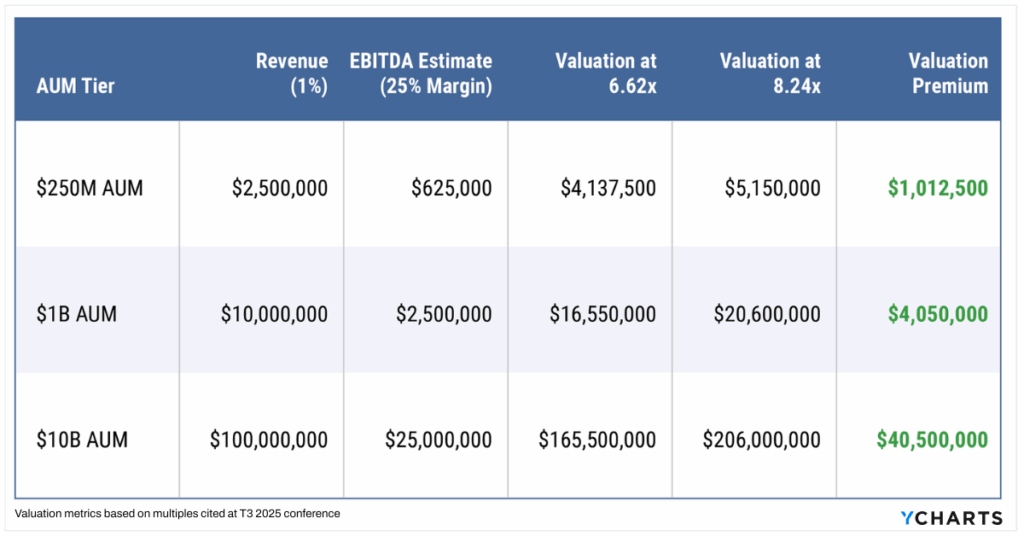
At the 2025 T3 Conference, Craig Iskowitz from Ezra Group reported that tech-forward RIAs command an 8.24x EBITDA multiple vs. 6.62x for traditional peers. That premium translates into millions—or even tens of millions—in valuation upside.
Why the premium?
Modern platforms signal scalability, standardization, and operational readiness—qualities acquirers prize.
The Winning Formula for Enterprise RIAs
For growing enterprise RIAs, the biggest challenge isn’t crafting strong financial and investment plans—it’s ensuring every advisor in the organization can communicate them consistently, compliantly, and compellingly to clients.
Organic growth at scale depends on giving hundreds of advisors the tools (they actually use) to deliver proposals that win new households, deepen existing client relationships, and reinforce value in every review.
That’s where YCharts Proposals provide an enterprise advantage:
- Centralized Consistency – Standardize proposal quality and messaging across all offices.
- Advisor Empowerment – Give advisors a client-ready tool that makes investment conversations sharper and more engaging.
- Growth at Scale – Multiply organic growth by turning every advisor-client meeting into a potential new mandate or deeper relationship.
- Valuation Impact – Stronger organic growth and modern tech adoption directly lift firm valuation multiples, as Mercer Capital and T3 data show.
The connection between financial and investment planning remains critical, but at the enterprise level, the differentiator is scale.
YCharts Proposals help large RIAs unlock the full growth potential of their advisor base by embedding proposal generation into everyday workflows.
See How Carson Group Unified 150+ Offices with a Scalable Platform
By connecting financial planning with investment planning and making the “how” clear, proposals become the catalyst for advisor growth and client trust.
For enterprise RIAs, YCharts Proposals scale that impact across every office, unlocking the organic growth that drives both stronger client relationships and higher firm valuations.
Whenever you’re ready, here’s how YCharts can help you:
1. Curious how YCharts Proposals fit into your practice?
Our team is happy to show you how YCharts Proposals facilitate organic growth.2. Interested in how other advisors are growing with YCharts?
Read Alan Cohen’s success story to see how proposals helped double his business.
3. Ready to try YCharts for yourself?
Start a no-risk 7-day free trial.
Disclaimer
©2025 YCharts, Inc. All Rights Reserved. YCharts, Inc. (“YCharts”) is not registered with the U.S. Securities and Exchange Commission (or with the securities regulatory authority or body of any state or any other jurisdiction) as an investment adviser, broker-dealer or in any other capacity, and does not purport to provide investment advice or make investment recommendations. This report has been generated through application of the analytical tools and data provided through ycharts.com and is intended solely to assist you or your investment or other adviser(s) in conducting investment research. You should not construe this report as an offer to buy or sell, as a solicitation of an offer to buy or sell, or as a recommendation to buy, sell, hold or trade, any security or other financial instrument. For further information regarding your use of this report, please go to: ycharts.com/about/disclosure
Next Article
5 Ways Advisors Allocated to Bond Funds Ahead of Rate CutsRead More →