How Do Asset Classes Perform When Price Stability is Sustained?
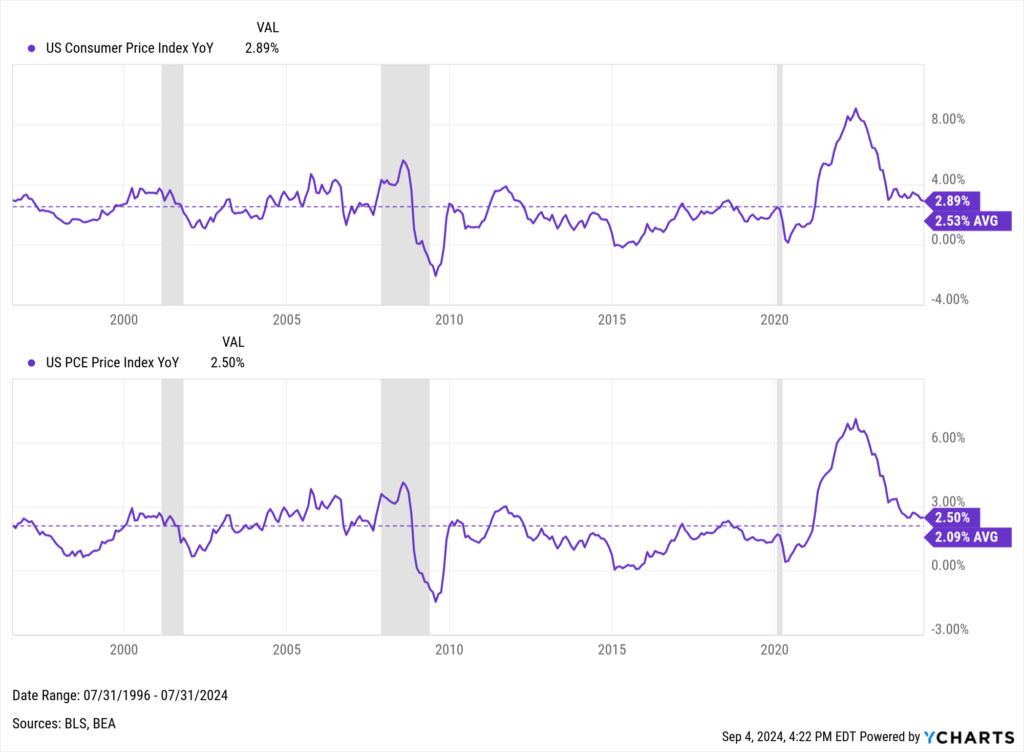
Following July’s 2.89% CPI reading and Federal Reserve Chair Jerome Powell’s comments at Jackson Hole, many investors anticipate that Powell will announce an interest rate cut of either 25 or 50 basis points at the upcoming FOMC meeting on Wednesday.
This will essentially mark the end of the Federal Reserve’s bout with inflation, as we are seemingly well on our way to the 2% inflation target that the Fed set when it began raising rates in 2022.
The Federal Reserve targets a Personal Consumption Expenditures (PCE) inflation range of 1.5% to 2.5% (2% target “midpoint”). In our analysis, we observed an approximate difference of 0.4 percentage points between the average Consumer Price Index (CPI) and the PCE.
Download Visual | Modify in YCharts
The Federal Reserve’s formal adoption of a 2% inflation target was outlined in January 2012’s “Statement on Longer-Run Goals and Monetary Policy Strategy,” which marked the resolution of debates surrounding a target inflation rate that stretch back to the mid-1990s.
Internally, the Fed has roughly used this 2% marker since July 1996 to define periods when the 12-month average inflation was within the desired range. As such, we exported CPI data from YCharts from July 31, 1996, to the present.
We then calculated the forward 12-month average CPI for each data point, identifying periods where the CPI fell within the 1.9% to 2.9% range (equating to the 1.5%-2.5% PCE target range as noted above).
To ensure that our analysis provided timely takeaways, we then identified two-month “transition” periods in which the first month’s CPI exceeded 2.9% and the subsequent month’s CPI dropped below this threshold. We then confirmed that the subsequent 12-month average CPI remained within our target range.
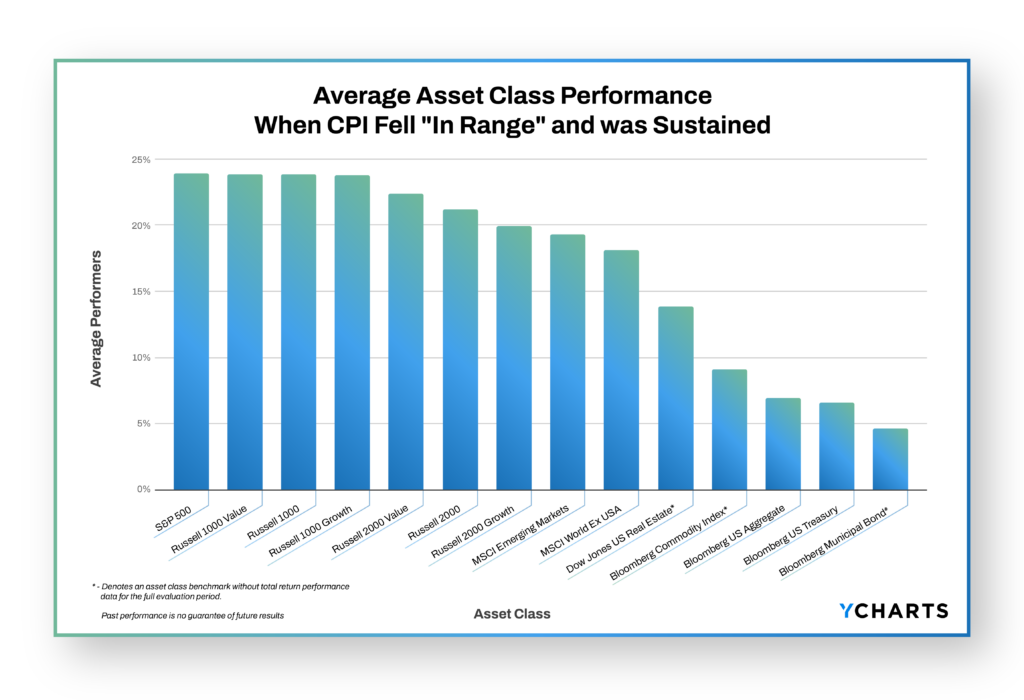
This process highlighted six instances where the CPI initially exceeded 2.9%, then fell within the designated range, and maintained an average within this range for the following 12 months.
During these instances, the S&P 500 boasted the highest average return at 23.88%, closely followed by large-cap value stocks at 23.85%. The Russell 1000 rounded out the top three with returns of 23.82%, with large-cap growth stocks not far behind, delivering an average return of 23.8%. Please note that performance was not available for all asset classes for the full evaluation period. See note at end of the article for asset class coverage periods.
Download Visual | Comp Table in YCharts
Below, we took a closer look at asset class performance during two of these periods: the most recent instance from August 2018 to July 2019 and from September 2006 to August 2007, when the Federal interest rate was at a level similar to today’s.
If you’re interested in our full analysis of asset class performance, sign up to receive our latest research, “Which Asset Classes Perform Best As Inflation is Driven Lower.“
Get your copy of “Which Asset Classes Perform Best As Inflation is Driven Lower” here:“In Range” Period Analysis: August 2018 – July 2019
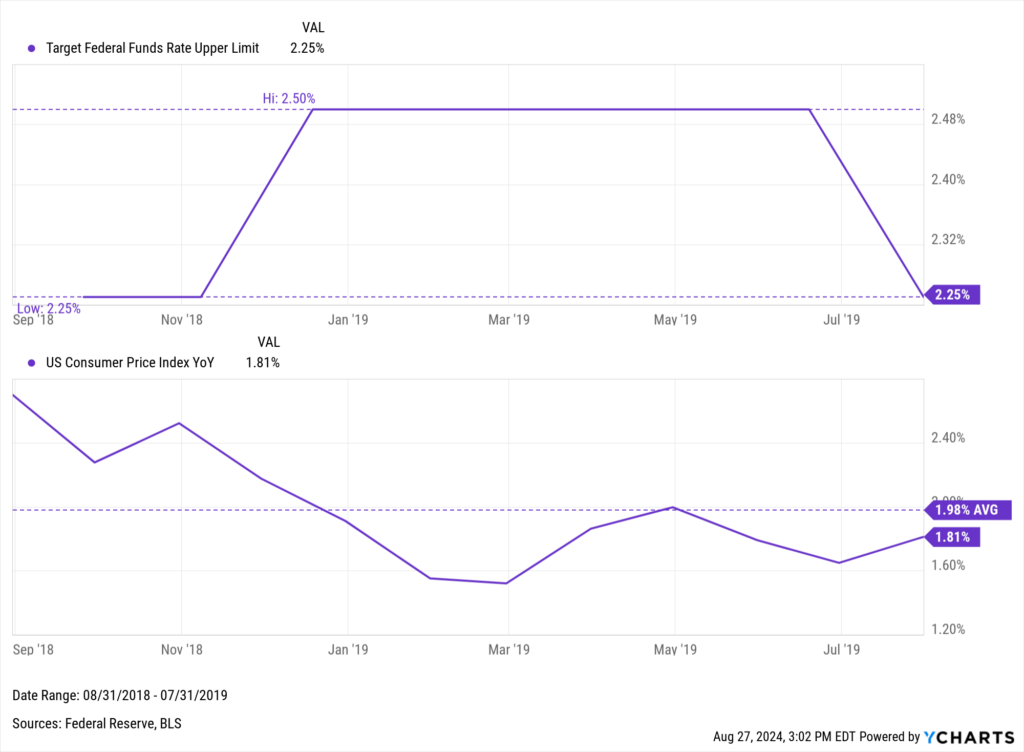
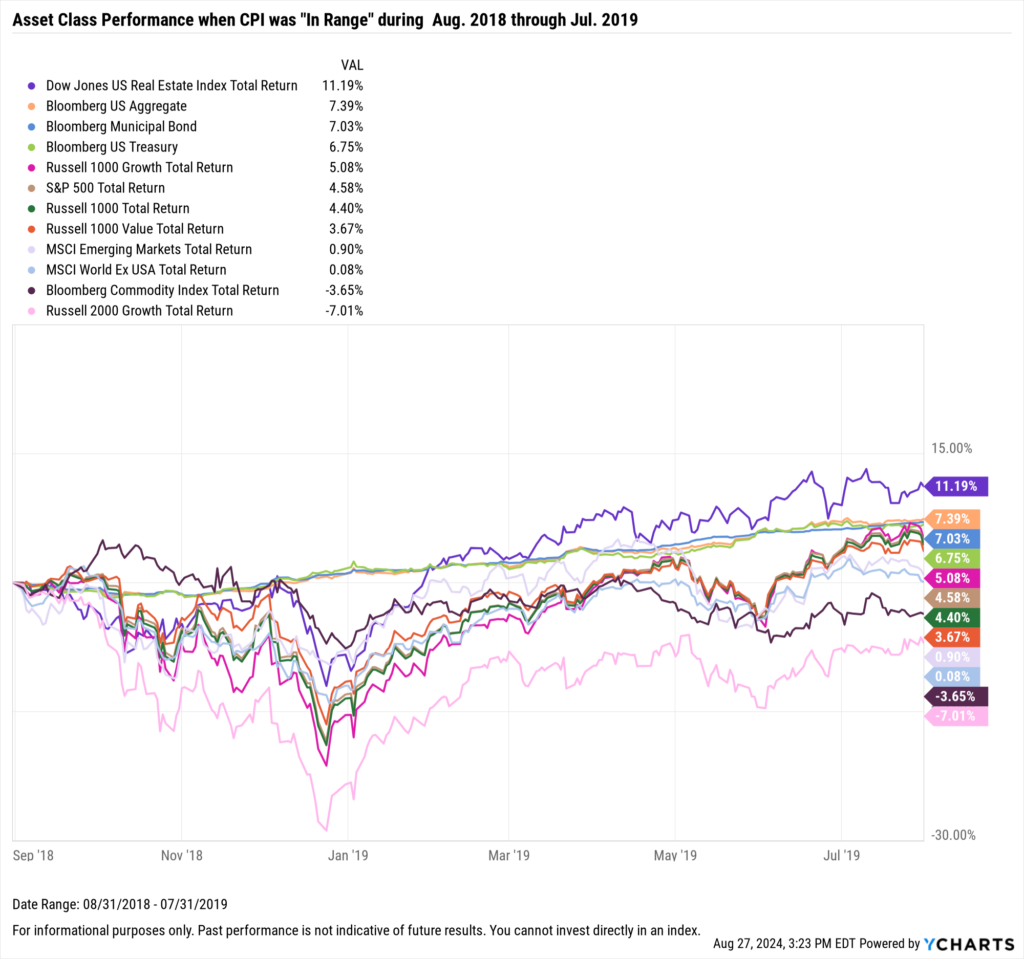
The most recent instance of inflation decreasing from above 2.9% to stabilizing within the 1.9-2.9% range for at least 12 months occurred from August 2018 to July 2019. During this time, the year-over-year CPI was recorded at 2.95% in July 2018 and dropped to 2.7% in August, with the average CPI over the following 12 months settling at 1.98%.
Concurrently, the Federal Reserve raised the upper interest rate limit by a quarter point from 2.25% to 2.50% in December 2018 and later reduced it back to 2.25% six months later in June 2019.
Download Visual | Modify in YCharts
During this period, diversification into non-equity assets, aside from commodities, yielded the highest returns. Real Estate emerged as the top performer with an 11.2% gain. Fixed income assets also saw substantial returns: the Bloomberg US Aggregate delivered 7.4% returns, municipal bonds returned 7%, and US Treasuries provided a 6.8% return. Meanwhile, only the Russell 1000 Growth produced returns greater than 5% on the equity side.
This varied performance underscores the advantage of diversification in a portfolio.
Download Visual | Modify in YCharts
“In Range” Period Analysis: September 2006 – August 2007
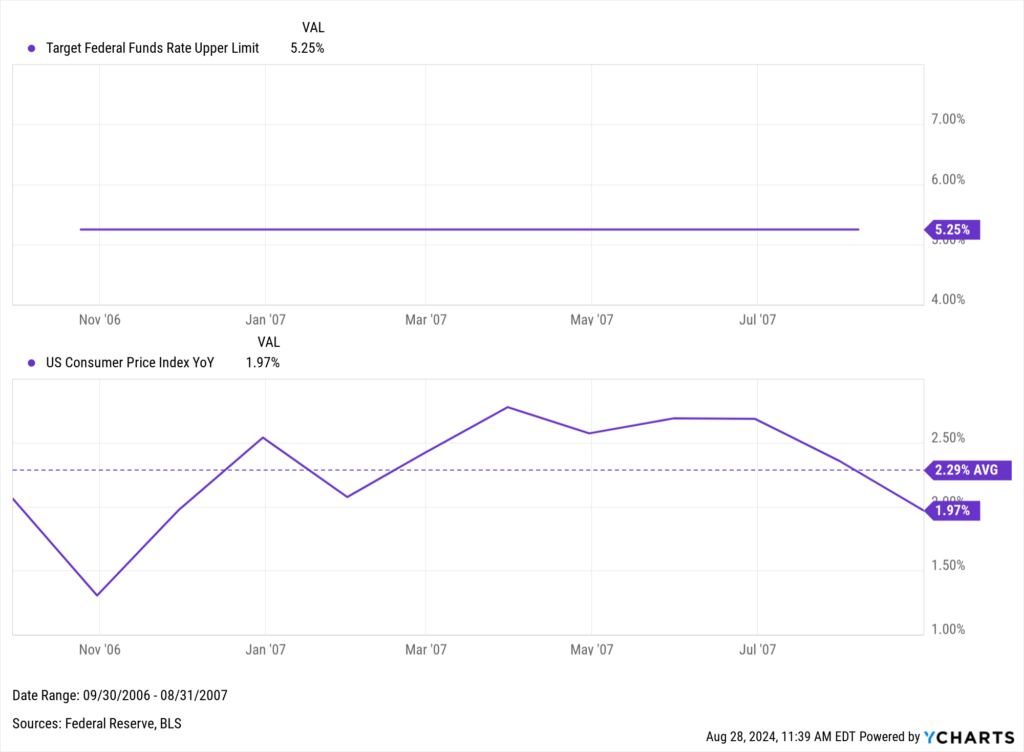
Throughout 2004 and 2005, the Federal Reserve implemented a series of rate hikes, culminating in a peak Federal Funds rate of 5.25% that was maintained during our evaluation period from September 2006 to August 2007.
August 2007 marked the culmination of this hawkish monetary stance, as the Fed began a rate-cutting cycle the following month. This shift was in response to growing concerns about the economic impact of tightening credit conditions, particularly on the housing market. The Fed’s statement at the time highlighted these challenges: “The tightening of credit conditions has the potential to intensify the housing correction and to restrain economic growth more generally. Today’s action is intended to help forestall some of the adverse effects on the broader economy…”
That 5.25% level would stand as the highest Federal Funds rate for nearly 16 years until the more recent rate hike cycle pushed rates to 5.5%.
Backing up to the beginning of the observation period, in September 2006, the CPI significantly decreased to 2.06%, down sharply from 3.82% the previous month. Over the subsequent 12-month period, the CPI averaged 2.29%, as prices were stable, but economic reckoning was around the corner.
Download Visual | Modify in YCharts
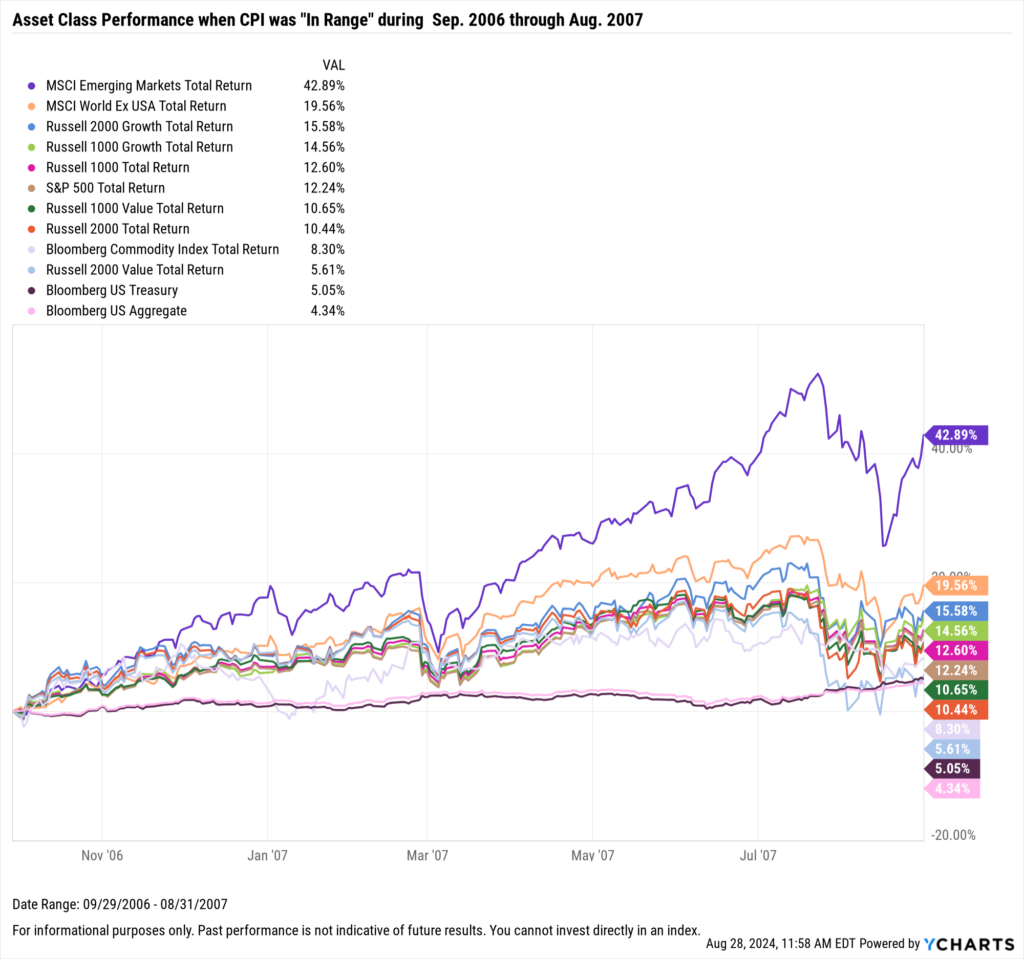
From September 2006 through August 2007, Emerging Market equities significantly outperformed other asset classes, delivering a total return of 42.9%. The MSCI World Ex USA also showed strong performance, with a 19.6% total return, further highlighting the gains from the international markets during this time.
Within the U.S., the Russell 2000 Growth and Russell 1000 Growth indices demonstrated solid returns of 15.6% and 14.6%, respectively, showcasing the appeal of growth-oriented equities across market caps during this timeframe.
In contrast, the Russell 1000 Value and Russell 2000 Value indices posted more moderate gains of 10.7% and 5.6%, respectively, both underperforming the S&P 500, which delivered a 12.2% return. Moreover, the Bloomberg Commodity Index and U.S. Treasuries offered modest returns in the non-equity asset classes.
Download Visual | Modify in YCharts
Interested in more insights on inflation and asset class performance during the other four disinflationary cycles? Pre-save YCharts’ upcoming white paper on the topic, and get it sent to your inbox on Monday, September 16th.
Note on performance periods – certain asset class benchmarks did not have total return performance data available for the full evaluation period. Those without a full performance record are noted below, with the earliest available performance date listed and the “In Range periods” they were excluded from:
Dow Jones US Real Estate Index TR: 08/02/10 (Periods: Aug ‘96-July ‘97, Mar ‘97-Feb ‘98, Apr ‘03 – Mar’04, Sept ‘06 – Aug ‘07)
Bloomberg Commodity Index TR: 08/20/01 (Periods: Aug ‘96-July ‘97, Mar ‘97-Feb ‘98)
Bloomberg Municipal Bond Index TR: 12/11/00 (Periods: Aug ‘96-July ‘97, Mar ‘97-Feb ‘98)
Whenever you’re ready, there are 3 ways YCharts can help you:
1. Looking to better communicate the importance of economic events to clients?
Send us an email at hello@ycharts.com or call (866) 965-7552. You’ll be directly in touch with one of our Chicago-based team members.
2. Want to test out YCharts for free?
Start a no-risk 7-Day Free Trial.
3. Sign up to receive a copy of our latest research, “Which Asset Classes Perform Best As Inflation is Driven Lower.”
Disclaimer
©2024 YCharts, Inc. All Rights Reserved. YCharts, Inc. (“YCharts”) is not registered with the U.S. Securities and Exchange Commission (or with the securities regulatory authority or body of any state or any other jurisdiction) as an investment adviser, broker-dealer or in any other capacity, and does not purport to provide investment advice or make investment recommendations. This report has been generated through application of the analytical tools and data provided through ycharts.com and is intended solely to assist you or your investment or other adviser(s) in conducting investment research. You should not construe this report as an offer to buy or sell, as a solicitation of an offer to buy or sell, or as a recommendation to buy, sell, hold or trade, any security or other financial instrument. For further information regarding your use of this report, please go to: ycharts.com/about/disclosure
Next Article
Monthly Market Wrap: August 2024Read More →