How to Build Tax-Efficient Investment Strategies for 2024
Investment strategy maintenance is a year-round practice for advisors. The testing of tax-efficient strategies also requires continuous attention, especially as the calendar flips to another year when advisors prepare to make strategic tax decisions on behalf of their clients.
YCharts’ latest guide, How Advisors Use YCharts to Save Clients Money on Taxes, helps advisors save time searching for tax-efficient investments, incorporate them into model strategies, and effectively present strategies to prospects.
Download the Guide for more tips:Illustrate Long-Term Impacts of Tax Burdens with Scenarios
Without the right tools, finding tax-efficient investments can be time-intensive. YCharts can help simplify your search and quickly find tax-efficient securities in three ways:
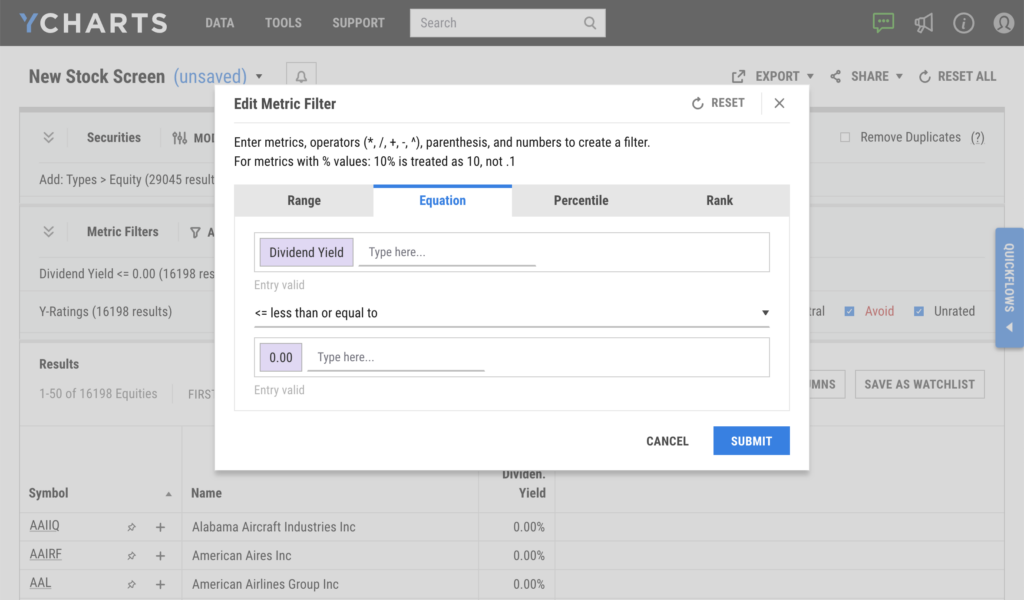
Screen for Securities that Limit Distributions
The Stock and Fund Screeners filter out income-generating securities from your search criteria with ease. Setting the Dividend Yield or Distribution Yield metric to 0% narrows YCharts’ universe of nearly 30,000 stocks and 80,000 funds to a shortlist of securities that don’t pay dividends or issue distributions.
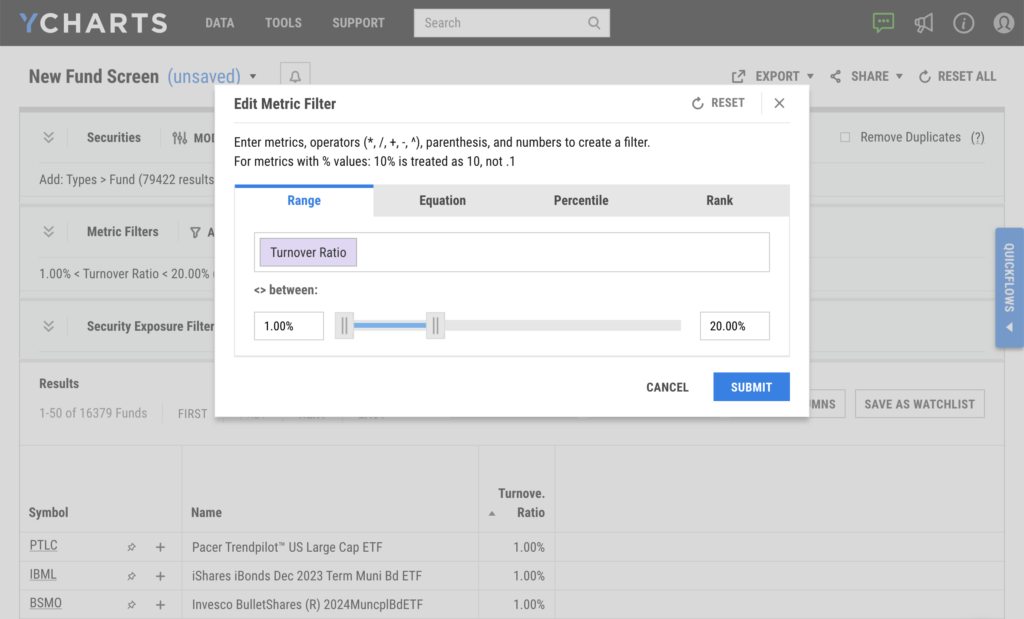
Screen for Funds with Low Turnover Ratio
Funds with lower Turnover Ratios have engaged in less selling activity, limiting the taxable distributions they generate each year. Simply choose a range or set a maximum value to see the specific funds that meet your criteria.
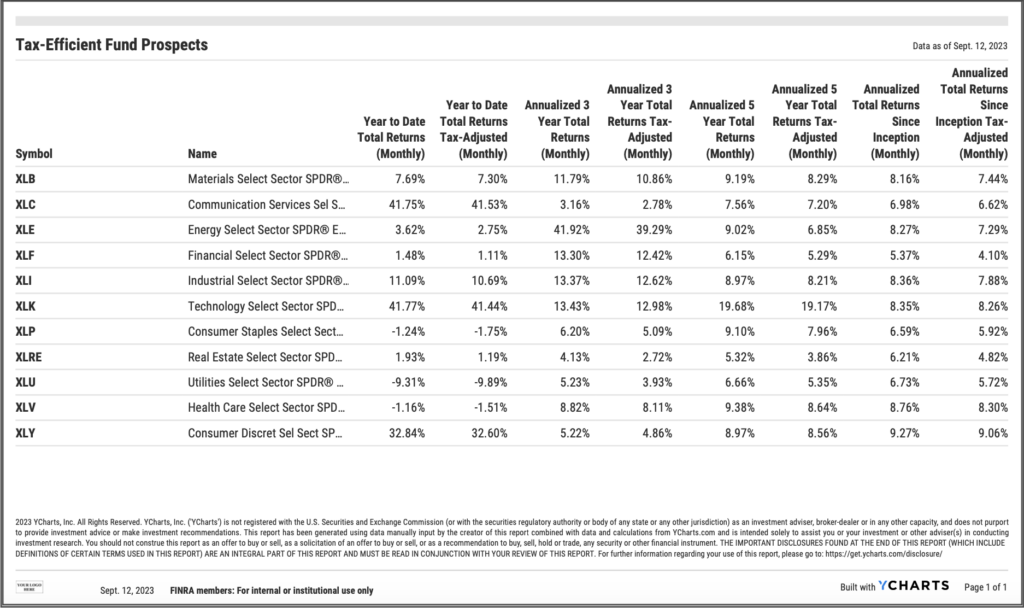
Evaluate funds based on their Tax-Adjusted Total Returns
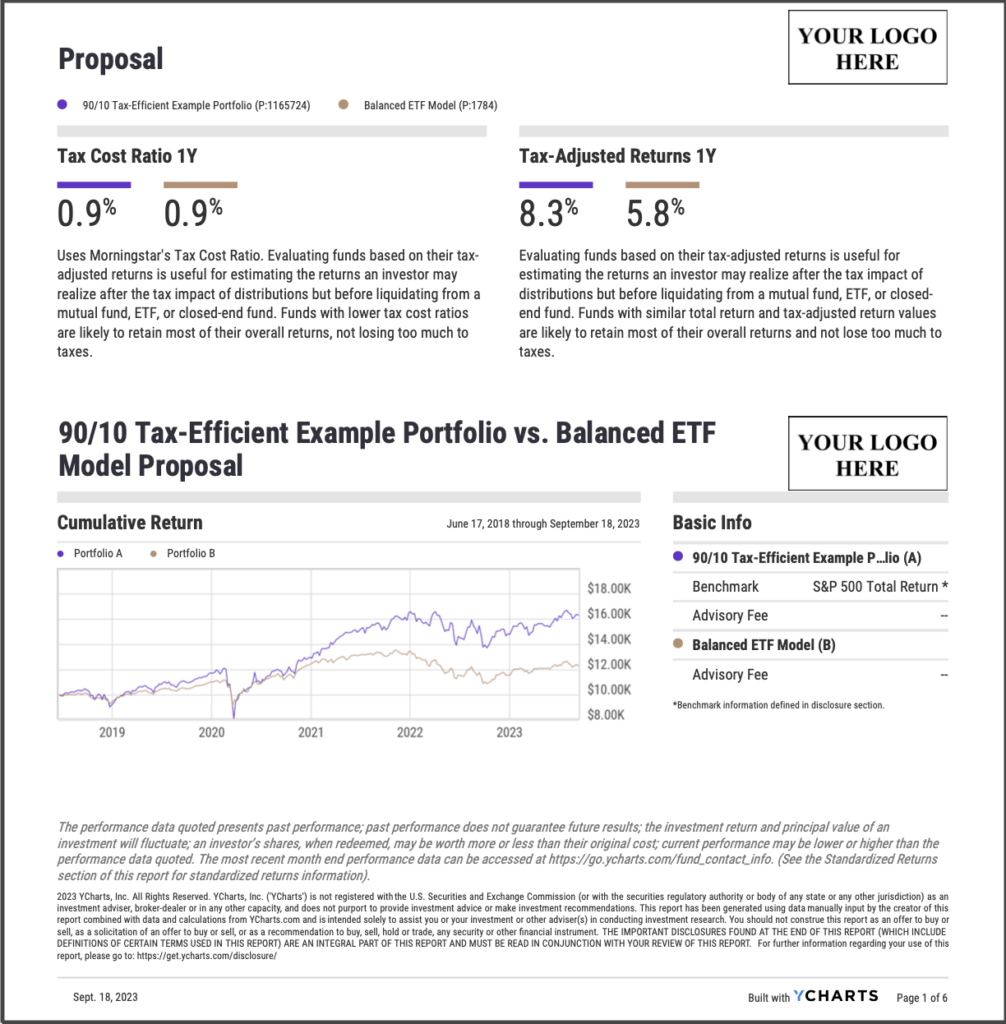
The Tax-Adjusted Total Returns metric is useful for estimating the returns an investor may realize after the tax impact of distributions but before liquidating from a mutual fund, ETF, or closed-end fund. Funds with similar total return and tax-adjusted return values are likely to have a limited tax burden.
Tax-adjusted returns data, including Tax Cost Ratio, can be quickly brought into a single Comp Table for one-stop analysis. Comp Tables can be exported to PDFs, perfect for analyzing funds’ tax-adjusted performance with clients, prospects, or other advisors on a printable page.
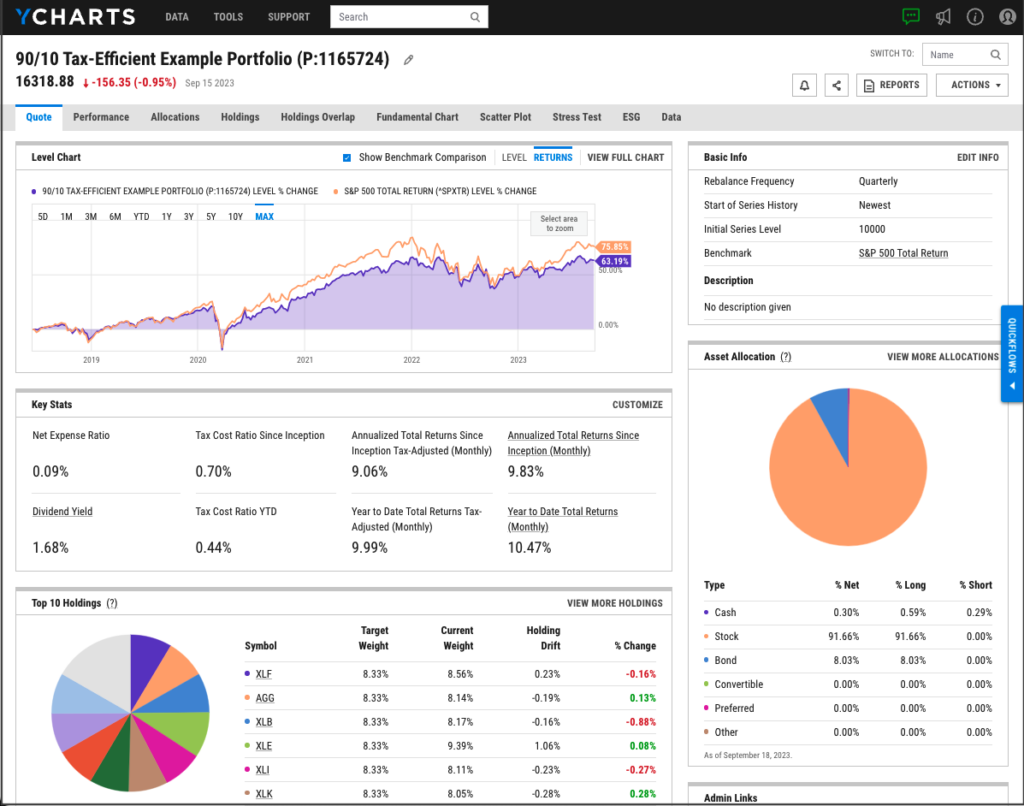
Construct and Present Tax-Efficient Strategies
Pull those newly-discovered securities into Model Portfolios, a tool capable of building model strategies with dozens of holdings and custom weights of your choosing.
A model portfolio’s full breakdown is available on its quote page, including key stats such as total returns, tax-adjusted returns, expense ratio, and tax-cost ratio. Any model portfolio can be compared head-to-head against another portfolio or benchmark.
Finally, Report Builder ties it all together for clients and prospects. With an intuitive drag-and-drop interface, Report Builder allows you to construct stunning, customized PDF reports covering all relevant information for a security or portfolio. Reports can include your firm’s logo, custom color scheme, and custom disclosures.
The Proposals module lets you convert financial metrics, such as tax-cost ratio and tax-adjusted returns, into customizable Talking Points that form an overall proposal to showcase how your strategy outshines the competition.
Whenever you’re ready, there are 3 ways YCharts can help you:
1. Have questions about how YCharts can make security research more efficient?
Send us an email at hello@ycharts.com or call (866) 965-7552. You’ll be directly in touch with one of our Chicago-based team members.
2. Want to test out YCharts for free?
Start a no-risk 7-Day Free Trial.
3. Download a copy of How Advisors Use YCharts to Save Clients Money on Taxes:
Disclaimer
©2023 YCharts, Inc. All Rights Reserved. YCharts, Inc. (“YCharts”) is not registered with the U.S. Securities and Exchange Commission (or with the securities regulatory authority or body of any state or any other jurisdiction) as an investment adviser, broker-dealer, or in any other capacity, and does not purport to provide investment advice or make investment recommendations. This report has been generated through application of the analytical tools and data provided through ycharts.com and is intended solely to assist you or your investment or other adviser(s) in conducting investment research. You should not construe this report as an offer to buy or sell, as a solicitation of an offer to buy or sell, or as a recommendation to buy, sell, hold or trade, any security or other financial instrument. For further information regarding your use of this report, please go to: ycharts.com/about/disclosure
Next Article
Monthly Market Wrap: October 2023Read More →
