How Treasury Yields Are Influencing Crypto and What Advisors Need to Know
Why Bitcoin Is Reacting to Treasury Yield Spread Inversions
The past few months have seen Bitcoin and Treasury yields climb and crypto prices surge at the same time. For many investors, that’s a head-scratcher. Isn’t crypto supposed to drop when interest rates rise?
It’s not that simple.
Advisors who understand the shifting dynamics between yields and digital assets are in a better position to explain what’s happening, why, and how it affects portfolio strategy. As investor behavior continues to evolve, so too must the lens through which we view cross-asset relationships.
In this blog, we’ll cover:
- • Why Treasury yields are rising and what that means for broader market sentiment
- • How crypto has historically reacted to yield shifts (and when it hasn’t)
- • What it looks like when both rise together or sharply diverge
- • Why this matters for client conversations and multi-asset strategy
- • How YCharts can help visualize, track, and communicate these relationships
Crypto Acts Like a Risk Asset, Not a Hedge
Despite the narratives around digital gold and inflation protection, Bitcoin and Ethereum still behave like high-beta risk assets. That means they tend to rise when investors are feeling optimistic and flush with liquidity, not necessarily when inflation is running hot or yields are spiking.
In fact, crypto has shown:
- • Strong correlations with equities during bull runs (especially tech)
- • Sharp drawdowns during liquidity crunches (2022 tightening cycle)
- • Sensitivity to Fed commentary, fiscal policy shifts, and macro trends
For most investors, crypto isn’t functioning as a hedge, it’s functioning as an amplifier. Understanding that dynamic helps advisors better manage expectations and align digital assets with the right allocation buckets.
When Crypto and Yields Move in the Same Direction
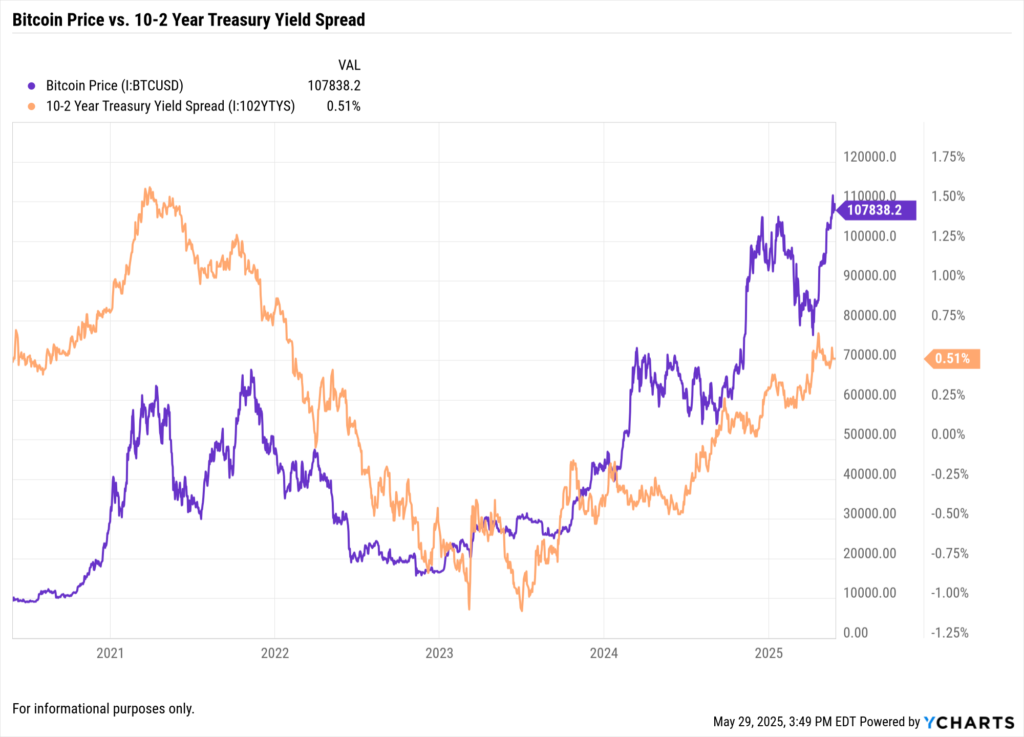
So what’s going on when both yields and crypto prices are rising?
Here’s the breakdown:
- Yields rising on growth optimism: When the market expects strong GDP, earnings expansion, or AI-led productivity gains, yields may climb without triggering a risk-off response. Crypto, as a forward-looking asset, rides that wave.
- Yields rising but inflation in check: If real yields climb but inflation expectations are contained, capital still flows into risk assets.
- Demand-side buying: Institutional flows into ETFs, retail speculation, and renewed miner demand can all boost crypto even as yields rise.
In short, not all yield spikes are equal. It’s the “why” behind the move that matters most.
When the Correlation Breaks
On the flip side, when yields spike due to inflation fears or aggressive Fed positioning, crypto often sells off. Investors exit risk to de-lever. Liquidity dries up. Volatility increases. And we see flight to safety.
This happened multiple times in 2022:
- • Fed signals tighter for longer
- • Treasury yields climb aggressively
- • Bitcoin and Ethereum fall in tandem with growth stocks
The same may happen again if the Fed pivots hawkish or inflation re-accelerates. Advisors should prep clients accordingly, not with fear, but with scenario planning.
What Advisors Should Watch Going Forward
Here’s what to keep an eye on if you want to understand and explain crypto’s relationship to rates:
- Yield Curve Movements — Watch the 2s10s spread for signs of steepening or inversion shifts. These impact macro outlook and risk appetite.
- Fed Communication — Dot plots, CPI data, and Powell’s language continue to move markets. Crypto is highly sensitive to liquidity expectations.
- Inflation Metrics — If inflation stays sticky while growth slows, that’s bad news for both bonds and crypto.
- ETF Flows — Institutional inflows into spot BTC ETFs are now a real driver of demand. Look for correlations there.
- Risk-On vs. Risk-Off Signals — When VIX rises, and Treasury demand spikes, crypto is more likely to pull back.
YCharts offers tools to stay on top of all these elements with real-time data, alerts, and visualization.
How to Use YCharts to Monitor Crypto and Treasury Yield Trends
You don’t need to guess when markets turn. With YCharts, you can visualize the connection between crypto and Treasury yields—and bring that story into client meetings.
1. Fundamental Charts
• Compare BTC or ETH against 10Y and 2Y yields over custom timeframes
• Overlay with inflation, Fed funds rate, or equity indices
• Spot reversals and divergences early
2. Yield Curve Tool
• View real-time shifts across the curve
• Analyze steepening, flattening, or inversion events
• Add macro context to fixed income strategy conversations
3. Scenarios & Attribution
• Stress test crypto holdings under different rate environments
• Use performance attribution to explain drawdowns
• Align allocation strategy with household-level goals
4. Alerts & Dashboards
• Set custom alerts on yield changes or crypto volatility
• Build macro dashboards for proactive reviews
• Empower clients with data, not noise
Final Take: Macro Awareness Drives Better Outcomes
It’s no longer enough to treat crypto and bonds as separate universes. Today’s market is macro-driven. The Fed sets the tone, yields signal confidence (or fear), and crypto reacts in real time.
For advisors, that means understanding correlations, context, and timing. It means using data not just to explain what happened—but to prepare clients for what might happen next.
With the right tools, you can move from reactive to proactive. That’s the difference between checking the box and adding real strategic value.
Whenever you’re ready, here’s how YCharts can help you:
1. Looking to Move On From Your Investment Research and Analytics Platform?
2. Want to test out YCharts for free?
Start a no-risk 7-Day Free Trial.
3. Sign up for a copy of our Fund Flows Report and Visual Deck to stay on top of ETF trends:
Sign up to recieve a copy of our monthly Fund Flows Report:Disclaimer
©2025 YCharts, Inc. All Rights Reserved. YCharts, Inc. (“YCharts”) is not registered with the U.S. Securities and Exchange Commission (or with the securities regulatory authority or body of any state or any other jurisdiction) as an investment adviser, broker-dealer or in any other capacity, and does not purport to provide investment advice or make investment recommendations. This report has been generated through application of the analytical tools and data provided through ycharts.com and is intended solely to assist you or your investment or other adviser(s) in conducting investment research. You should not construe this report as an offer to buy or sell, as a solicitation of an offer to buy or sell, or as a recommendation to buy, sell, hold or trade, any security or other financial instrument. For further information regarding your use of this report, please go to: ycharts.com/about/disclosure.
Next Article
Use Holdings Overlap to Answer, “What Makes You Different?”Read More →