How Well Does the “Buffett Indicator” Predict Market Crashes?
The “Buffett Indicator” is the ratio of total US stock market capitalization to US Gross Domestic Product (GDP). Named after Warren Buffett, the “Oracle of Omaha” once called this ratio “the best single measure of where valuations stand at any given moment.” According to Buffett and the indicator, values above 100% signal overvaluation for US equities. But how effectively can the “Buffett Indicator” be used to predict stock market downturns?
In our latest white paper, Which Leading Indicators Best Predict Market Declines?, we examined the “Buffett Indicator”, inverted yield spreads, and five other leading indicators commonly used to predict market and economic cycles. Over 21 major market declines since 1950, each indicator’s accuracy and consistency were varied. Each indicator’s correlation with forward S&P 500 returns, and how much of a warning, measured in months, the indicators gave for impending market crashes were also investigated.
The findings help answer a timeless (and timely) question: can any leading indicator be consistently trusted to stay ahead of market declines?
Download the new White Paper—which also looks at S&P 500 PE Ratio, CAPE Ratio, Inverted Yield Spreads, Tobin’s Q, and Negative S&P 500 Earnings Growth—for our full findings:
How Accurate is the “Buffett Indicator” at Predicting Market Declines, Historically Speaking?
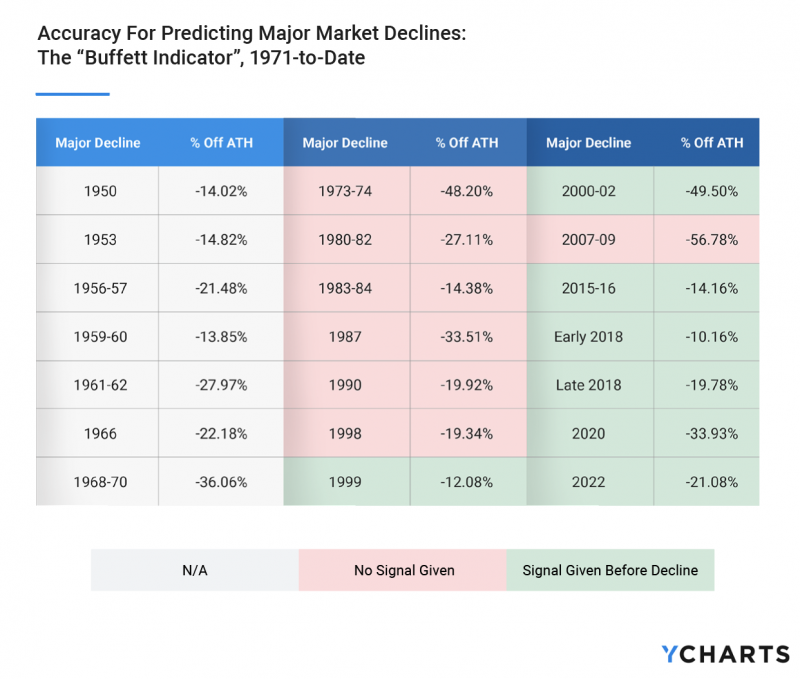
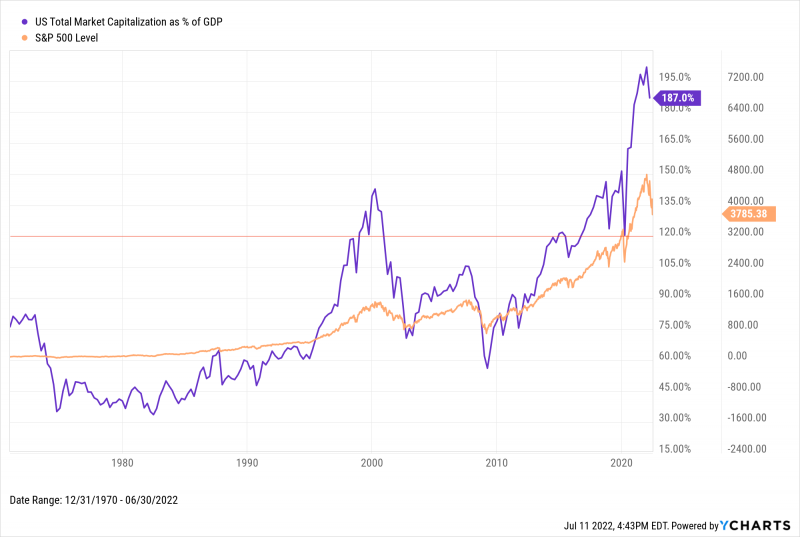
Out of a possible 14 major market declines (10% or greater) dating back to 1971, the “Buffett Indicator” provided advance warning to 7 of those downturns. Though anything above a 1:1 ratio—or level of 100%—is considered a sign of an overvalued market, we increased the overvaluation threshold by 20% to establish a critical level which would be hard for advisors and investors to ignore.
Download the Full Report to Learn More
A success rate of just 50% places the “Buffett Indicator” among the most reliable of the seven indicators studied. However, there’s a catch. The “Buffett Indicator” has been above 120% since Q3 2016, meaning that stocks have been overvalued for about six years according to the metric. On average, the “Buffett Indicator” first entered overvaluation territory 24.2 months in advance of those seven major market declines.
Download Visual | Modify in YCharts
How Does the “Buffett Indicator” Hold Up in Modern Equity Market Dynamics?
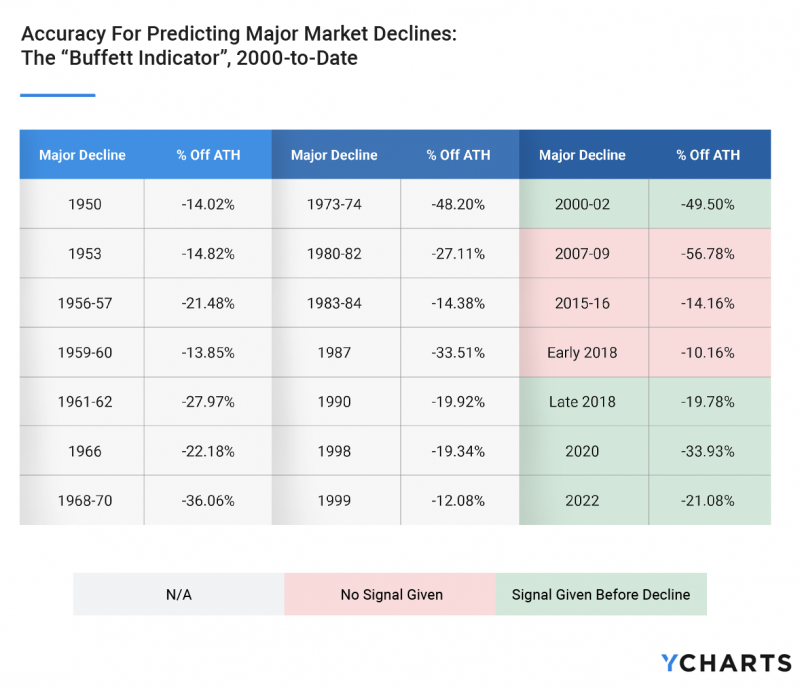
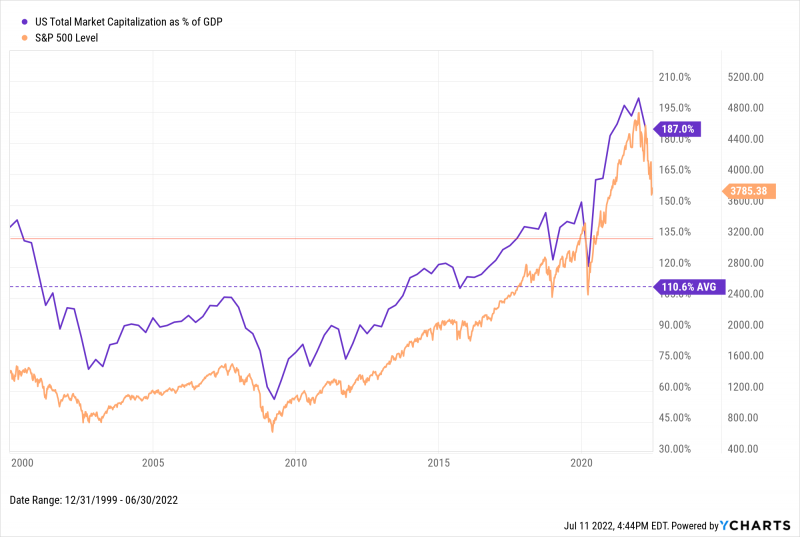
To evaluate how the “Buffett Indicator” has performed in recent history, we examined its average level since 2000 of 110.6% and applied a 20% handicap to arrive at a “hard-to-ignore” overvaluation threshold of 132.7%. Of 7 major market declines since 2000, this updated “Buffett Indicator” signaled warnings for 4 of them.
Download the Full Report to Learn More
The indicator provided more “well-timed” warnings of market declines using this elevated threshold. The average time from initial overvaluation signal to relative S&P 500 peak using the updated threshold was about 13 months shorter, down to 10 months. And each warning sign was distinct, with no single overvaluation signal preceding more than one major market decline.
A downside to following the elevated “Buffet Indicator” threshold: not receiving any warning for the 2007-09, 2015-16, and early 2018 market declines.
Download Visual | Modify in YCharts
To see how effective other leading indicators have been at predicting stock market declines, download the FREE white paper today!
Connect with YCharts
To get in touch, contact YCharts via email at hello@ycharts.com or by phone at (866) 965-7552
Interested in adding YCharts to your technology stack? Sign up for a 7-Day Free Trial.
Disclaimer
©2022 YCharts, Inc. All Rights Reserved. YCharts, Inc. (“YCharts”) is not registered with the U.S. Securities and Exchange Commission (or with the securities regulatory authority or body of any state or any other jurisdiction) as an investment adviser, broker-dealer or in any other capacity, and does not purport to provide investment advice or make investment recommendations. This report has been generated through application of the analytical tools and data provided through ycharts.com and is intended solely to assist you or your investment or other adviser(s) in conducting investment research. You should not construe this report as an offer to buy or sell, as a solicitation of an offer to buy or sell, or as a recommendation to buy, sell, hold or trade, any security or other financial instrument. For further information regarding your use of this report, please go to: ycharts.com/about/disclosure
Next Article
Trending Stocks, Funds, and Econ Data: August 2022Read More →