Advisors Rebalance Abroad as International Inflows Strengthen

Equity outflows dominated the third quarter, but international strategies proved a bright spot. While many U.S. equity categories saw consistent redemptions, investors continued adding to international allocations, particularly in multi-cap core funds.
Sign up for our free monthly Fund Flow Report to stay updated on how assets are moving in and out of these strategies: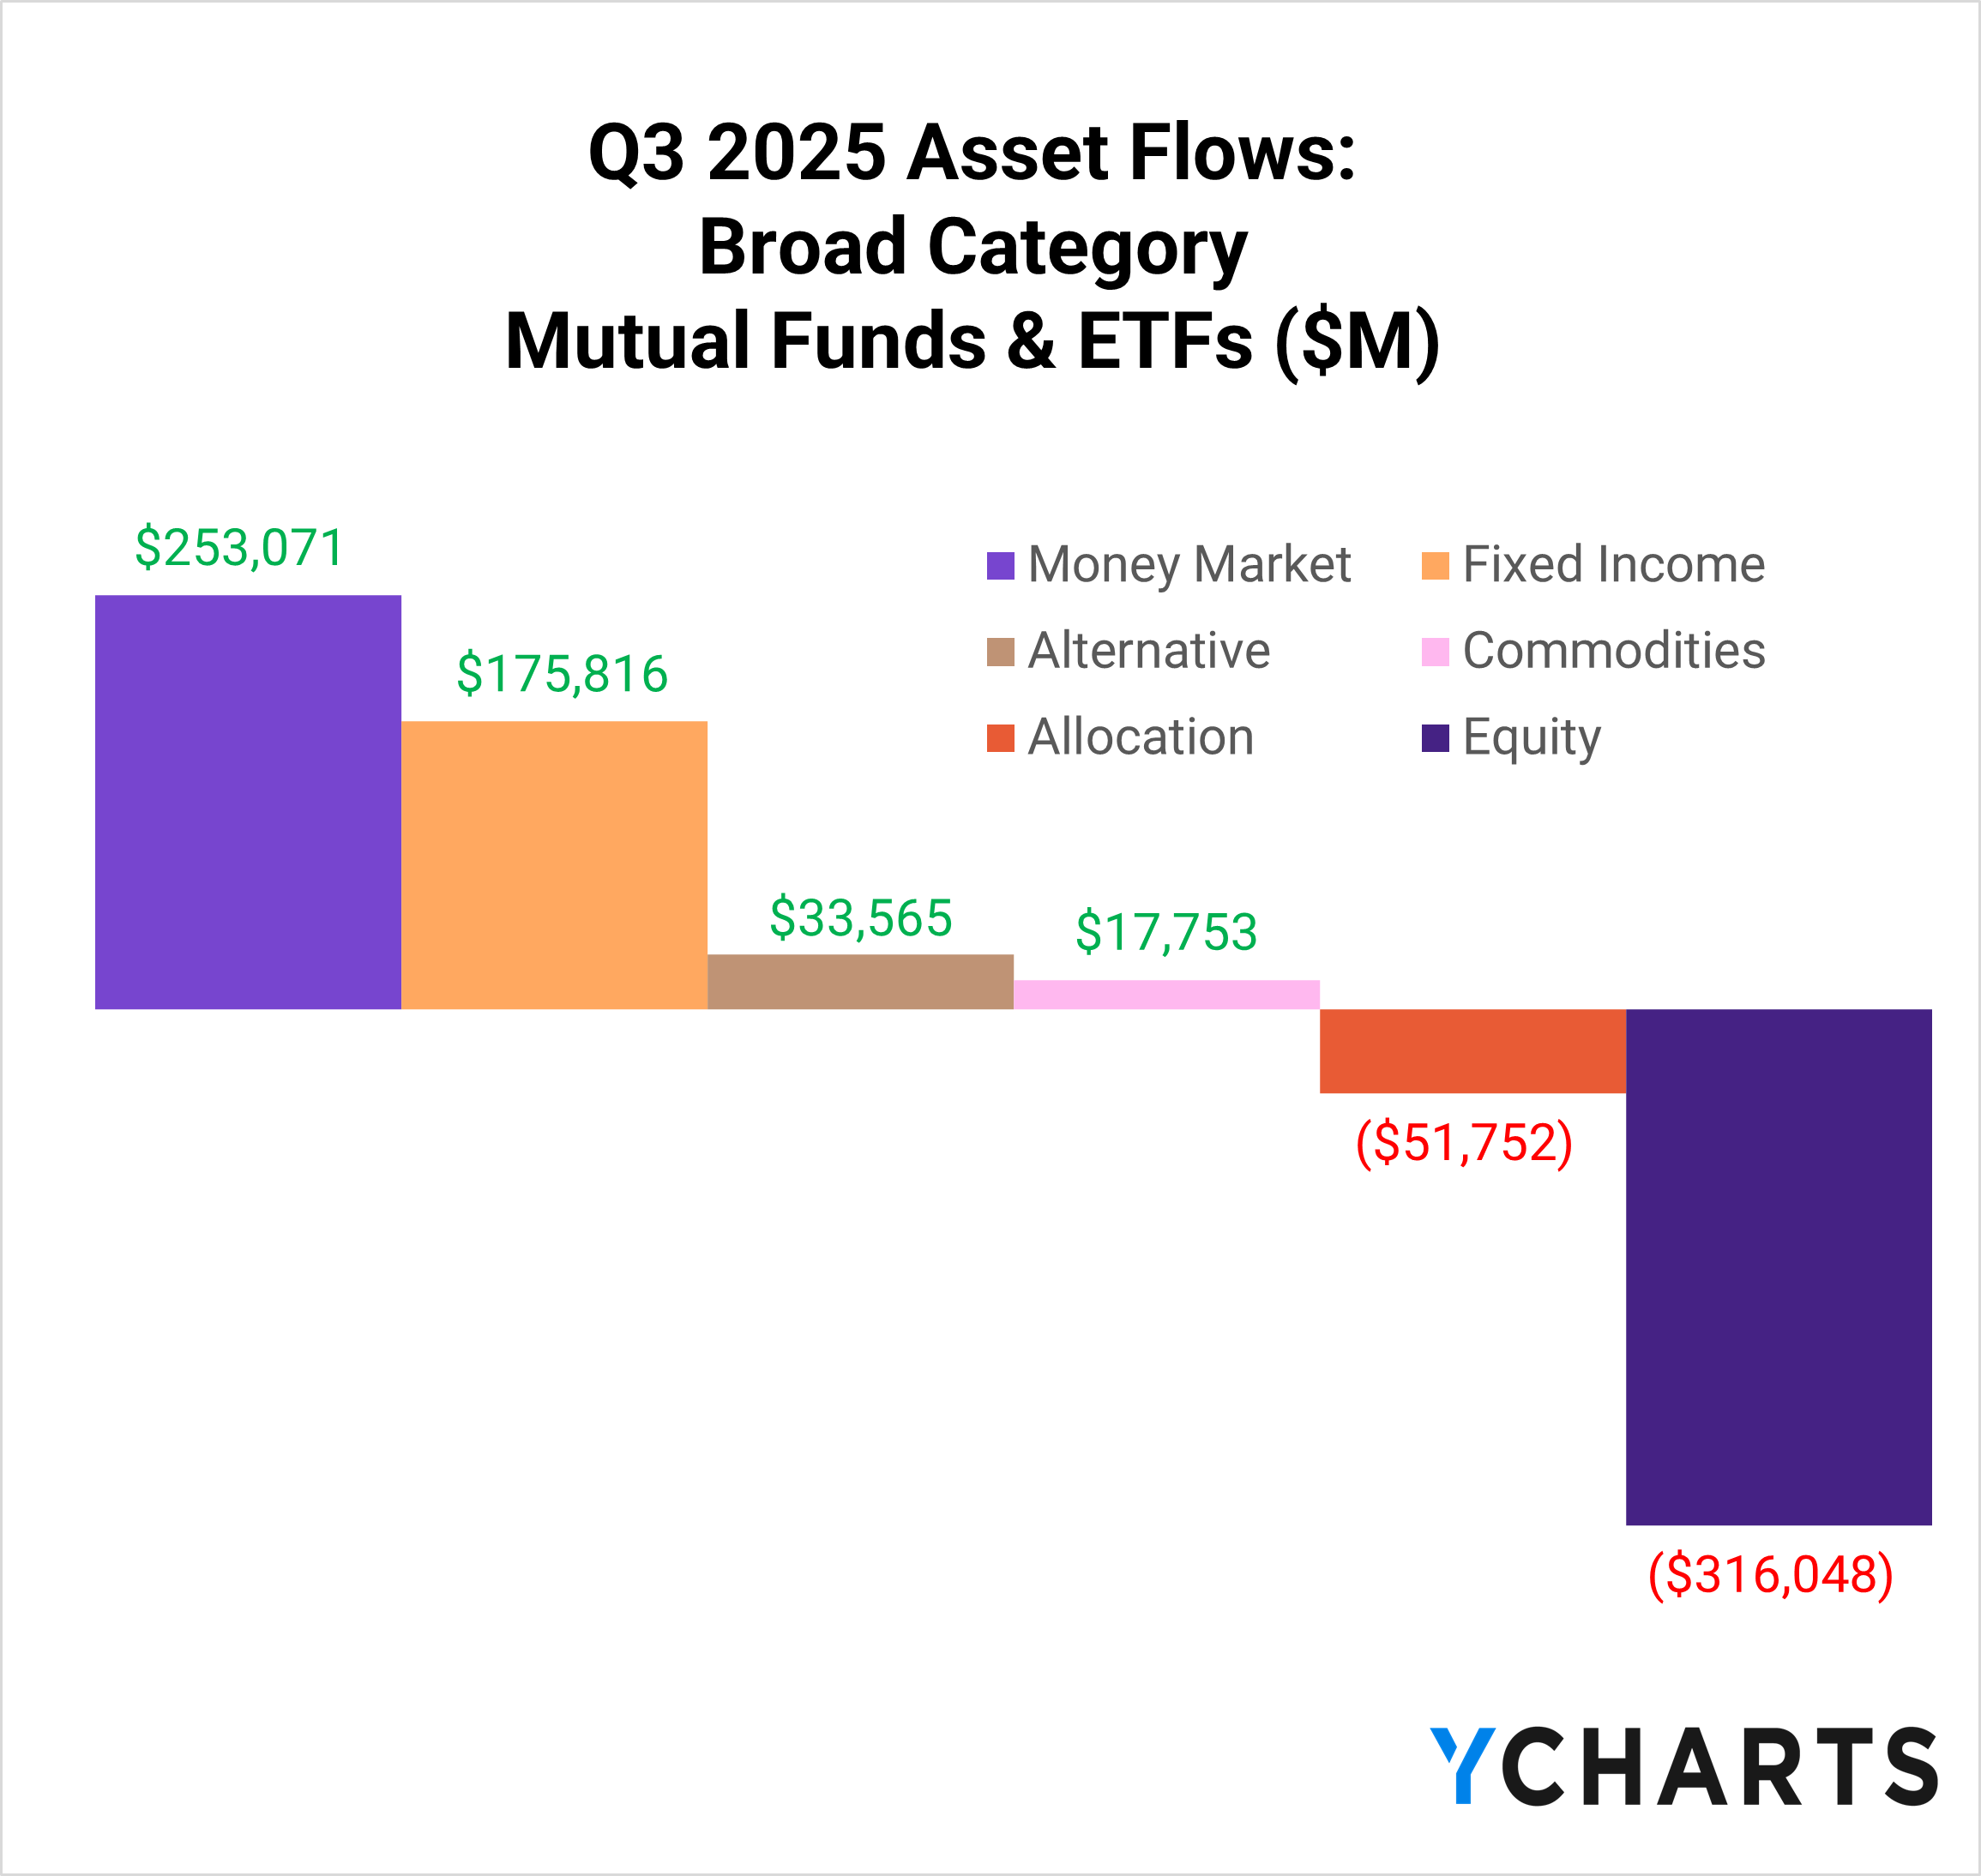
In September alone, $10.5 billion flowed into international mutual funds and ETFs, marking one of the strongest months for global equities this year. Investors appear to be rebalancing toward broader diversification as U.S. market concentration and dollar strength ease.
Table of Contents
A Broader Market Emerges
U.S. equities have led global markets for much of the past decade, powered by a handful of mega-cap technology names. That dominance has left many portfolios heavily concentrated across the same sectors and companies.
International exposure offers a counterbalance, reducing concentration risk by spreading exposure across regions and industries. Global markets carry less weight in large-cap technology and greater balance across Financials, Industrials, and Materials.
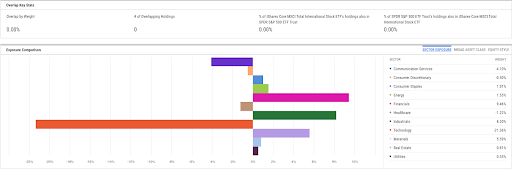
Holdings overlap between a popular broad U.S. equity ETF and international ETF with no shared positions. Click to view in YCharts.
Long-term trends have favored U.S. stocks, with domestic markets significantly outperforming global peers over the past decade and a half.
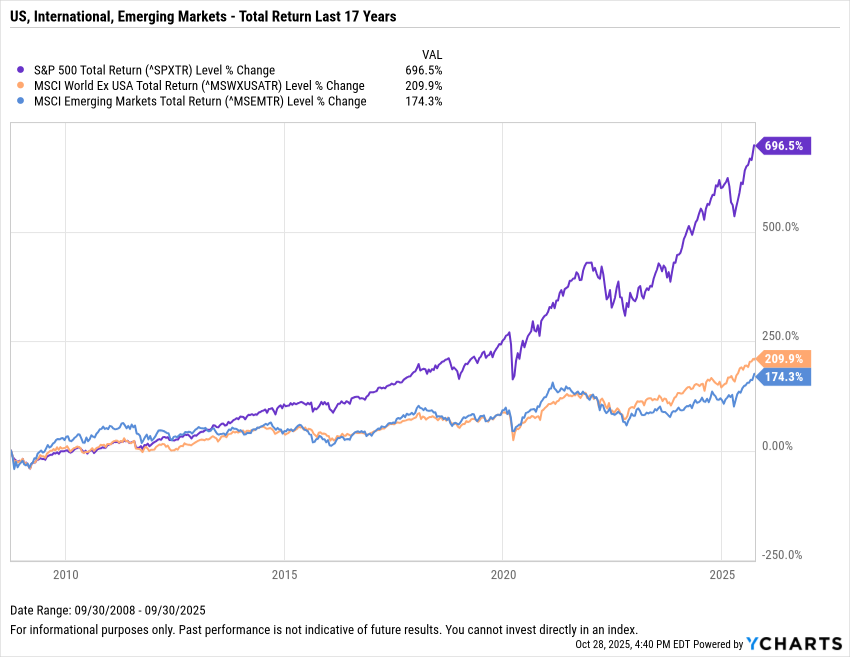
Explore in YCharts → US vs World Markets
This year, however, international markets have shown renewed strength. Emerging economies and developed markets outside the U.S. have both outpaced domestic equities, signaling a more balanced global backdrop.
2025 Total Returns:
- Emerging Markets: +28.2% YTD
- World ex-USA: +25.9% YTD
- S&P 500: +14.8% YTD
A weaker U.S. dollar has further supported global performance. As the dollar declines, foreign earnings translate into higher U.S. dollar values, improving relative returns for international equities.
This dynamic, where a falling dollar coincides with international markets narrowing the gap, was last seen in the early 2000s, just before a multi-year stretch of international outperformance.
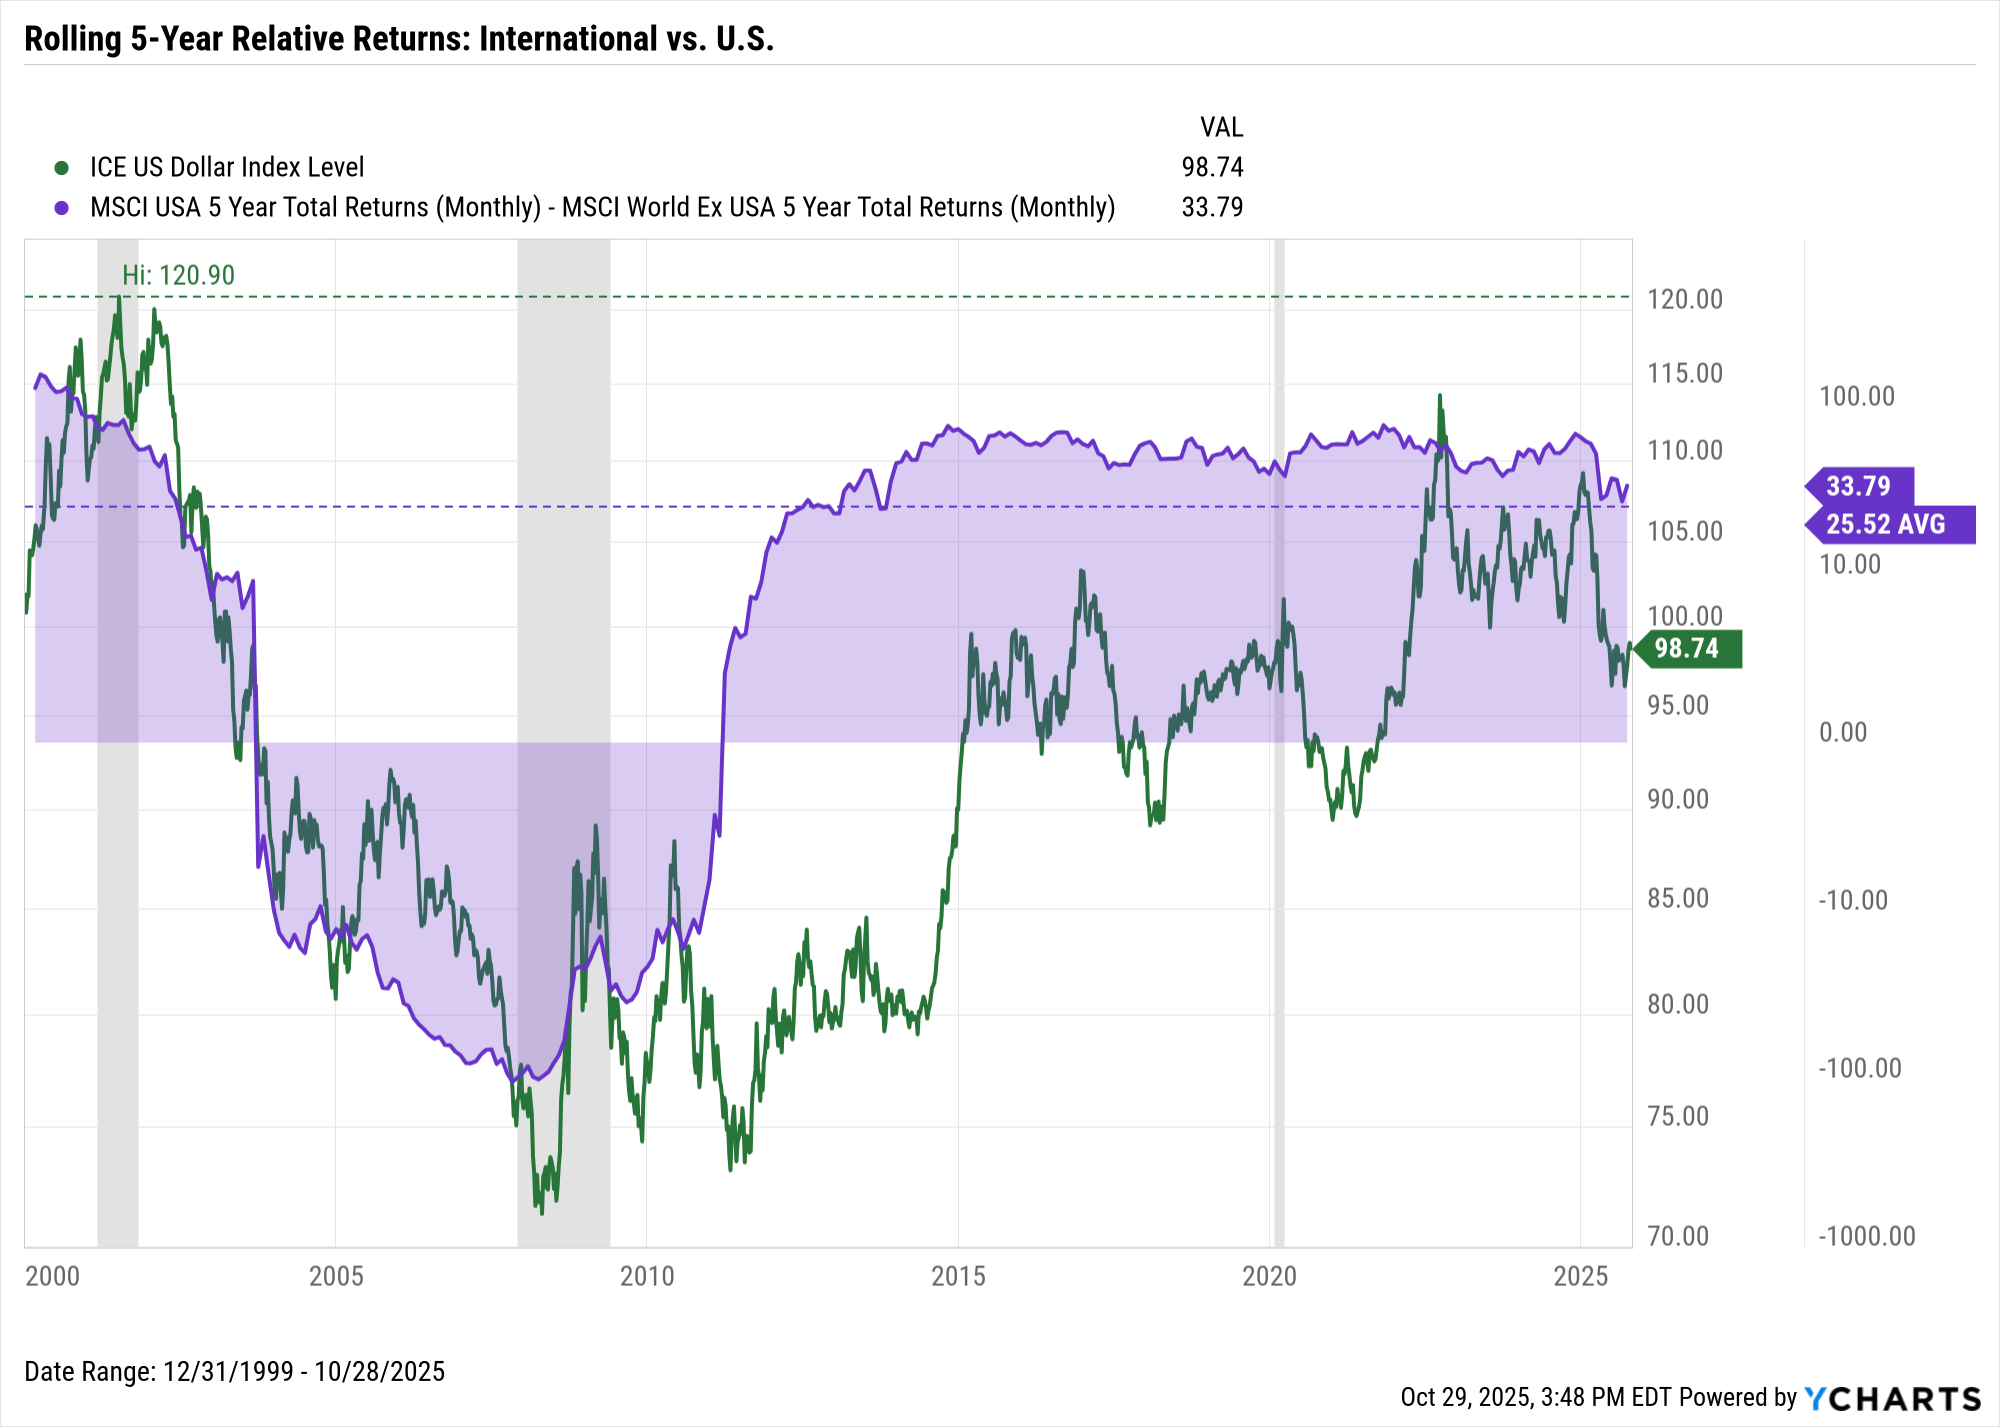
Explore in YCharts → Weakening US Dollar
With concentration risk elevated and currency trends shifting, global diversification is gaining renewed attention. Strength across international markets in 2025 translated into rising allocations as advisors sought broader exposure.
ETF Strength Drives International Inflows Through Q3
The third quarter saw demand for diversified international exposure, with International Multi-Cap Core funds leading the trend.
International Multi-Cap Core Q3 Flow Leaders
These vehicles added $24.9 billion in inflows in Q3 and $48.7 billion year to date, accounting for nearly 8% of total assets in the peer group.
The Vanguard Developed Markets Index Fund ETF (VEA) led with $6.2 billion in quarterly inflows and more than $10.6 billion year-to-date, reinforcing its position as a core holding for global diversification. The iShares Core MSCI EAFE ETF (IEFA) followed with $5.7 billion for the quarter.
| Fund Name | 1 Month Fund Share Class Flows | 3 Month Fund Share Class Flows | 3 Month Share Class Flows % of AUM (Monthly) | YTD Fund Share Class Flows | YTD Share Class Flows % of AUM (Monthly) | 1 Year Fund Share Class Flows |
|---|---|---|---|---|---|---|
| Vanguard Developed Markets Index Fund ETF | 2.387B | 6.216B | 3.47% | 10.62B | 5.94% | 13.97B |
| iShares Core MSCI EAFE ETF | 2.461B | 5.688B | 3.66% | 6.040B | 3.88% | 8.365B |
| Vanguard Total International Stock Index Fund ETF | 1.484B | 5.030B | 4.71% | 12.56B | 11.76% | 14.97B |
| Avantis International Equity ETF | 715.99M | 1.676B | 17.22% | 2.615B | 26.87% | 2.907B |
| SPDR Portfolio Developed World ex-US ETF | 446.29M | 1.599B | 5.28% | 4.007B | 13.23% | 4.121B |
Colors are normalized within each column. Darker tints indicate larger magnitudes relative to peers for that metric (scaled separately for flows vs percent values).
The Vanguard Total International Stock Index Fund ETF (VXUS) added $5 billion in Q3 and $12.6 billion year-to-date, equal to nearly 12% of its assets.
Avantis International Equity ETF (AVDE) collected $1.7 billion during the quarter, while the SPDR Portfolio Developed World ex-US ETF (SPDW) rounded out the top five with $1.6 billion in inflows.
International Small/Mid-Cap Core Q3 Flow Leaders
Smaller-cap international strategies saw more selective demand in the third quarter, with flows concentrated in a few standout funds.
The DFA Dimensional International Small Cap ETF (DFIS) led the group with $931 million in Q3 inflows, accounting for virtually all of its $951 million YTD total and 24% of its overall asset base.
The DFA International Small Company Portfolio Institutional (DFISX) followed with $365 million for the quarter, while the Fidelity Advisor International Small Cap Fund Z (FIQIX) added $179 million.
| Fund Name | 1 Month Fund Share Class Flows | 3 Month Fund Share Class Flows | 3 Month Share Class Flows % of AUM (Monthly) | YTD Fund Share Class Flows | YTD Share Class Flows % of AUM (Monthly) | 1 Year Fund Share Class Flows |
|---|---|---|---|---|---|---|
| DFA Dimensional International Small Cap ETF | 70.83M | 931.05M | 23.22% | 951.25M | 23.72% | 1.093B |
| DFA International Small Company Portfolio Inst | -89.56M | 365.13M | 2.57% | -434.94M | -3.07% | -1.312B |
| Fidelity Advisor International Small Cap Fund Z | 184.74M | 178.50M | 8.61% | 2.081M | 0.10% | 27.26M |
| iShares Intl Small Cap Equity Factor ETF | 36.54M | 110.93M | 22.30% | -124.66M | -25.06% | -145.53M |
| Pacific Select International Small-Cap Portfolio P | 68.76M | 61.63M | 14.86% | 36.28M | 8.75% | 306.18M |
Colors are normalized within each column. Darker tints indicate larger magnitudes relative to peers for that metric (scaled separately for flows vs percent values).
The iShares International Small Cap Equity Factor ETF (ISCF) brought in $111 million during the quarter, and the Pacific Select International Small-Cap Portfolio P (LP40226792) rounded out the top five with $62 million.
International Large-Cap Core Q3 Flow Leaders
Large-cap international strategies also attracted meaningful inflows in the third quarter, supported by momentum and blended strategies.
The MFS International Equity Fund R6 (MIEIX) led the category with $1.4 billion in Q3 inflows and $1.7 billion year-to-date.
JPMorgan International Research Enhanced Equity ETF (JIRE) followed with $853 million for the quarter, while the Invesco S&P International Developed Momentum ETF (IDMO) added $761 million in Q3 and $1.4 billion year-to-date, equal to more than 70% of its assets.
| Fund Name | 1 Month Fund Share Class Flows | 3 Month Fund Share Class Flows | 3 Month Share Class Flows % of AUM (Monthly) | YTD Fund Share Class Flows | YTD Share Class Flows % of AUM (Monthly) | 1 Year Fund Share Class Flows |
|---|---|---|---|---|---|---|
| MFS International Equity Fund R6 | 211.74M | 1.354B | 6.18% | 1.684B | 7.69% | 2.712B |
| JPMorgan International Research Enhanced Eqty ETF | 390.31M | 853.15M | 9.61% | 400.72M | 4.51% | 1.059B |
| Invesco S&P Intl Developed Momentum ETF | 263.24M | 760.61M | 39.68% | 1.377B | 71.83% | 1.406B |
| MFS Blended Research International Equity Fund I | 270.75M | 466.67M | 42.85% | 654.25M | 60.08% | 685.27M |
| Lazard International Dynamic Equity ETF | -148.37M | 370.05M | 84.35% | 377.52M | 86.05% | 378.75M |
Colors are normalized within each column. Darker tints indicate larger magnitudes relative to peers for that metric (scaled separately for flows vs percent values).
The MFS Blended Research International Equity Fund I (BRXIX) brought in $467 million, and the Lazard International Dynamic Equity ETF (IDEQ) added $370 million, a quarterly increase equal to nearly 85% of its asset base.
Emerging Markets Q3 Flow Leaders
ETFs carried Emerging Markets in the third quarter. While mutual funds saw significant outflows, ETFs drove a combined net inflow of nearly $1 billion for the group, fueled by $9 billion in ETF inflows alone.
| Fund Name | 1 Month Fund Share Class Flows | 3 Month Fund Share Class Flows | 3 Month Share Class Flows % of AUM (Monthly) | YTD Fund Share Class Flows | YTD Share Class Flows % of AUM (Monthly) | 1 Year Fund Share Class Flows |
|---|---|---|---|---|---|---|
| iShares Core MSCI Emerging Markets ETF | 2.228B | 4.769B | 4.34% | 9.726B | 8.84% | 8.656B |
| Vanguard Emerging Markets Stock Index Fund ETF | 955.19M | 2.092B | 2.05% | 4.538B | 4.45% | 6.072B |
| Avantis Emerging Markets Equity ETF | 765.55M | 1.572B | 11.68% | 3.797B | 28.23% | 4.281B |
| SPDR Portfolio Emerging Markets ETF | 535.56M | 927.24M | 6.47% | 2.072B | 14.45% | 2.392B |
| Capital Group New Geography Equity ETF | 109.45M | 333.03M | 37.01% | 690.75M | 76.75% | 728.44M |
Colors are normalized within each column. Darker tints indicate larger magnitudes relative to peers for that metric (scaled separately for flows vs percent values).
Leading the way, the iShares Core MSCI Emerging Markets ETF (IEMG) added $4.8 billion in Q3 and $9.7 billion year-to-date, accounting for the largest share of new assets in the segment. Close behind, the Vanguard Emerging Markets Stock Index Fund ETF (VWO) gathered $2.1 billion for the quarter and $4.5 billion YTD.
The Avantis Emerging Markets Equity ETF (AVEM) saw $1.6 billion in quarterly inflows, equal to more than 28% of its assets, while the SPDR Portfolio Emerging Markets ETF (SPEM) added $927 million.
Rounding out the group, the Capital Group New Geography Equity ETF (CGNG) brought in $333 million, a quarterly gain equal to nearly 37% of its asset base.
Investor activity this quarter reflected a clear preference for low-cost, diversified exposure to emerging markets as performance strengthened abroad.
Advisors Look Beyond U.S. Borders
International allocations stood out this quarter as advisors looked past domestic concentration and toward broader opportunity. ETF inflows signaled a renewed conviction in global diversification and a willingness to participate in shifting market leadership.
Subscribe to the Fund Flow Report for ongoing insights into which peer groups and funds are winning advisor allocations each month.
Ready to Move On From Your Investment Research and Analytics Platform?
Follow YCharts Social Media to Unlock More Content!
Disclaimer
©2025 YCharts, Inc. All Rights Reserved. YCharts, Inc. (“YCharts”) is not registered with the U.S. Securities and Exchange Commission (or with the securities regulatory authority or body of any state or any other jurisdiction) as an investment adviser, broker-dealer or in any other capacity, and does not purport to provide investment advice or make investment recommendations. This report has been generated through application of the analytical tools and data provided through ycharts.com and is intended solely to assist you or your investment or other adviser(s) in conducting investment research. You should not construe this report as an offer to buy or sell, as a solicitation of an offer to buy or sell, or as a recommendation to buy, sell, hold or trade, any security or other financial instrument. For further information regarding your use of this report, please go to: ycharts.com/about/disclosure.
Next Article
Recession Indicators 2025: The Institutional Framework for Predicting & Managing Economic DownturnsRead More →