Introducing Model Portfolio Overview Reports
YCharts Professional users can now generate Model Portfolio Overview Reports, in just a few clicks, for any model portfolio, investment strategy, or blended benchmark.
With this new functionality, YCharts will work with users to customize reports with their firm’s logo and color scheme, plus 17 different modules that cover returns, performance, exposures, risk, composition, and holdings.
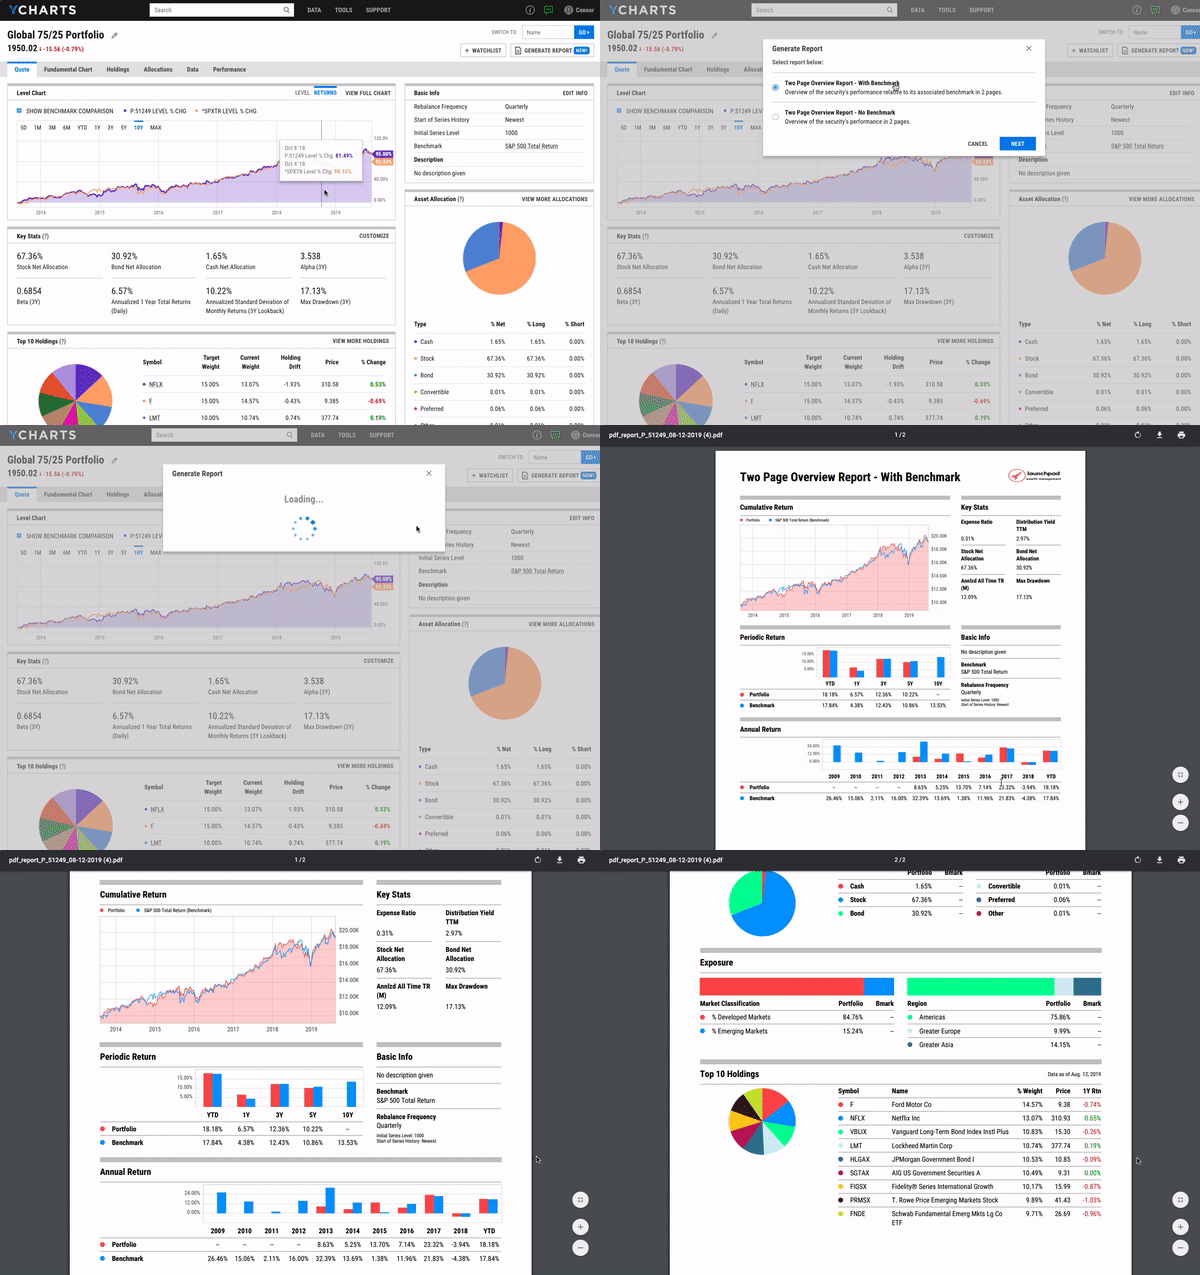
Generating a Model Portfolio Overview Report is this easy:

YCharts’ Model Portfolios tool gives advisors an intuitive and powerful means for constructing, testing, and tracking the performance of any investment strategy or basket of securities. With the ability to generate Overview Reports for any Model Portfolio, the tool addresses even more of advisors’ needs (more on this below).
To get started, we’ve highlighted a few of the most powerful ways Model Portfolio Overview Reports can be leveraged — to create proposals for clients and prospects, to prepare summaries of model strategies, and to build continuity throughout client communication efforts.
To learn more about Model Portfolio Overview Reports or start a free trial, visit ycharts.com.
1.Create proposals for clients and prospects
When meeting with a prospect or proposing a new strategy to an existing client, advisors need to demonstrate their value and show why they deserve that new business or additional wallet-share.
Because advisors differentiate themselves by highlighting their unique value propositions, shouldn’t their marketing and communication materials do the same?
If your firm focuses on risk management and helping to diversify clients’ investments, you could use YCharts to create a Model Portfolio Overview Report that shows prospects your superiority in limiting portfolio standard deviation and balancing geographic or style exposure.
See below how two Model Portfolio Overview Reports modules look with different color schemes:


2. Prepare summaries of model strategies
Many firms leverage a suite of model strategies to address different risk appetites and tolerances. Offering several model portfolios allows for efficiencies of scale in portfolio management, and Overview Reports streamline the management of those models.
Once you’ve built your suite of strategies in the YCharts Model Portfolios tool, users can generate reports for each model’s performance for evaluation purposes at investment committee meetings, or for illustrating to a client which strategy is appropriate for them.
Below is a preview of an Overview Report that all YCharts Professional users can access and leverage for evaluating different strategies.

3. Build continuity throughout client communications
In the modern age of wealth management, clients expect a heightened level of communication from their advisors.
Not only do prospects and clients want more frequent contact, but they also want communication that is more personalized and sophisticated. Simply put, pre-canned portfolio summaries with boilerplate data and grayscale visuals aren’t “wow-ing” anyone.
Click the links below to see a sampling of different Model Portfolio Overview Reports. Notice that you can include your firm’s logo, select different data modules, and add visuals in a uniform color scheme. You can also include a personalized cover page or add your firm’s disclaimer.
With a dedication to listening to and incorporating client feedback, YCharts continues to make investment data and research more accessible. Model Portfolio Overview Reports give advisors more and higher quality touch points to demonstrate value and share insights with clients and prospects.
YCharts Professional users have full access to Model Portfolio Overview Reports. For more information on getting started with Overview Reports or getting access to YCharts, reach out to your support contact or learn more at YCHARTS.COM
