Is the 60/40 Portfolio Drowning?
Is it time to revisit the 60/40 Portfolio?
“The 60/40 Portfolio Is Dead” (January 25, 2022)…
”Why a 60/40 Portfolio Is No Longer Good Enough” (August 12, 2020)…
“Time for FAs to Rethink Portfolio Construction Rules: Execs” (May 13, 2022)…
”Traditional 60/40 portfolio has actually reached its expiration date” (September 2, 2021).
Apparently, some think so. This is just a sampling of the recent headlines surrounding the 60/40 portfolio, which has historically been regarded as a reliable best practice for long-term investors.
Made up of 60% stocks and 40% bonds, the 60/40 portfolio is designed to capture the best of both worlds: equities’ growth potential and stable income from bonds. When stocks are in a bull market, the 60/40 portfolio is poised to take advantage of rising stock prices. In times when stocks fall out of favor, its 40% bond allocation offers much-needed downside protection.
But so far, 2022 has been an unusual year. At the time of writing, both the NASDAQ and S&P 500 have entered bear market territory and the fixed income-tracking Bloomberg US Aggregate Index has drawn down more than 10%.
Since 2022 is taking a toll on both its equity and fixed income segments, is it fair to call the 60/40 portfolio dead? Exactly how well is the hallmark strategy doing, anyways? Let’s look at some data…
Historical Performance of the 60/40 Portfolio vs. Other Asset Classes
A 60/40 Sample Portfolio, constructed using Vanguard mutual funds and rebalanced annually, has regularly split the field of asset class performance (as it’s intended to do) over the last 10 years. (Allocations: 35% in Vanguard’s Total Stock Market Index (VTSMX); 20% in Total International Stock Index (VGTSX); 5% in Emerging Markets Stock Index (VEIEX); 30% in Total Bond Market Index (VBMFX); and 10% in Short-Term Bond Index (VBISX))
Over the past 1, 3, 5, and 10 years, the 60/40 Sample Portfolio’s performance landed right in the middle of all other asset classes. In the last month, three months, and year-to-date in 2022, the 60/40 Sample Portfolio has held its relative middle-of-the-road performance, despite every asset class except Commodities being in the red.
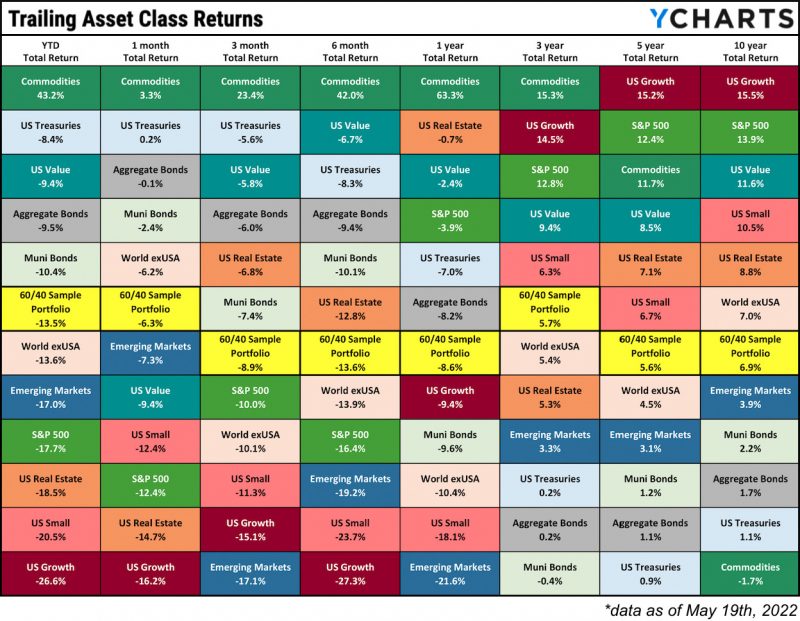
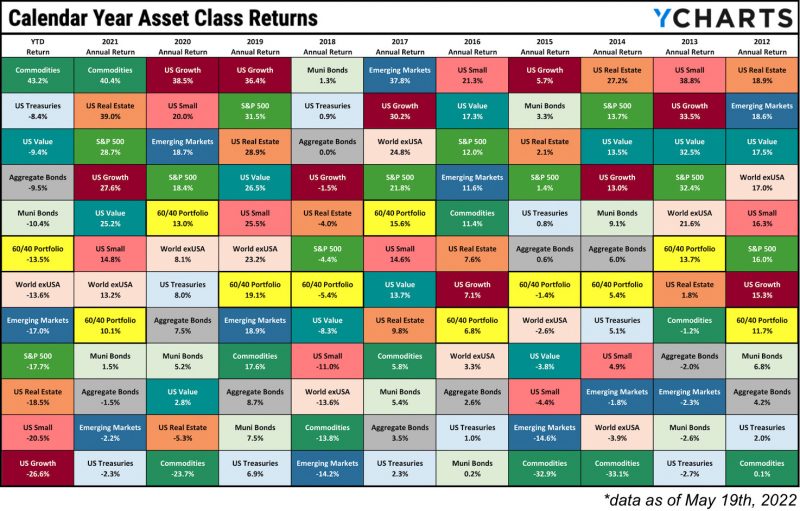
A similar trend can be seen through the lens of calendar year performance. Though the annual performance of the 60/40 Sample Portfolio has varied a little dating back to 2012, it has still delivered relatively steady returns. This includes 2022 YTD which, despite the 60/40 strategy delivering a negative -13.5% return, currently sits in a better place than any of the six equity asset classes listed in the table.
What Portfolio Allocations Might Have Limited Even More Downside Risk?
With the exception of Commodities, investors have had nowhere to hide in 2022. While bonds haven’t offered much stability as of late, history shows that a greater fixed income allocation would have made down years more palatable, albeit while diminishing portfolio returns. In fact, only the All-Bond Sample Portfolio eked out positive returns in 2015 and 2018.
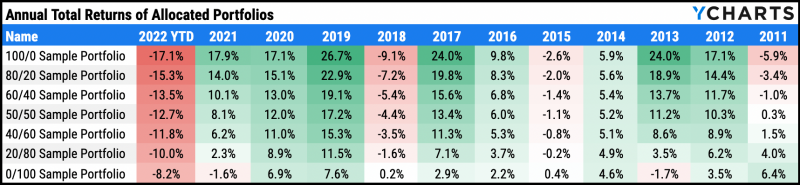
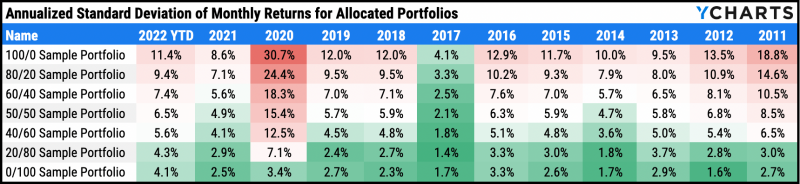
As is expected, portfolios with greater equity allocations also carry a track record of higher standard deviations (meaning more volatility). But note that while the All Stock and All Bond Sample Portfolios have sported higher standard deviations in recent years, the 60/40 Sample Portfolio is extremely consistent over the last decade in terms of volatility.
Is the 60/40 portfolio “dead”, as some suggest? Like most asset classes, the 60/40 portfolio is having a gloomy 2022 so far. However, as the data shows, the majority of asset classes have fared worse during this bear market.
Individual asset classes tend to ebb and flow over time, posting some great years and some not-so-great years. The 60/40 strategy, however, appears to continue finding itself right in the middle of the pack with each flip of the calendar, as intended by its design.
Connect with YCharts
To get in touch, contact YCharts via email at hello@ycharts.com or by phone at (866) 965-7552
Interested in adding YCharts to your technology stack? Sign up for a 7-Day Free Trial.
Disclaimer
©2022 YCharts, Inc. All Rights Reserved. YCharts, Inc. (“YCharts”) is not registered with the U.S. Securities and Exchange Commission (or with the securities regulatory authority or body of any state or any other jurisdiction) as an investment adviser, broker-dealer or in any other capacity, and does not purport to provide investment advice or make investment recommendations. This report has been generated through application of the analytical tools and data provided through ycharts.com and is intended solely to assist you or your investment or other adviser(s) in conducting investment research. You should not construe this report as an offer to buy or sell, as a solicitation of an offer to buy or sell, or as a recommendation to buy, sell, hold or trade, any security or other financial instrument. For further information regarding your use of this report, please go to: ycharts.com/about/disclosure
Next Article
The Best Bond ETFs: A Complete GuideRead More →