Largest Leveraged and Inverse ETFs
Updated as of: February 13, 2026
Leveraged and Inverse ETFs are advanced investment vehicles useful for short-term trading or gauging investor sentiment on a single stock or sector.
Leveraged ETFs are exchange-traded funds designed to amplify the daily returns of a specific index, typically by two (2x) or three (3x) times. These securities achieve the double or triple return objective through the use of financial derivatives such as swaps, futures, and options.
Inverse ETFs aim to deliver the opposite of the daily performance of a specific index, often using derivatives to achieve −1x, −2x, or −3x exposure. Investors use inverse ETFs to profit from or hedge against market declines without short selling.
Both of these investment vehicles are mainly intended for short-term trading or tactical strategies rather than long-term investing. This is mainly due to daily exposure resets and compounding effects that can cause significant performance deviations over time, especially in volatile markets.
To provide advisors with leveraged and inverse investment ideas for consideration in portfolios, we compiled a list of the largest leveraged and inverse ETFs based on share class assets under management (AUM) using the YCharts Fund Screener, which helps advisors navigate across a universe of over 81,000 funds to find specific investment candidates.
The following data includes AUM flows over the last month, three months, and one year, along with net expense ratio and one-year price returns for the largest leveraged and inverse ETFs.
Looking for lists of other best-performing ETFs? Check out our analysis on the YCharts blog.
Table of Contents
Largest Leveraged ETFs
These are the largest Leveraged ETFs as of February 10, 2026.
| Symbol | Name | Share Class Assets Under Management | 1 Month Fund Share Class Flows | 3 Month Fund Share Class Flows | 1 Year Fund Share Class Flows | Net Expense Ratio | Fund Family |
|---|---|---|---|---|---|---|---|
| TQQQ | ProShares UltraPro QQQ | $28,577,729,775.00 | -$1,283,627,799.00 | $437,950,502.00 | -$6,703,641,133.00 | 0.82% | ProShares |
| SOXL | Direxion Daily Semiconductor Bull 3X Shares | $13,640,734,816.00 | -$6,215,707,485.00 | -$6,220,877,659.00 | -$15,095,585,993.00 | 0.75% | Direxion Funds |
| QLD | ProShares Ultra QQQ | $10,390,014,477.00 | -$162,310,995.00 | $162,925,379.00 | $418,566,205.00 | 0.95% | ProShares |
| SSO | ProShares Ultra S&P500 | $7,692,502,336.00 | $394,106,930.00 | $592,562,346.00 | $946,312,801.00 | 0.87% | ProShares |
| SPXL | Direxion Daily S&P 500 Bull 3X Shares | $5,872,214,856.00 | -$309,554,442.00 | -$549,822,960.00 | -$853,526,419.00 | 0.87% | Direxion Funds |
| TSLL | Direxion Daily TSLA Bull 2X Shares | $5,733,739,683.00 | $472,200,298.00 | -$790,399,976.00 | -$222,082,644.00 | 0.95% | Direxion Funds |
| UPRO | ProShares UltraPro S&P500 | $4,753,879,190.00 | -$103,031,248.00 | -$369,736,872.00 | -$1,320,300,063.00 | 0.89% | ProShares |
| NVDL | GraniteShares 2x Long NVDA Daily ETF | $4,111,659,384.00 | -$711,519,141.00 | -$175,708,864.00 | -$3,710,898,453.00 | 1.05% | Graniteshares |
| TECL | Direxion Daily Technology Bull 3x Shares | $3,792,225,684.00 | -$42,360,719.00 | -$145,161,931.00 | -$700,372,301.00 | 0.85% | Direxion Funds |
| TMF | Direxion Daily 20+ Year Treasury Bull 3X Shares | $3,248,963,793.00 | -$412,622,967.00 | -$649,201,259.00 | -$2,034,301,541.00 | 0.76% | Direxion Funds |
Start a Free Trial to See Full Rankings | View & Modify in Stock Screener
Leveraged Fund Share Class Flows
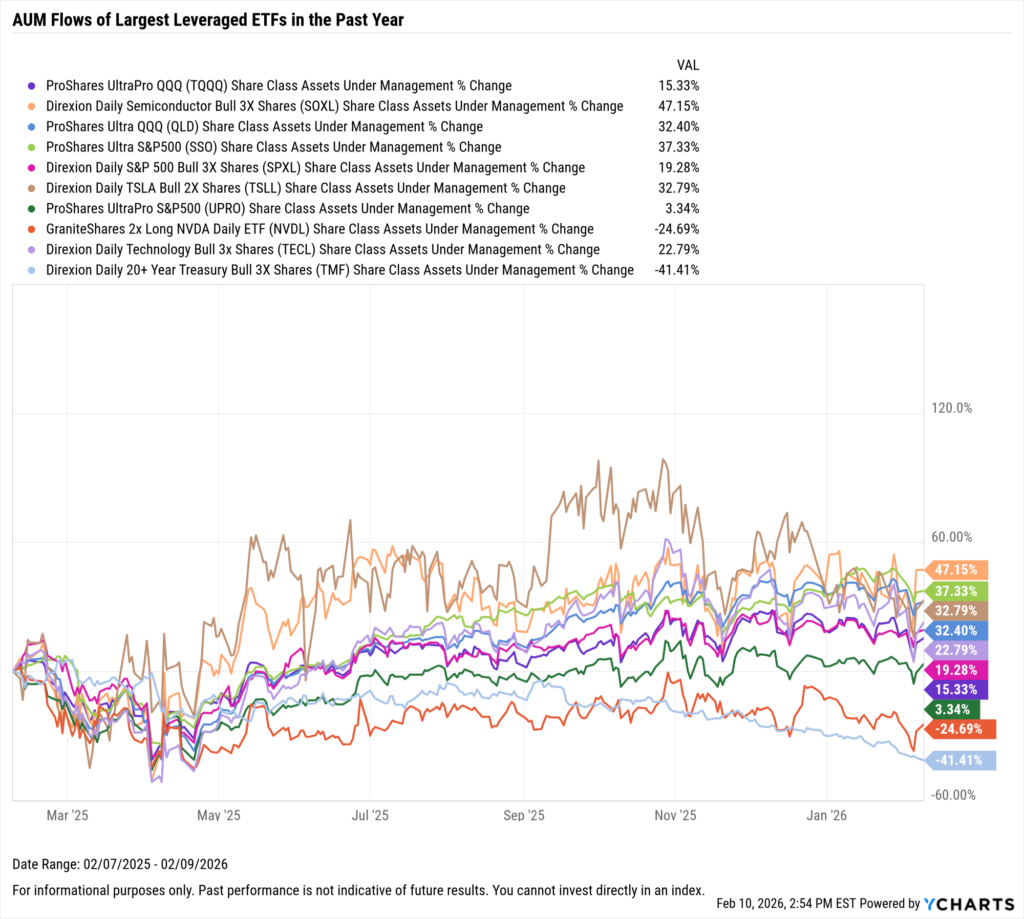
Download Visual | Modify in YCharts
Largest Inverse ETFs
These are the largest Inverse ETFs as of February 10, 2026.
| Symbol | Name | Share Class Assets Under Management | 1 Month Fund Share Class Flows | 3 Month Fund Share Class Flows | 1 Year Fund Share Class Flows | Net Expense Ratio | Fund Family |
|---|---|---|---|---|---|---|---|
| SQQQ | ProShares UltraPro Short QQQ | $2,030,833,728 | -$156,527,171 | -$1,138,870,480 | $1,919,194,043 | 0.95% | ProShares |
| SOXS | Direxion Daily Semiconductor Bear 3X Shares | $973,235,571 | $509,409,788 | $366,081,133 | $2,653,488,099 | 0.97% | Direxion Funds |
| SH | ProShares Short S&P500 | $934,458,811 | $154,501,909 | -$117,301,859 | $321,979,115 | 0.89% | ProShares |
| PSQ | ProShares Short QQQ | $752,186,597 | -$36,275,025 | -$28,638,180 | $131,550,347 | 0.95% | ProShares |
| KOLD | ProShares UltraShort Bloomberg Natural Gas | $637,549,223 | $451,156,410 | $437,095,424 | $221,054,159 | 0.95% | ProShares |
| SVOL | Simplify Volatility Premium ETF | $632,825,200 | -$19,887,074 | -$98,653,603 | -$485,734,643 | 0.66% | Simplify Asset Management |
| SPXU | ProShares UltraPro Short S&P500 | $475,487,253 | $14,635,276 | -$114,026,046 | $223,917,700 | 0.90% | ProShares |
| SDS | ProShares UltraShort S&P500 | $366,312,874 | -$13,578,636 | -$94,460,669 | $72,056,700 | 0.90% | ProShares |
| SPXS | Direxion Daily S&P 500 Bear 3X Shares | $311,831,418 | -$36,949,167 | -$98,318,822 | $180,373,744 | 1.02% | Direxion Funds |
| TBT | ProShares UltraShort 20+ Year Treasury | $263,541,416 | $13,664,294 | -$929,676 | -$20,786,375 | 0.93% | ProShares |
Start a Free Trial to See Full Rankings | View & Modify in Stock Screener
Inverse Fund Share Class Flows
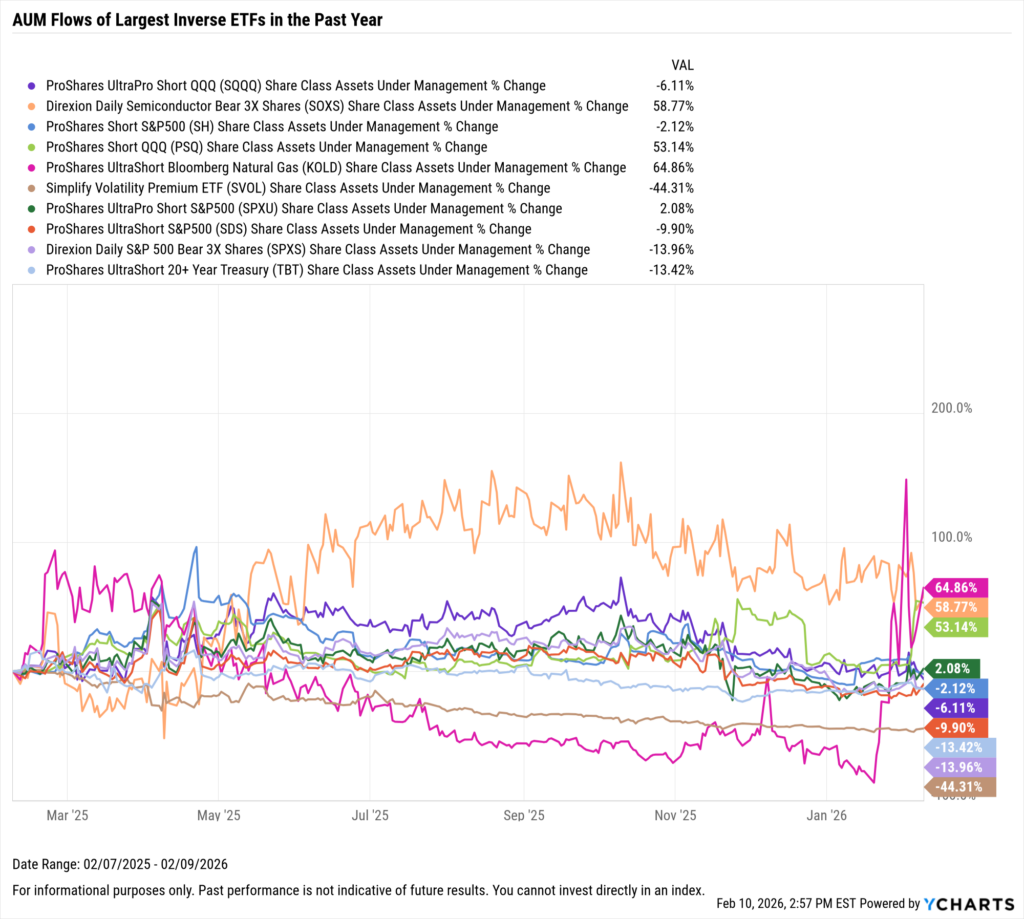
Download Visual | Modify in YCharts
Whenever you’re ready, there are 3 ways YCharts can help you:
1. Looking for a best-in-class data & visualization tool?
Send us an email at hello@ycharts.com or call (866) 965-7552. You’ll be directly in touch with one of our Chicago-based team members.
2. Want to test out YCharts for free?
Start a no-risk 7-Day Free Trial.
3. Download a copy of The Top 10 Visuals for Client and Prospect Meetings slide deck:
Disclaimer
©2026 YCharts, Inc. All Rights Reserved. YCharts, Inc. (“YCharts”) is not registered with the U.S. Securities and Exchange Commission (or with the securities regulatory authority or body of any state or any other jurisdiction) as an investment adviser, broker-dealer or in any other capacity, and does not purport to provide investment advice or make investment recommendations. This report has been generated through application of the analytical tools and data provided through ycharts.com and is intended solely to assist you or your investment or other adviser(s) in conducting investment research. You should not construe this report as an offer to buy or sell, as a solicitation of an offer to buy or sell, or as a recommendation to buy, sell, hold or trade, any security or other financial instrument. For further information regarding your use of this report, please go to: ycharts.com/about/disclosure.
Next Article
Largest Crypto ETFs: January 2026Read More →