May ETF Flows Show Investors Bracing for Rate Cuts and Reaching for Yield
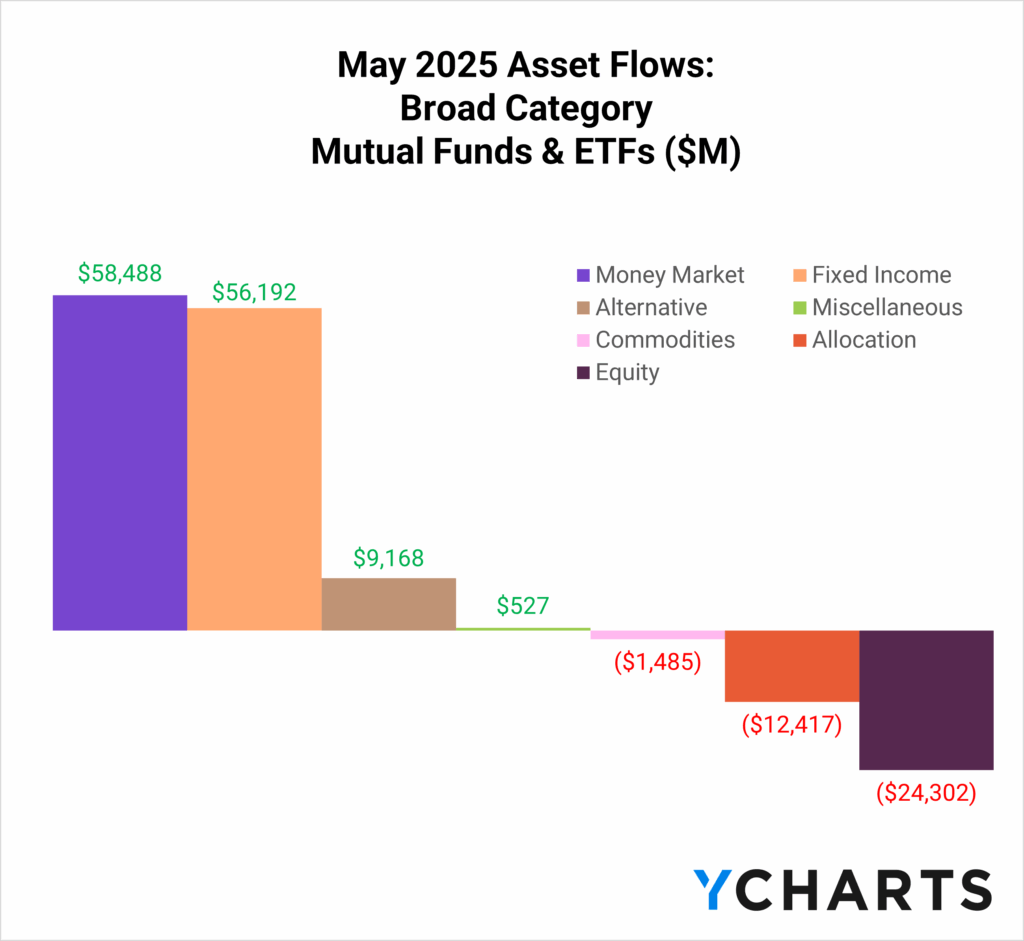
Following a turbulent April, investors took a more cautious stance in May. Across mutual funds and ETFs, equities experienced net outflows, while money market and fixed income strategies each attracted over $55 billion in net inflows.
Subscribe to the Fund Flow Report
Sign up for our free monthly Fund Flow Report to stay updated on how assets are moving in and out of these strategies:
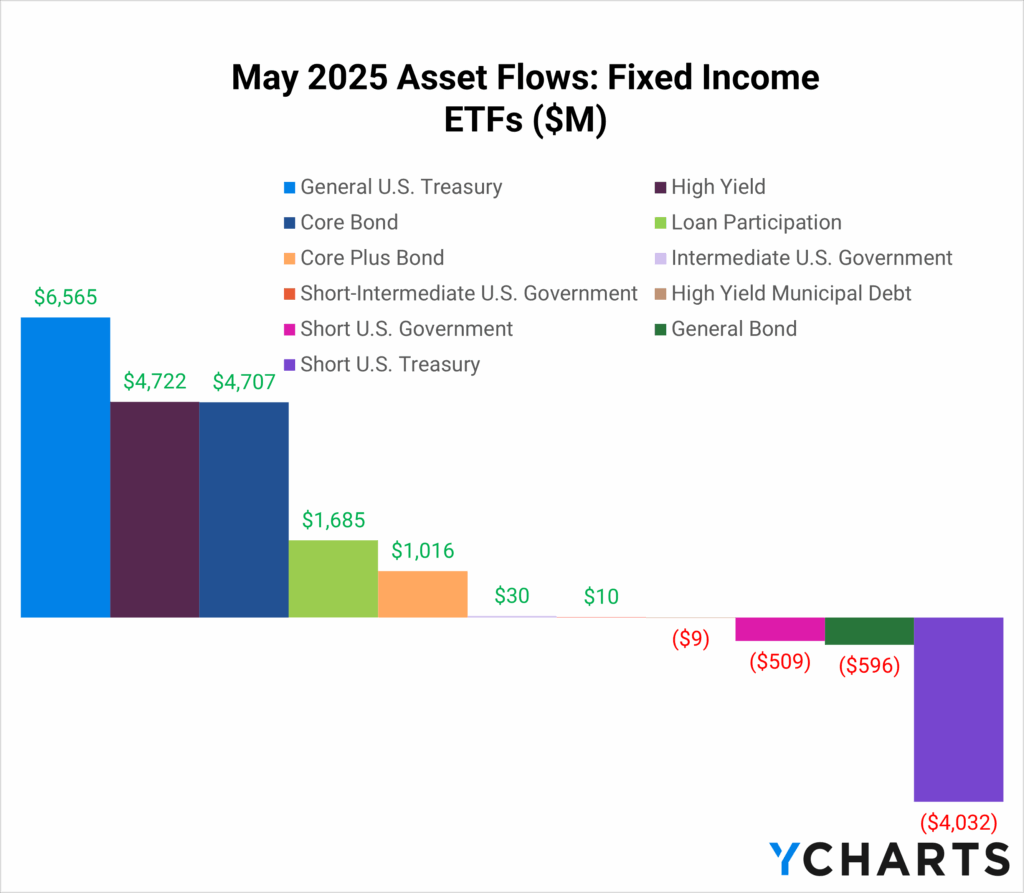
When we zoom in on fixed income ETFs specifically, U.S. Treasury ETFs emerged as the most popular category. Investors allocated $6.6 billion across the belly and long end of the curve, seeking to lock in elevated yields despite Moody’s downgrade of U.S. credit.
Subscribe to the Fund Flow Report
In addition to extending duration, investors also leaned into credit risk. High yield bond funds took in $4.7 billion, and investors further solidified the “40” part of their portfolio, pouring another $4.7 billion into core bond funds. Meanwhile, international income strategies saw a breakout month, pulling in $4.8 billion as investors looked to diversify away from U.S. credit exposure.
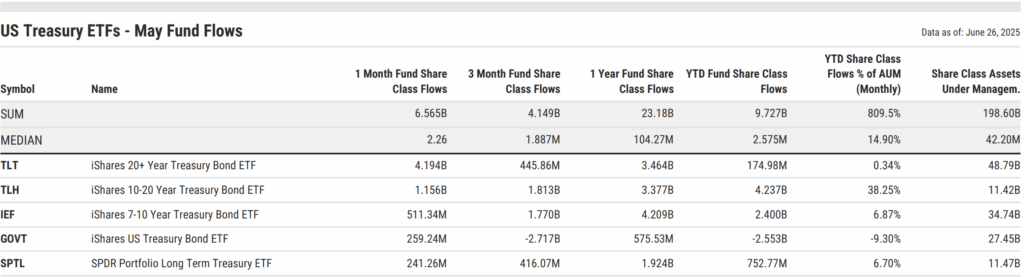
General U.S. Treasury ETF Leaders – May 2025
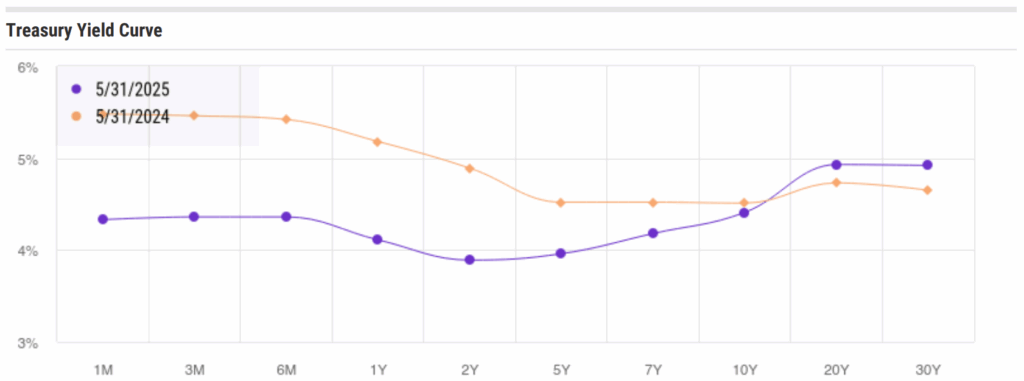
With yields at the long end of the curve sitting well above last year’s levels and some of the highest seen in the past decade, broad-based demand for Treasury exposure drove over $6 billion in net new assets to General U.S. Treasury ETFs.
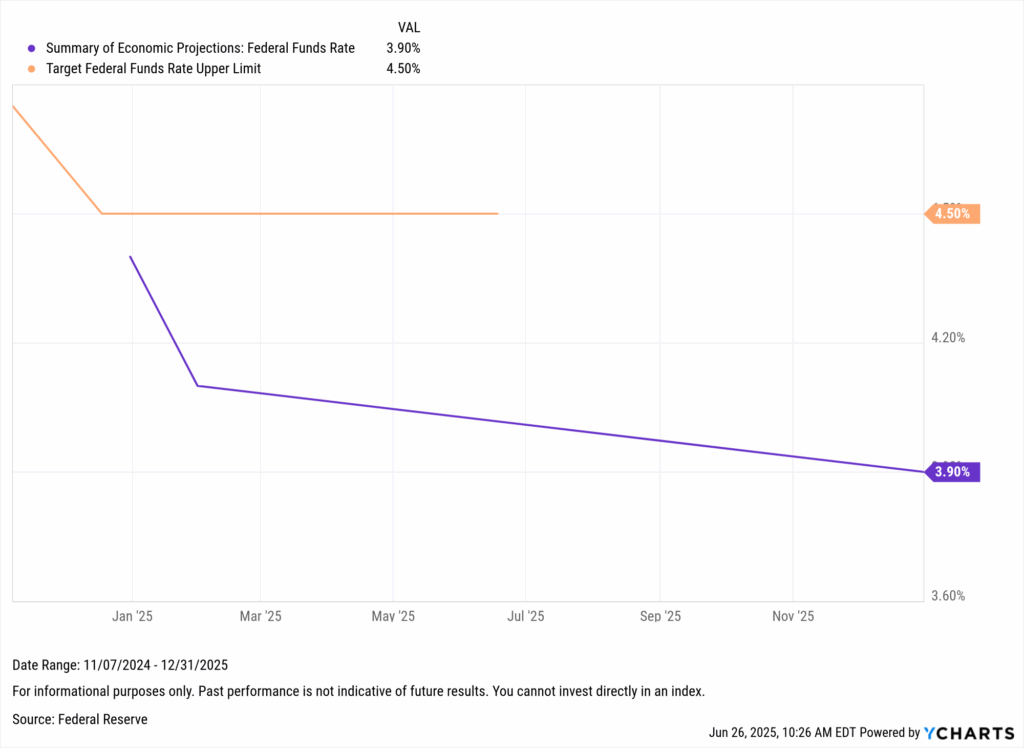
Much of this demand was likely driven by expectations for interest rate cuts later this year. According to the Fed’s June Summary of Economic Projections, the median dot plot suggests a cumulative 50 basis point reduction by year-end.
The iShares 20+ Year Treasury Bond ETF (TLT) led the way, bringing in $4.2 billion in net new assets during May, accounting for most flows within the category and reversing outflows from earlier in the year. Also riding the wave of duration extension were the iShares 10–20 Year Treasury Bond ETF (TLH), with $1.2 billion in inflows, and the iShares 7–10 Year Treasury Bond ETF (IEF), with $511 million, rounding out the top three.
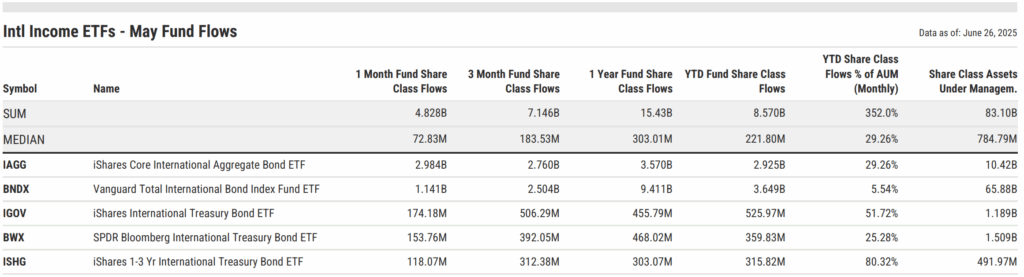
International Income ETFs: A Global Rotation in Full Swing
One of the clearest asset allocation trends in recent quarters has been the rotation into international strategies, particularly on the equity side. But in May, that theme broadened into fixed income.
International Income ETFs brought in $4.8 billion in May alone, continuing a year-long streak. The median fund in the category has seen inflows equivalent to nearly 30% of its AUM (as of May 31, 2025), an eye-popping stat that underscores the scale of this shift.
Several potential catalysts behind this trend exist. For one, the downgrade of U.S. credit and additional geopolitical tensions may have prompted some investors to look abroad. Additionally, with many major central banks globally signaling future rate cuts, international bonds offer the chance to lock in relatively high yields while diversifying geographically.
The top performer in the peer group was the iShares Core International Aggregate Bond ETF (IAGG), which had $3 billion in inflows. It was followed by the Vanguard Total International Bond Index Fund ETF (BNDX), which had $1.1 billion. The iShares International Treasury Bond ETF (IGOV) completed the top three with $174 million.
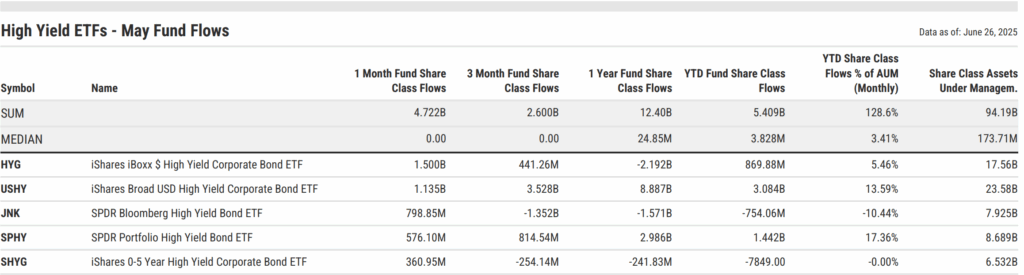
High Yield Bond ETFs: Credit Risk Back in Favor
While Treasury ETFs and core bond strategies benefited from a shift toward safety, the demand for yield didn’t stop there. High Yield Bond ETFs also attracted significant inflows in May, pulling in $4.7 billion, as investors reached down the credit spectrum to capture enhanced income.
At a time when credit spreads remain relatively tight, many investors appear comfortable taking on additional risk to supplement portfolio returns.
The iShares iBoxx $ High Yield Corporate Bond ETF (HYG) led the way, taking in $1.5 billion during the month. HYG was followed by a fellow member of its fund family, the iShares Broad USD High Yield Corporate Bond ETF (USHY), which added $1.1 billion. The SPDR Bloomberg High Yield Bond ETF (JNK) also saw a strong bounce-back month, pulling in $799 million despite being in net outflows year-to-date.
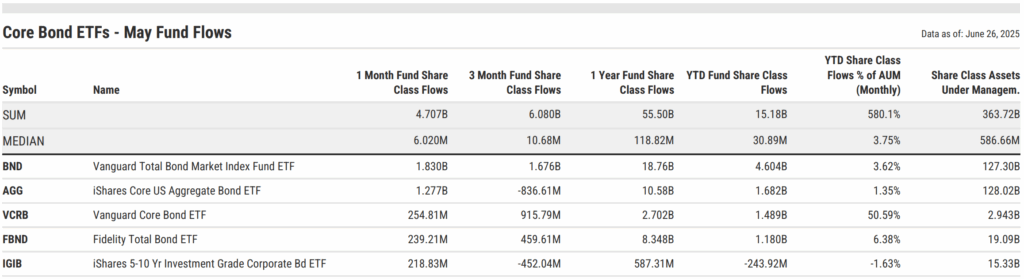
Core Bond ETFs: The “40” Reasserts Itself
As market participants recalibrated portfolios in response to macro uncertainty and shifting interest rate expectations, core bond ETFs continued to reaffirm their role as portfolio ballast. These strategies attracted $4.7 billion in net new assets in May alone, solidifying the “40” in traditional 60/40 allocations.
While Treasury ETFs saw flows concentrated at the long end of the curve, core bond ETFs benefited from their diversification across sectors and durations. Whether investors were rebalancing, de-risking, or front-running potential rate cuts, the asset class saw broad participation.
At the top of the leaderboard was the Vanguard Total Bond Market Index Fund ETF (BND), with $1.8 billion in May inflows, closely followed by the iShares Core U.S. Aggregate Bond ETF (AGG) at $1.3 billion. These two giants remain foundational exposures for many advisors and model portfolios.
But the month wasn’t just about the incumbents. The Vanguard Core Bond ETF (VCRB) continued to punch above its weight, pulling in $255 million and contributing to the year-to-date flows representing over 50% growth relative to its AUM (As of March 31, 2025). Active strategies also saw momentum, with the Fidelity Total Bond ETF (FBND) bringing in $239 million. The iShares 5-10 Yr Investment Grade Corporate Bond ETF (IGIB) was not far behind at $218 million, rounding out the top five.
As investors continue to reposition portfolios amid macro shifts, May’s fund flows underscore a clear theme: duration is back, credit risk is selective, and core bonds are foundational once again. To stay ahead of these trends, subscribe to our monthly Fund Flow Report and gain timely insights on where the money is moving—and why.
Whenever you’re ready, here’s how YCharts can help you:
1. Book time with our asset management specialists
2. Want to test out YCharts for free?
Start a no-risk 7-Day Free Trial.
3. Sign up for a copy of our Fund Flows Report and Visual Deck to stay on top of ETF trends:
Sign up to recieve a copy of our monthly Fund Flows Report:Disclaimer
©2025 YCharts, Inc. All Rights Reserved. YCharts, Inc. (“YCharts”) is not registered with the U.S. Securities and Exchange Commission (or with the securities regulatory authority or body of any state or any other jurisdiction) as an investment adviser, broker-dealer or in any other capacity, and does not purport to provide investment advice or make investment recommendations. This report has been generated through application of the analytical tools and data provided through ycharts.com and is intended solely to assist you or your investment or other adviser(s) in conducting investment research. You should not construe this report as an offer to buy or sell, as a solicitation of an offer to buy or sell, or as a recommendation to buy, sell, hold or trade, any security or other financial instrument. For further information regarding your use of this report, please go to: ycharts.com/about/disclosure.
Next Article
Fed’s June 2025 Rate Pause Explained: Why No Change Amid Cooling Inflation & Fed Dot Plot ProjectionsRead More →