
2026 Midterm Election: How Do Markets Historically Respond?
Interested in testing out YCharts for free?
Start 7-Day Free TrialMidterm Election Day in the United States is now less than three weeks away, and investors are eagerly awaiting the outcomes that will shape policy direction for the coming years. The current economic landscape presents a range of factors to weigh, including conflict in the Middle East, rising Treasury yields, inflation and affordability, and plenty more.
Despite this whirlwind of uncertainty, the S&P 500 has pushed higher by nearly 13% year-to-date and is on pace for a fourth consecutive year of 15% returns or better. The biggest question for clients and advisors alike is whether this trajectory can continue, and which signals are most important to follow heading into November 3rd.
Table of Contents
Historical Midterm Trends
Through just over three-quarters of 2026, the S&P 500 has shown resilience, climbing to a record high above 7,800. In the context of presidential cycles, this level of strength has been unusual.
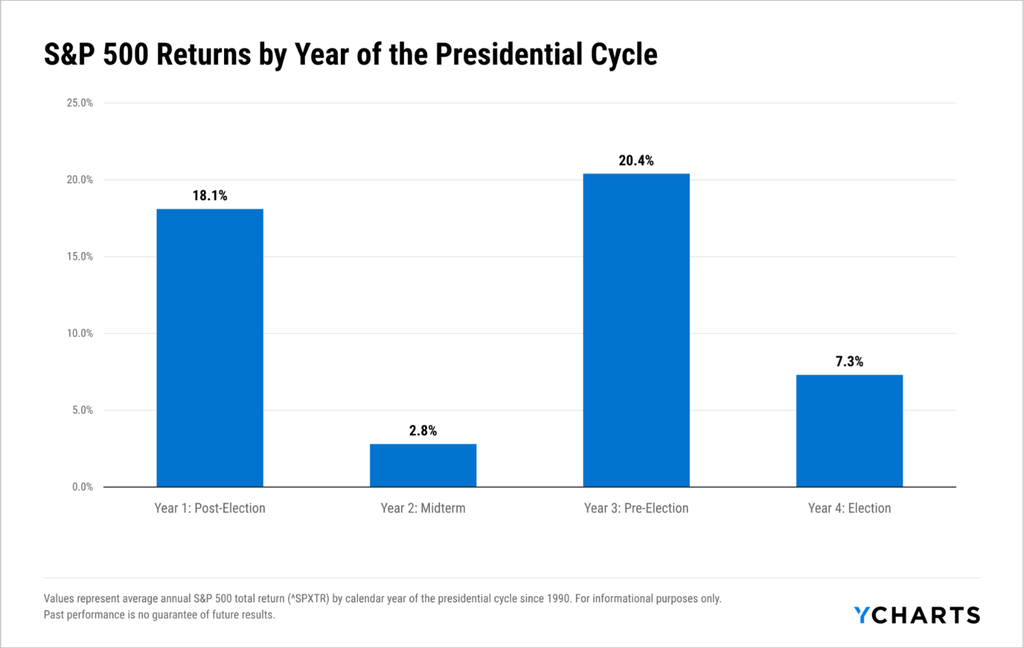
Since 1990, the second calendar year of a president’s term, or the midterm, has been the weakest on average by a wide margin, returning just 2.8%. That is more than 10 percentage points below where the market stands YTD, and a fraction of the 18-20% averages in years one and three of a presidency.
Click chart to enlarge →
Even though midterm years have been only modestly positive on average, 7 of the latest 10, including 2026, were positive YTD heading into Election Day.
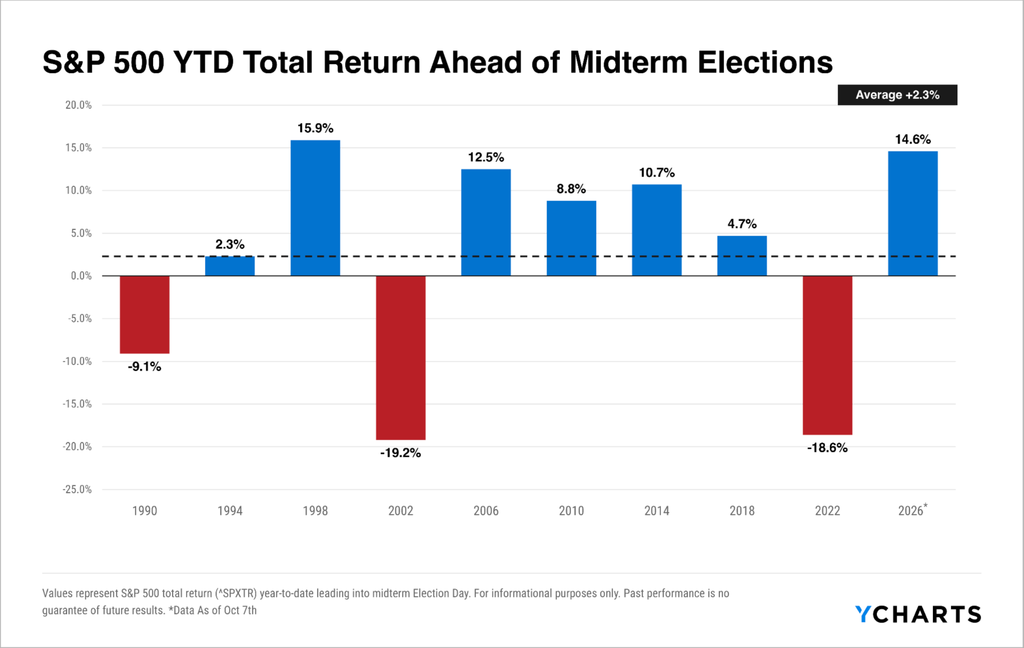
Data as of Oct 7th. Click chart to enlarge →
The three exceptions came in 1990, 2002, and 2022, all of which interestingly bottomed on nearly the same calendar dates, between October 9 and October 12, just weeks before the November election.
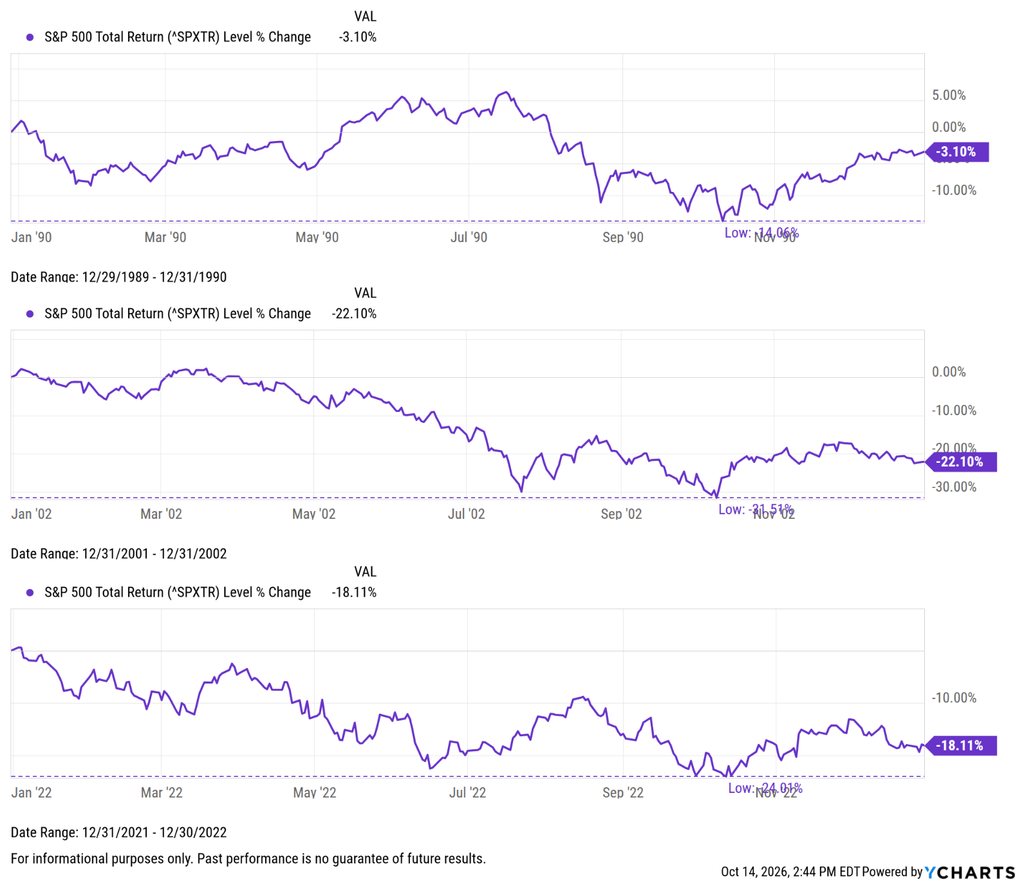
In 1990, the market gained 6% in the immediate month after the election, still the strongest one-month return of any midterm since. The other eight have averaged just 1.1% return over the same period.
The lead-up this year has been above average, and while the historical short-term reaction suggests there’s still room to grow, zooming out offers a far more interesting perspective.
The Perfect Track Record
In each of the nine previous cycles, the S&P 500 was higher 12 months after Election Day. The average total return over that period was 16.9%, with the best year coming after 1994, when the market advanced by over 30%.
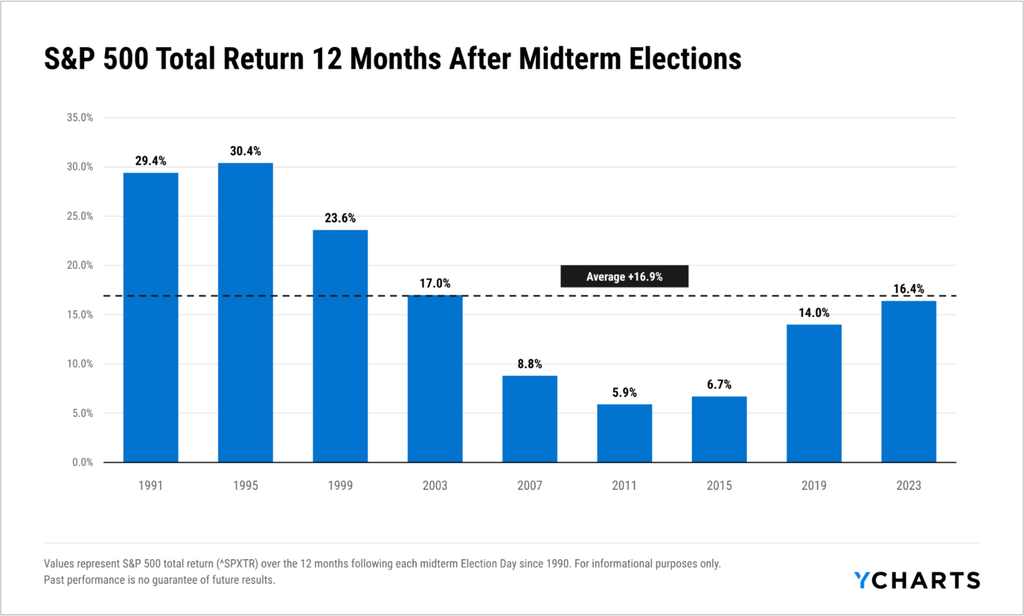
Click chart to enlarge →
This streak isn’t just limited to the past 35 or so years, either. Since the index was established in the 1950’s, there has never been a negative return in the 12 months following a midterm election.
Does this make 2026’s existing strength a threat to the streak, as markets are asked to push higher for another year? Not necessarily. Only 1998 entered Election Day with a stronger YTD gain than where we currently stand, and the market then delivered an additional 23.6% over the following 12 months.
It’s important to note that this period came in the middle of the dot-com boom. It showed that strength can beget strength, but it also served as a cautionary tale and a reminder of other factors at play, as the market would crash less than two years later.
What Happens Next?
So, for clients, is it really that simple? 19/19 previous cycles, 100% of the time, the market was higher once November came back around. Unfortunately, nothing is ever that easy, and as advertised on almost every chart, “Past performance is no guarantee of future results.”
While history might suggest that the next year should reward investors, the aforementioned macroeconomic backdrop will play a much more pivotal role in how the market actually pans out…
$40 Trillion and Counting
The United States public debt outstanding surpassed $40 trillion for the first time in August, and has more than doubled over the last 10 years. This problem is not confined to any one party in office, but the rate at which this number grows has been a longstanding concern.
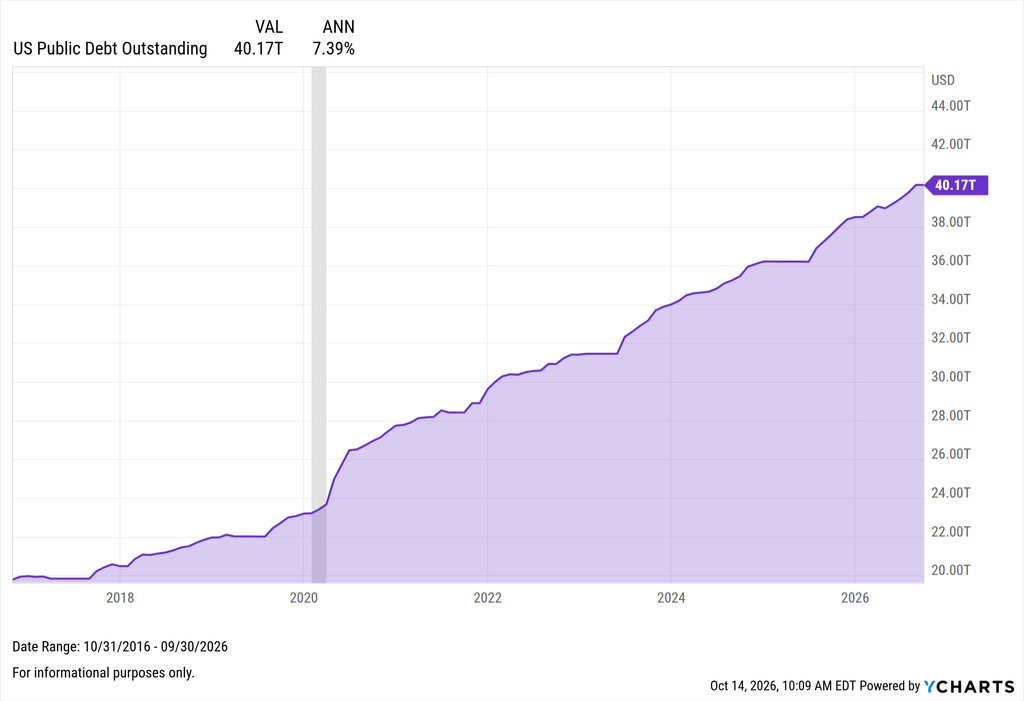
As spending continues to outpace revenue and the deficit widens, the Treasury is forced to issue more debt. Increased supply means investors can demand higher yields to hold it, and in recent months, that pressure has shown in the bond market.
10-Year Treasury Takes Off
In mid-September, the 10-year US Treasury surpassed 5% for the first time since 2007. Currently at 5.24%, it’s up 106 basis points this year and reached its highest level since 2002.
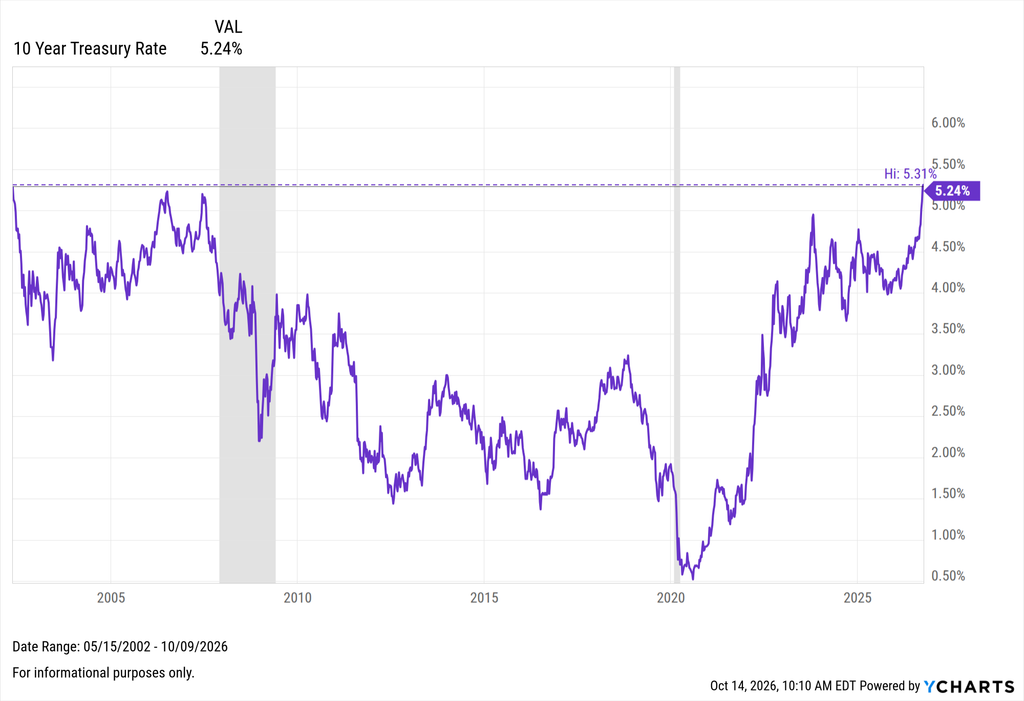
As investors weigh the fiscal risks of long-term lending to Washington, prices of existing bonds issued at lower rates are falling, but an opportunity to lock in yields not seen in decades has presented itself.
Whether yields can be reined in will play a major role in the year ahead. Falling yields would relieve pressure on borrowers and support current stock valuations, whereas rising yields would have the opposite effect.
Locked In, Priced Out
The housing market has long been a pain point for consumers, and elevated rates are making matters worse. The 30-year mortgage rate is back above 7% for the first time since January 2025, and the median existing single-family home costs $173,600 more than it did in 2016.
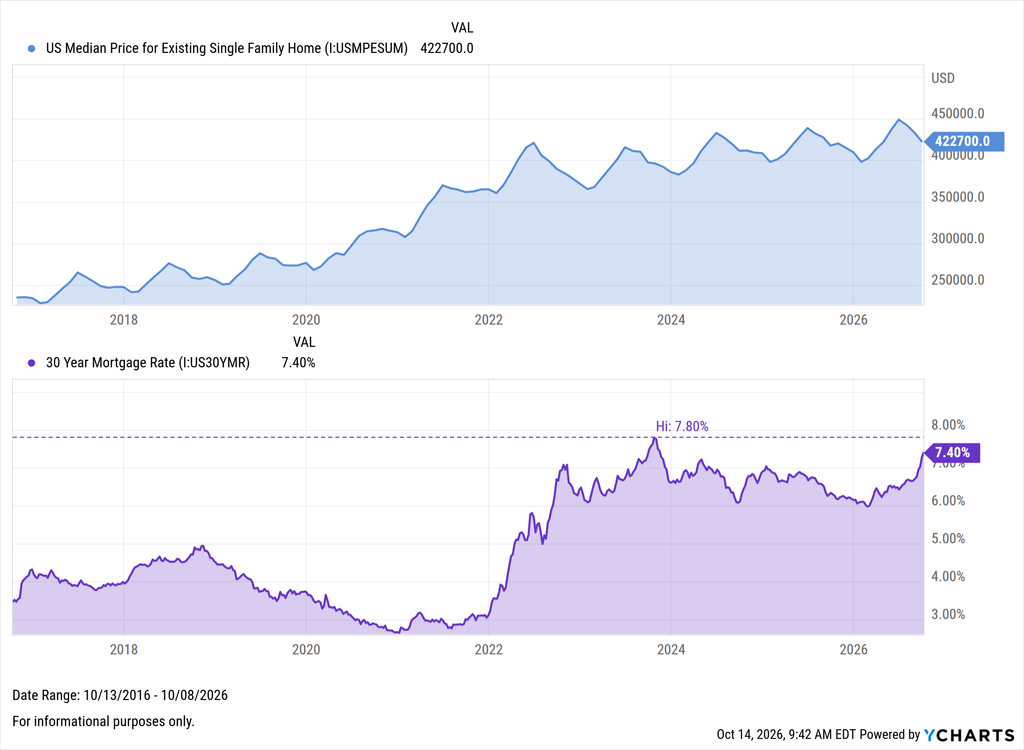
For many, homeownership feels unattainable in the current environment, while the millions locked into mortgages at 4% or below have no incentive to sell. The higher today’s rates climb, the longer this pandemic-era stalemate is likely to continue.
Two-thirds of Americans say they are very concerned about the cost of housing heading into November, and the market’s health is closely tied to the broader economy. Sales activity and affordability will be key to watch in the months ahead.
The Affordability Squeeze
Unsurprisingly, the number one concern for most Americans entering the November election is affordability. The Federal Reserve began to address this in September, hiking rates by 25 basis points for the first time since 2023, with Chair Kevin Warsh stating, “The plain fact is that inflation is too high and has been for too long.”
CPI, though it has come down from May’s high of 4.2%, remains well above the Fed’s 2% target. In fact, inflation has now run above that target rate for 68 consecutive months (both PCE & CPI). US Real Average Hourly Earnings have also declined year-over-year for the past six months, indicating that rising prices are outpacing pay increases.
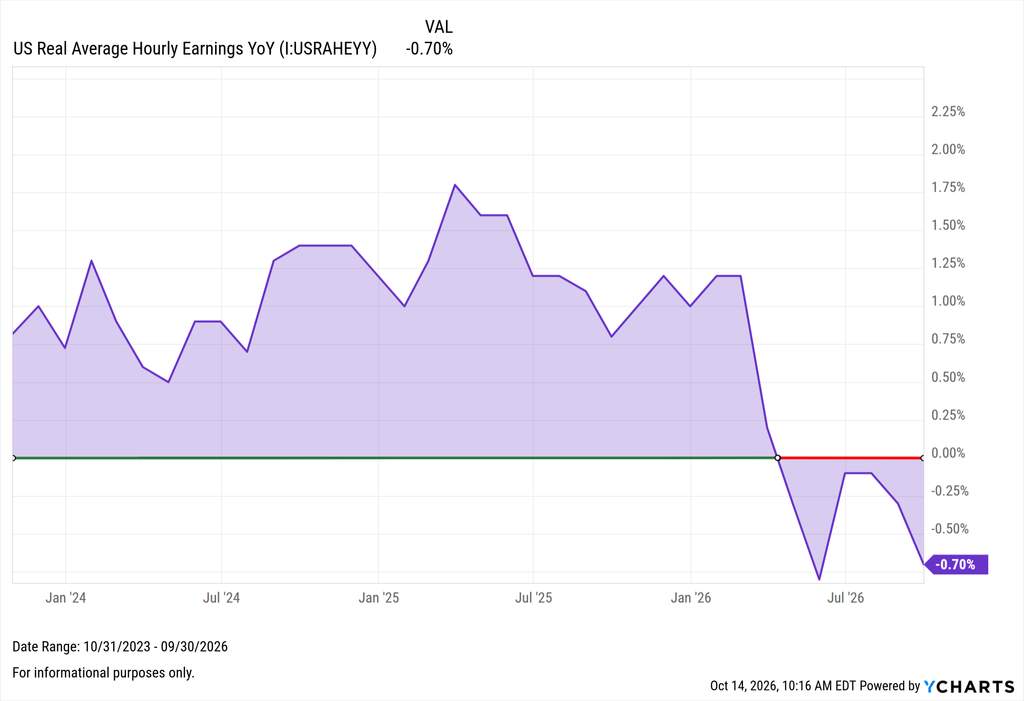
With less purchasing power, the ability to save, invest, and spend gets tighter. The US personal savings rate has fallen from 5.8% in early 2025 to 4.4% today, as consumers draw down from their savings in the face of higher costs.
Costly Conflict Abroad
The wildcard this year is the conflict in Iran, which has been ongoing for nearly eight months. Since it began on February 28, it has had lasting effects on the global economy and filtered down to everyday consumers, most notably through energy costs.
Brent Crude is up more than 104% year-to-date, reaching as high as $138 per barrel. Over the same period, the US Retail Gas price has risen from $2.93 per gallon to $4.50. In simple terms, roughly every two trips to the gas station today cost the same as three trips did in January.
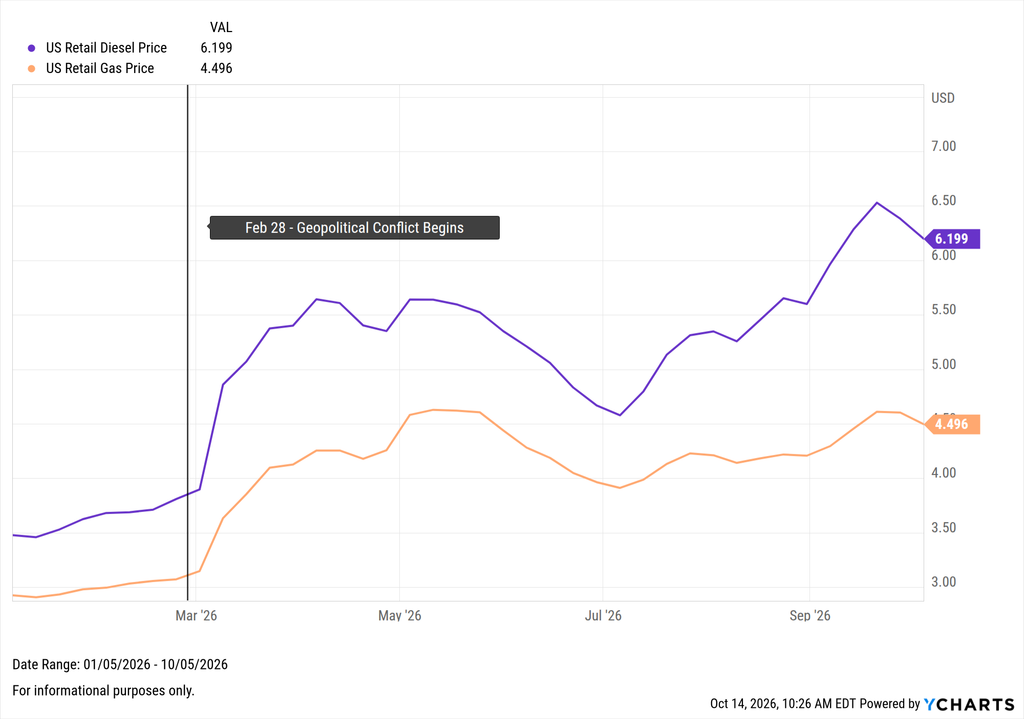
US Retail Diesel has had an even more extreme reaction, reaching an all-time high of $6.53 per gallon in September and remaining up 78% YTD. Diesel powers the ships, trucks, and equipment that drive the American economy, so while its higher prices show up less directly, they’re passed through to consumers in countless other ways.
Politics vs. Portfolios
Markets have a strong track record following midterm elections, but this November brings its own set of circumstances. Elevated yields, stubborn inflation, and the conflict in Iran will likely shape the year ahead, and whether the streak continues will depend on how these play out.
For clients, the most damaging response in the face of uncertainty is a reactive one. Election seasons tend to amplify that impulse, but investors who move in and out of the market based on political party have significantly diminished their returns throughout history.
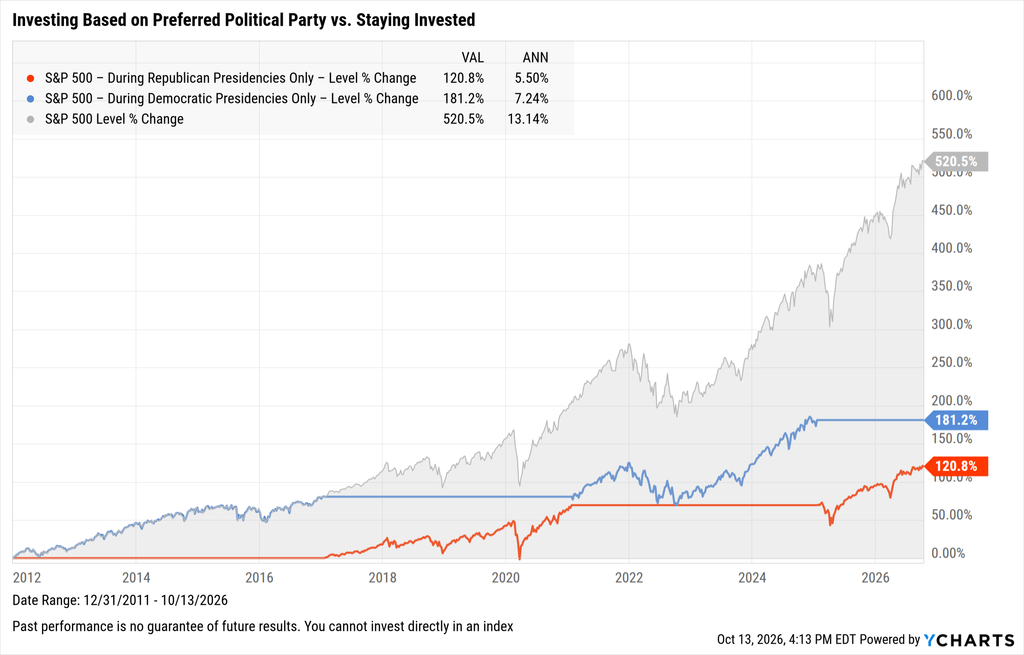
Policy matters, but portfolios built on long-term fundamentals have consistently outperformed those built on election outcomes, and the cost of sitting out only compounds over time.
When clients call with questions before November 3, be ready with more than just reassurance. Show them what history says, what’s driving markets today, and why a long-term plan has mattered more than any single election.
Frequently Asked Questions (FAQ):
When is the 2026 midterm election?
The 2026 midterm election is on Tuesday, November 3, 2026. Midterms take place in the second year of a presidential term, halfway between presidential elections.
How does the stock market perform after midterm elections?
The S&P 500 was higher 12 months after Election Day in all nine midterm cycles since 1990, with an average total return of 16.9%.
Does a strong market heading into a midterm signal a pullback?
Not historically. In the three midterm years with double-digit YTD gains heading into Election Day (1998, 2006, and 2014), the S&P 500 continued to rise over the following 12 months.
Should investors change their portfolios based on an election?
History suggests that reacting to election outcomes can diminish results. Portfolios built on long-term fundamentals have historically served investors far better.
Ready to Move On From Your Investment Research and Analytics Platform?
Follow YCharts Social Media to Unlock More Content!
Next Article
Liquid Alt Fund Leaderboard: September 2026Read More →