Monthly Market Wrap: December 2022
Welcome back to the Monthly Market Wrap from YCharts, where we break down the most important market trends for advisors and their clients every month. As always, feel free to download and share any visuals with clients and colleagues, or on social media.
Speaking of visuals: check out our brand-new Monthly Market Wrap slide deck, containing all charts featured in the Market Wrap + more.
Want the Monthly Market Wrap slide deck sent straight to your inbox? Subscribe below:
December 2022 Market Summary
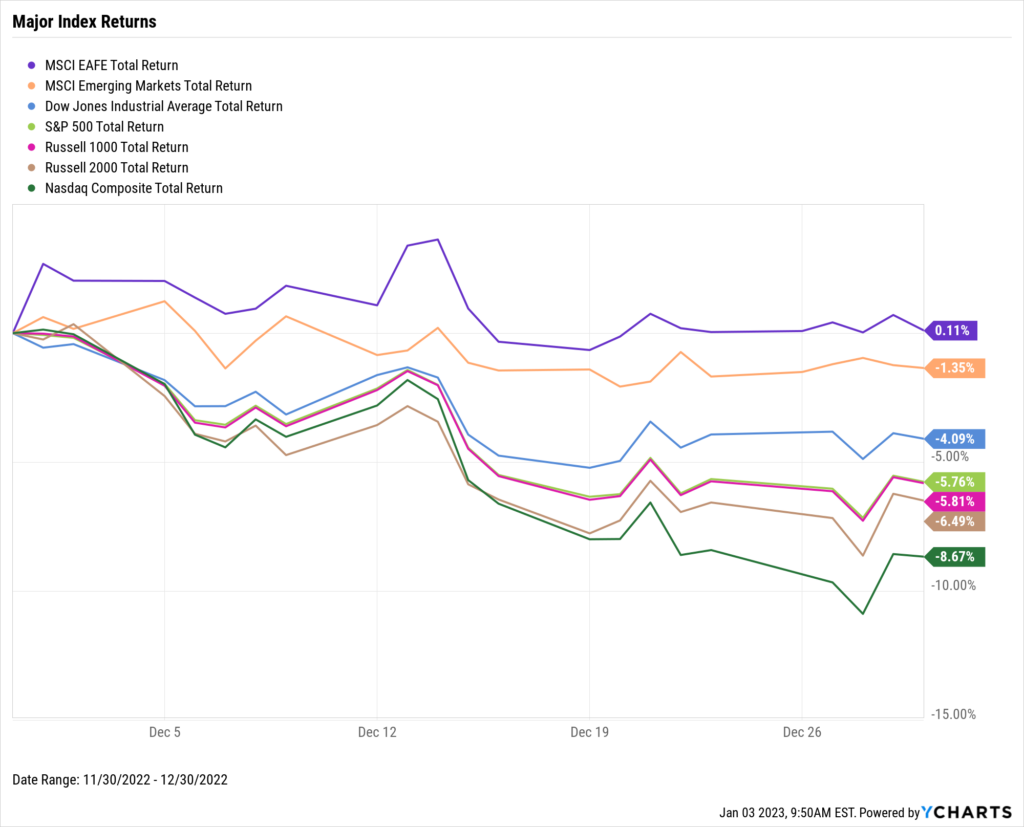
Stocks were mostly negative in the final month of 2022. The Dow Jones Industrial Average fell 4.1%, the S&P 500 dipped 5.8%, and the NASDAQ sank 8.7%. Continuing rate hikes from the Federal Reserve, investors’ unease surrounding Q4 earnings, and uncertain outlooks for 2023 halted the two-month equities rally. Only Emerging Markets finished December in the black, up 0.1%. The Dow closed out 2022 down 6.9%, the S&P ended the year off 18.1%, and the NASDAQ finished 32.5% lower.
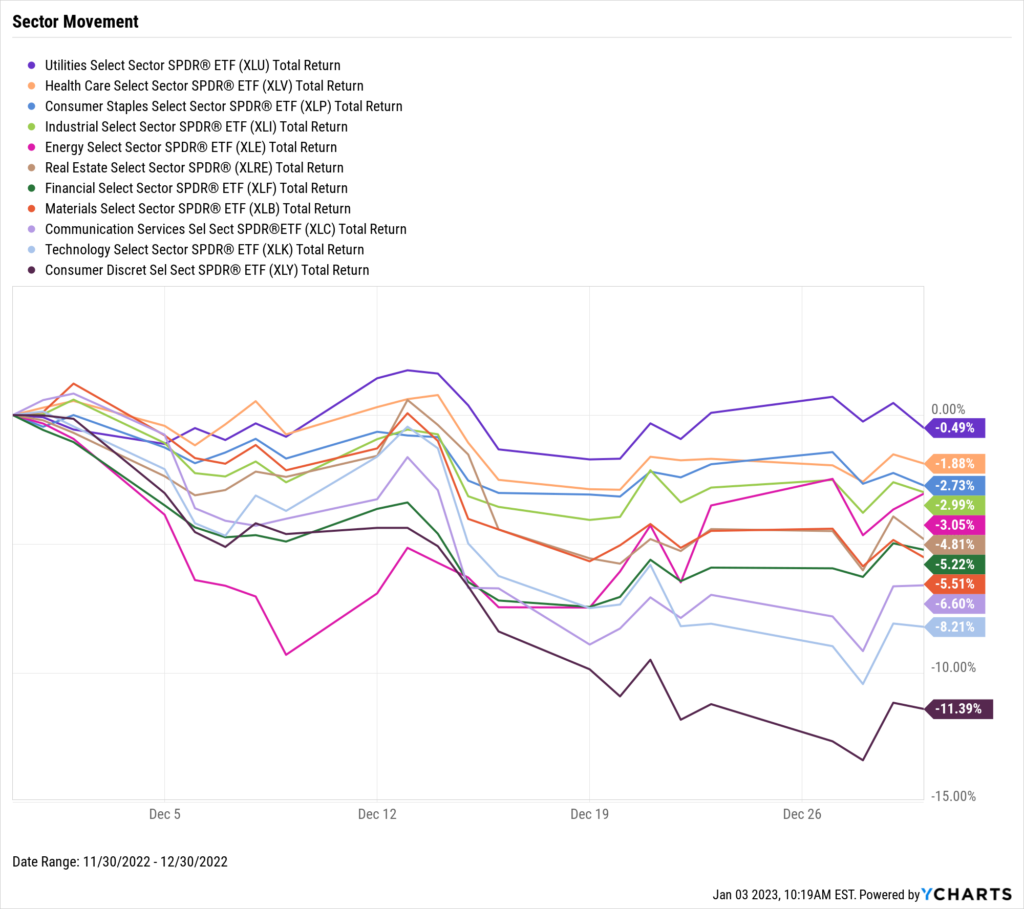
While all eleven S&P 500 sectors were higher in both October and November, they all finished lower in December. Energy and Utilities were the lone gainers on the year, ending 2022 up 64.2% and 1.4%, respectively. Consumer Discretionary’s December-worst 11.4% decline also made it the worst-performing sector in 2022, down 37.6%.
Inflation cooled for the fifth straight month to 7.11% YoY, and core inflation was slightly lower as well. US New Single-Family Home Sales rose for the second straight month, but Existing Home Sales experienced its tenth straight monthly decline. The median national existing home price slipped another 2.1% as a result. Lastly, the average price of regular gas at the pump fell to its lowest level since July 2021
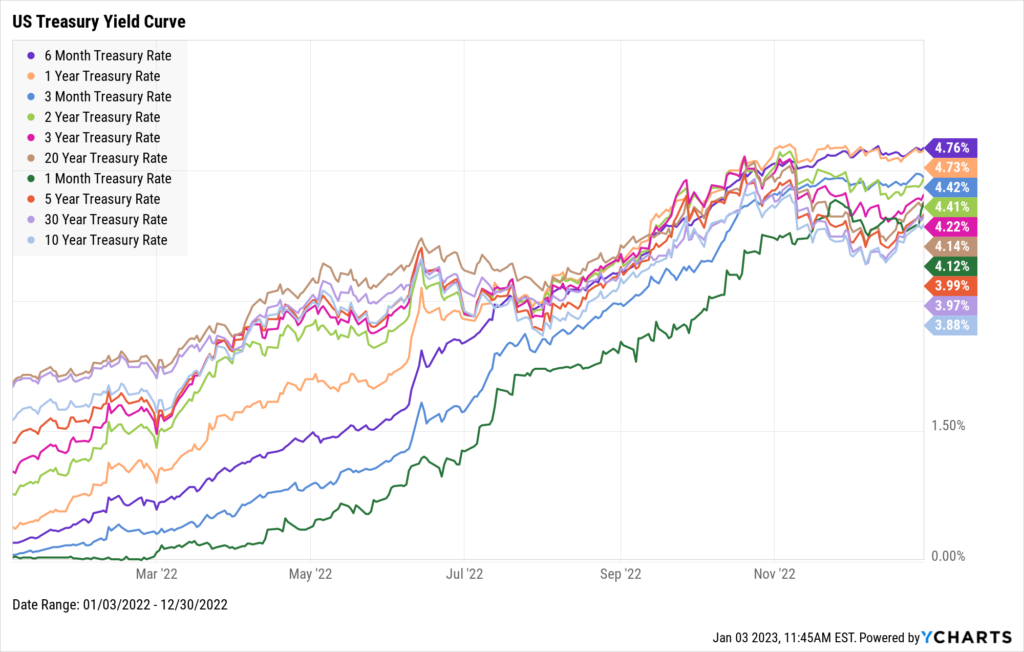
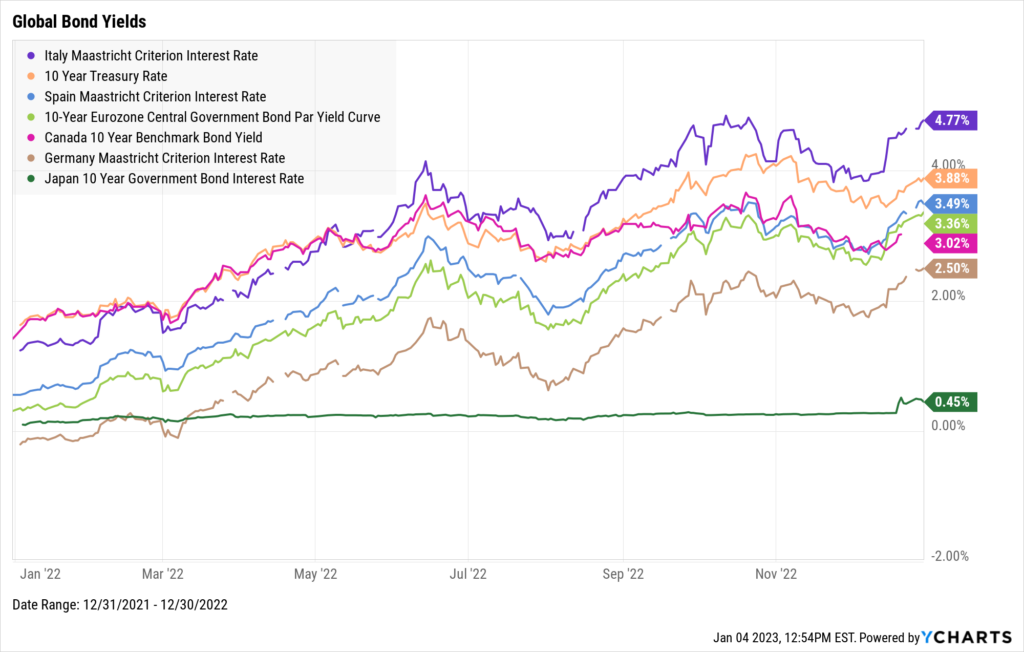
MoM Treasury yields rose across the board with the exception of the 1-Year Treasury Bill, which declined by one basis point. The 6-Month Treasury Bill stood atop the US Treasury yield curve at 4.76%. The 10 Year was at the bottom, though its increase of 20 basis points to 3.88% was the largest MoM increase of all US treasuries. Worldwide, the long-term bond rates of Spain, Germany, and Italy all rose by over 50 basis points in December.
Jump to Fixed Income Performance
Want access to full-year charts and data as well? Download our all-new Monthly Market Wrap Slide Deck for more:
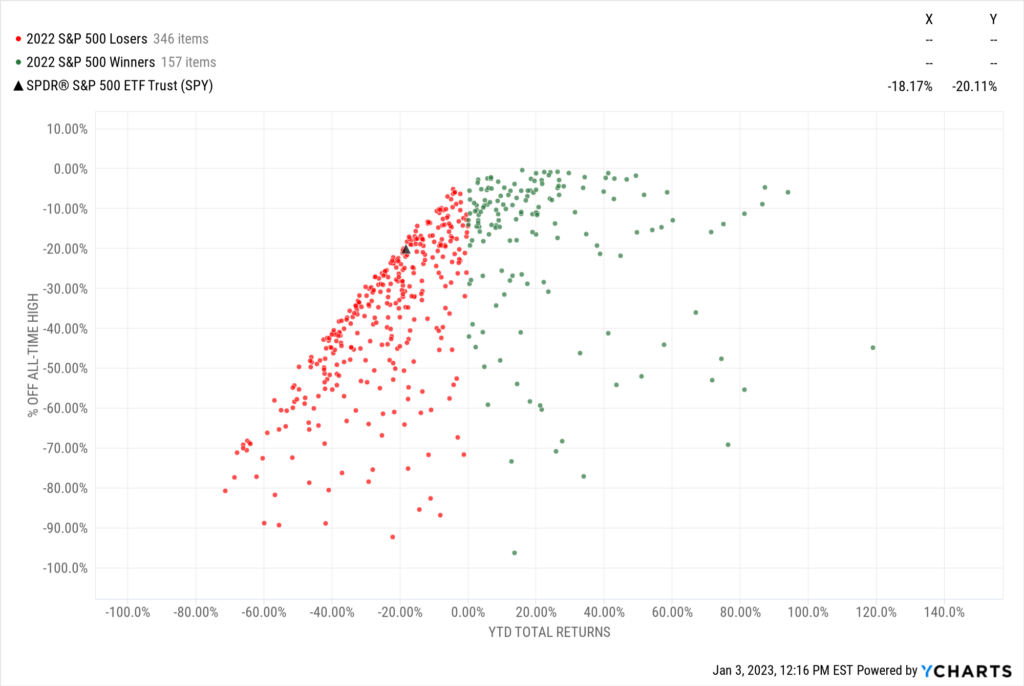
Off the YCharts! Winners and Losers of 2022
Well folks, another year has come and gone. Though 2022 surely had some bright spots (we’re still looking for them), equity investors were probably anxious to close the book on it.
Out of 503 constituents in the S&P 500, just 157 were positive in 2022 and the remaining 346 finished in the red.
The worst performer? Generac Holdings (GNRC), which logged a 71.4% decline.
On the flip side, investors in Occidental Petroleum (OXY) benefitted massively from an economic rebound that was accompanied by soaring energy prices. The stock surged 119.1% in 2022.
Equity Performance
Major Indexes
Download Visual | Modify in YCharts | View Below Table in YCharts
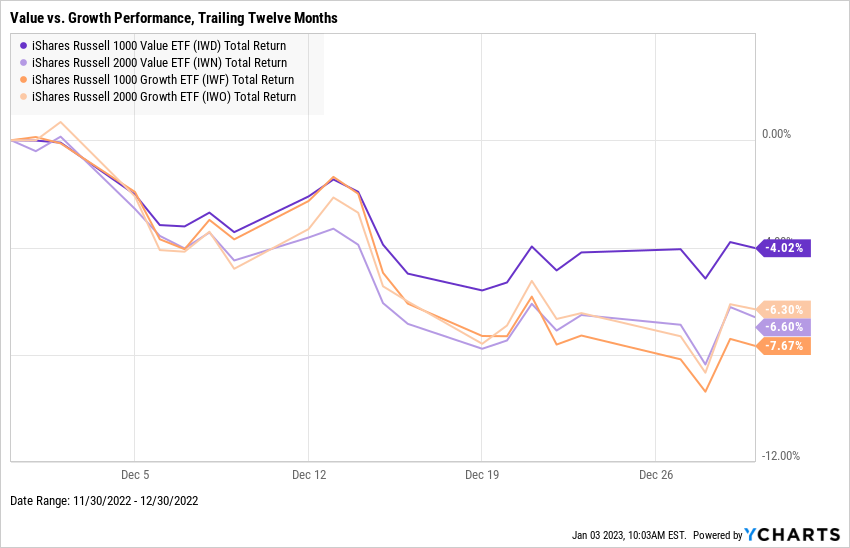
Value vs. Growth Performance, Trailing Twelve Months
Large-cap value stocks, represented by the iShares Russell 1000 Value ETF (IWD), slipped 4.0% in December after logging two consecutive months of gains. Large-cap growth stocks (IWF) sank 7.7%, while mid-cap growth (IWO) and value (IWN) stocks ended December down 6.3% and 6.6%, respectively.
Quite consistently throughout 2022, value was the relatively better equity class, and particularly large-cap value. IWD ended 2022 down 7.7%, whereas its mid-cap counterpart IWN was off 14.8%. As for growth, large-caps fared worse in 2022, plummeting 29.3% on the year vs. 26.3% for mid-cap growth.
Download Visual | Modify in YCharts
US Sector Movement
Download Visual | Modify in YCharts | View Below Table in YCharts
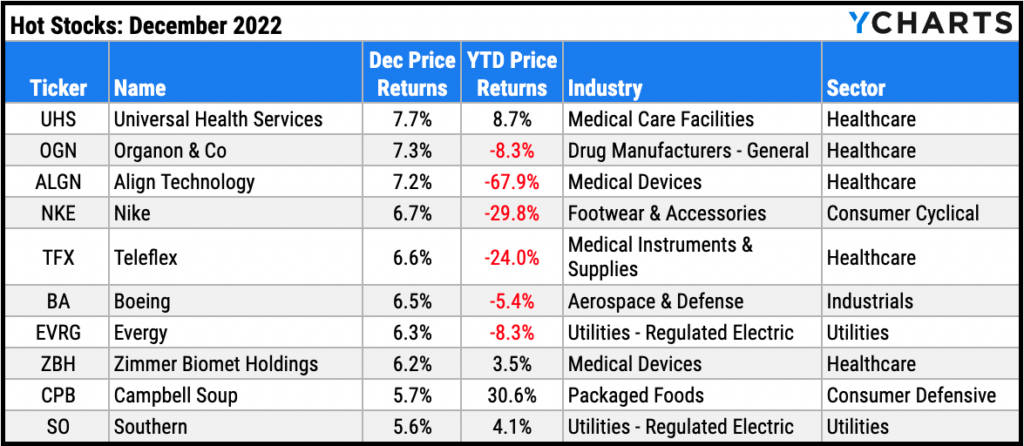
Hot Stocks: Top 10 S&P 500 Performers of December 2022
Universal Health Services (UHS): 7.7% gain in December
Organon & Co (OGN): 7.3%
Align Technology (ALGN): 7.2%
Nike (NKE): 6.7%
Teleflex (TFX): 6.6%
Boeing (BA): 6.5%
Evergy (EVRG): 6.3%
Zimmer Biomet Holdings (ZBH): 6.2%
Campbell Soup (CPB): 5.7%
Southern (SO): 5.6%
Download Visual | Modify in YCharts
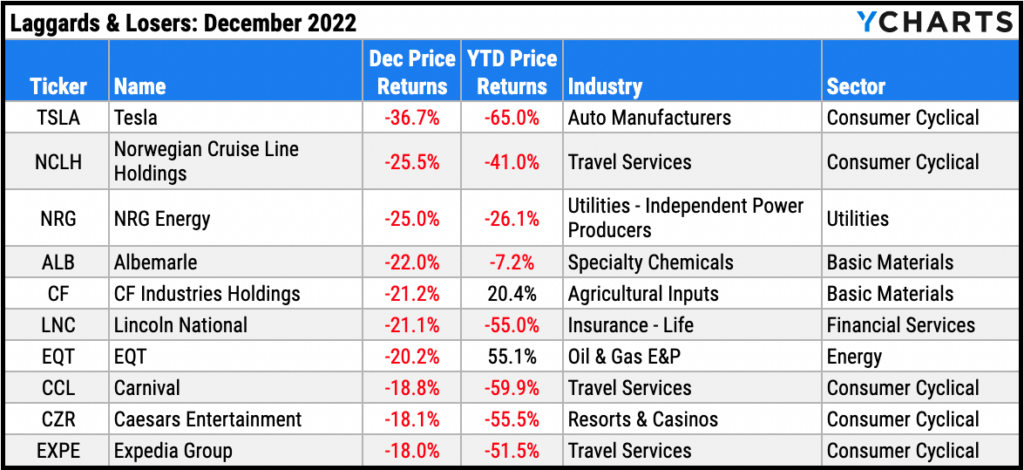
Laggards & Losers: 10 Worst S&P 500 Performers of December 2022
Tesla (TSLA): -36.7% decline in December
Norwegian Cruise Line Holdings (NCLH): -25.5%
NRG Energy (NRG): -25.0%
Albemarle (ALB): -22.0%
CF Industries Holdings (CF): -21.2%
Lincoln National (LNC): -21.1%
EQT (EQT): -20.2%
Carnival (CCL): -18.8%
Caesars Entertainment (CZR): -18.1%
Expedia Group (EXPE): -18.0%
Download Visual | Modify in YCharts
Featured Market & Advisor News
Home Prices Slip For Fourth Month With U.S. Sales Market Slowing (FA-Mag)
How Many Clients Switched Advisors Since 2020? (YCharts)
Vanguard to launch municipal bond index ETF (InvestmentNews)
What Happens After a Fed Rate Hike? (YCharts)
WealthStack Research Reveals Big Gaps in How Advisory Firms Use Tech (WealthManagement.com)
Value vs Growth: 2022 in Review, Top Stocks & ETFs (YCharts)
Economic Data
Employment
November’s unemployment rate was unchanged at 3.7%, but the labor force participation rate dipped another 0.1 percentage point to 62.1%. Labor force participation stands 1.2 points below its February 2020 high. 263,000 jobs were added in November, which topped nonfarm payroll expectations of 200,000 but paled in comparison to November 2021’s gain of 647,000.
Consumers and Inflation
The YoY US Inflation Rate cooled by 0.64 percentage points to 7.11%, marking its fifth straight monthly decline. YoY US Core Inflation dipped slightly to 5.96%. Both personal spending and the MoM US Consumer Price Index were up 0.1%. Lastly, the Federal Reserve raised the Upper Limit Target Federal Funds Rate by 50 basis points to 4.5% at its December 14th meeting, the first rate hike in the last five meetings to be less than 75 basis points.
Production and Sales
November’s US ISM Manufacturing PMI slipped for the seventh straight month to 48.4, keeping the index into contraction territory (below 50.0). US Retail and Food Services Sales declined 0.6% MoM in November. Inventories took a pause in its climb back to historically normal levels, as the US Retail Trade Inventory/Sales Ratio slipped to 1.22 as of October.
Housing
Two months removed from a harsh 13.5% decline, US New Single-Family Home Sales increased 5.8% in November. Existing Home Sales data was less rosy, however; November’s 7.7% decline marked the tenth straight monthly drop for sales of existing homes. It was also the largest MoM decline since February 2022. The slowdown translated into a fifth straight monthly decline for the Median Sales Price of Existing Homes, falling 2.1% to $370,700. Lastly, 15-Year and 30-Year Mortgage Rates remained about flat at 5.68% and 6.42%, respectively.
Commodities
The price of gold rose 3.4% MoM to $1,813.80 per ounce as of December 30th, making for a 0.4% increase in 2022. Both WTI and Brent tumbled by double-digit percentages within December but rallied back to end the month down only slightly. WTI’s spot price settled at $79.45 at the end of December, down 1.3% MoM, and Brent slipped 3.7% to $82.45. Nonetheless, the intra-month decline in crude oil prices brought savings at the pump. The average price of regular gas fell 44 cents (-12.2%) in December to $3.20 per gallon.
Cryptocurrencies
After historic gains in 2021, cryptocurrencies logged equally historic declines in 2022. Ethereum fared the worst in 2022, plummeting 67.7% to settle at $1,199. Bitcoin tumbled 64.8% to $16,604. Binance Coin lost slightly over half its value in 2022, down 52.6% to a price of $245.84 per coin.
Fixed Income
US Treasury Yield Curve
1 Month Treasury Rate: 4.12%
3 Month Treasury Rate: 4.42%
6 Month Treasury Rate: 4.76%
1 Year Treasury Rate: 4.73%
2 Year Treasury Rate: 4.41%
3 Year Treasury Rate: 4.22%
5 Year Treasury Rate: 3.99%
10 Year Treasury Rate: 3.88%
20 Year Treasury Rate: 4.14%
30 Year Treasury Rate: 3.97%
Download Visual | Modify in YCharts
Global Bonds
Italy Long Term Bond Interest Rate: 4.77%
10 Year Treasury Rate: 3.88%
Spain Long Term Bond Interest Rate: 3.49%
10-Year Eurozone Central Government Bond Par Yield: 3.36%
Canada 10 Year Benchmark Bond Yield: 3.02%
Germany Long Term Bond Interest Rate: 2.50%
Japan 10 Year Government Bond Interest Rate: 0.48%
Download Visual | Modify in YCharts
Have a great January and 2023! 📈
If you haven’t yet, subscribe to receive the YCharts Monthly Market Wrap Slide Deck each month straight to your inbox:
Next Article
How Many Clients Switched Advisors Since 2020?Read More →