Monthly Market Wrap: October 2022
Welcome back to the Monthly Market Wrap from YCharts, where we review and break down the most important market trends for advisors and their clients every month. As always, feel free to download and share any visuals with clients and colleagues, or on social media.
Want the Monthly Market Wrap sent straight to your inbox? Subscribe below:
October 2022 Market Summary
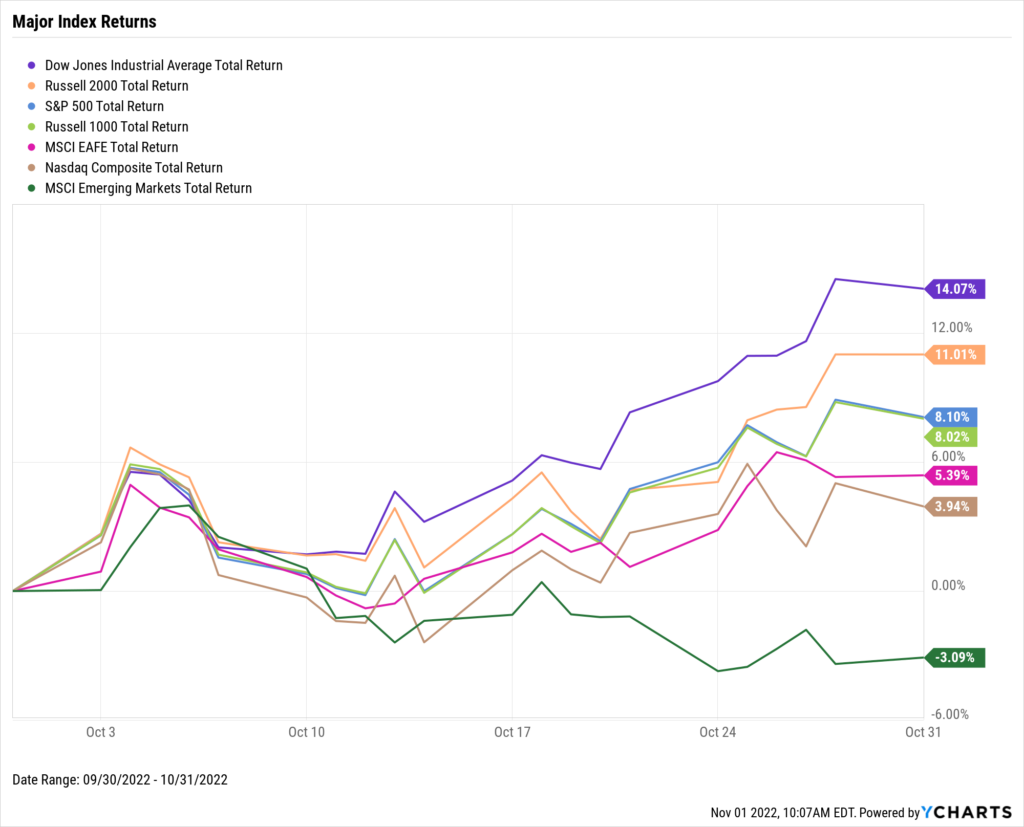
Stocks posted strong gains in October, what has historically been the worst month of the year for equities. The Dow Jones Industrial Average surged 14.1%, the S&P 500 advanced 8.1%, and the NASDAQ tacked on 3.9%. These gains follow the worst month for US equities since March 2020. Year-to-date, the S&P 500 dug itself out of bear market territory but is still down 17.7%. The NASDAQ is off 29.3%, and the Dow is only 8.4% lower.
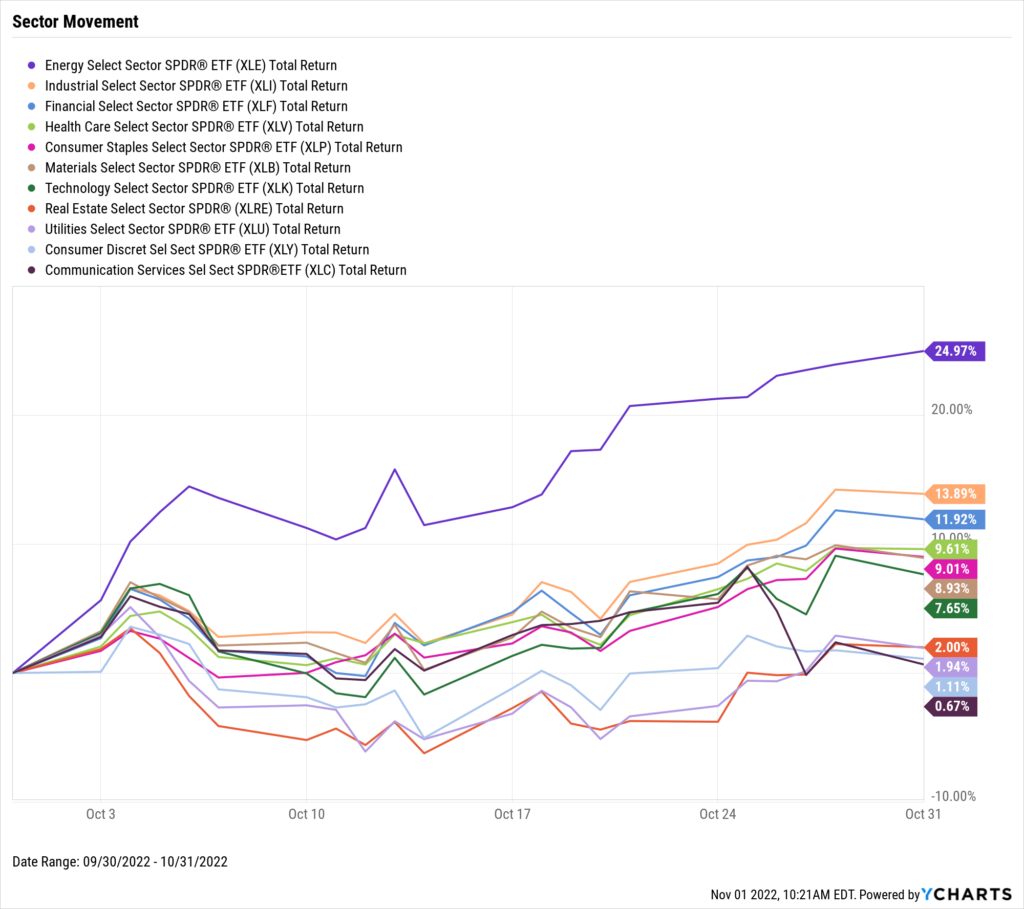
Unlike September, in which no sector finished in the black, all eleven sectors had a plus sign next to their name in October. Energy was up a whopping 25.0% thanks to rebounding oil prices, followed by a 13.9% jump for Industrials and 11.9% for Financials. The two relative laggards were Consumer Discretionary and Communication Services. Amazon (AMZN) weighed on Consumer Discretionary after reporting disappointing Q3 earnings—its stock sank 9.3% in October. Meta Platforms (META) did the same to Communication Services when its earnings miss caused the stock to plummet 30.4% for the month.
Mortgage rates surged to levels not seen in two decades. The 30-Year Mortgage Rate closed out October at 7.08%, surpassing 7% for the first time since 2002. The 15-Year reached 6.36% at month’s end, marking its highest level since 2007. Mortgage rates have increased 2.7x and 2.3x respectively since a year ago. On the inflation front, September’s inflation rate was little changed from August, but core inflation increased for the second consecutive month.
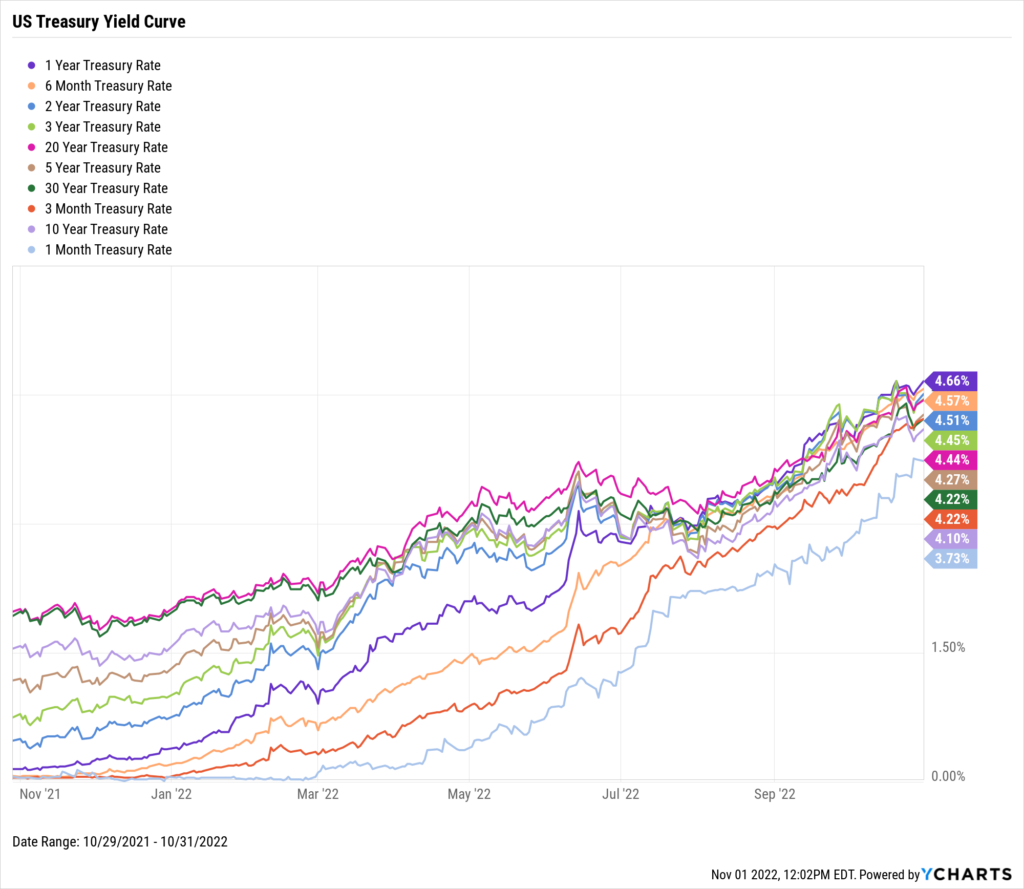
The yield curve further solidified its inverted state in October as the 10 Year-3 Month Spread flipped to negative for the first time in three years. The 10 Year-3 Month joined the 10-2 Spread in the inversion club, as the latter ended October 41 basis points below zero. The 1-Year Treasury Bill’s yield of 4.66% was the highest rate among US Treasuries. Every Treasury instrument was yielding north of 4% as of October’s end—the one exception was the 1-Month T-Bill, which closed out the month at 3.73%.
Jump to Fixed Income Performance
Off the YCharts! Wages Are Rising, But Purchasing Power…Not So Much
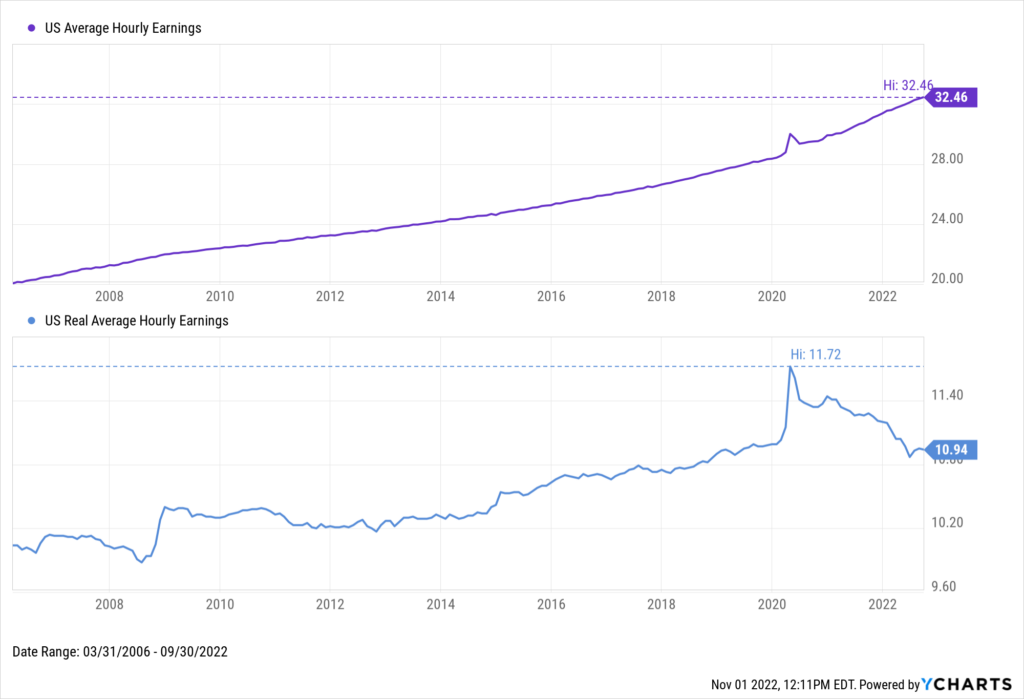
A raise is always welcome news, right? But with inflation at 40-year highs, how much has the average paycheck truly grown over the past couple of years?
As identified in our Quarterly Economic Summary Deck, inflation has certainly taken a bite out of Americans’ paychecks, according to average hourly earnings figures. US Average Hourly Earnings have risen 16.1% since June 2019, or about 4.7% on an annualized basis. However, US Real Average Hourly Earnings are now unchanged since then, and have declined 6.7% from the peak in April 2020. Despite the nominal increases to average hourly earnings, that “real” average take-home pay has failed to sustain any growth over the past three years.
Download Visual | Modify in YCharts
Download our Q3 Economic Summary Deck to receive charts of the major economic events from Q3 in a slide deck that can be white-labeled for your own use. If you’re a YCharts client, access the deck by going to Support > Resources > Economic Summary Deck within YCharts.
Equity Performance
Major Indexes
Download Visual | Modify in YCharts
Value vs. Growth Performance, Trailing Twelve Months
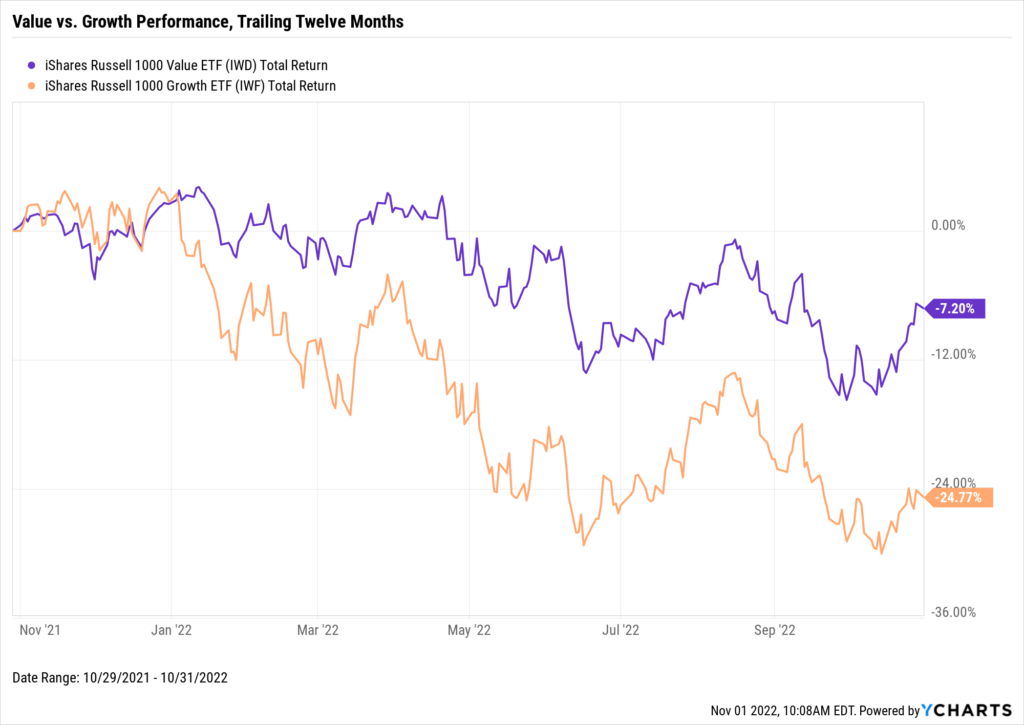
Value stocks, represented by the iShares Russell 1000 Value ETF (IWD), surged 10.1% in October. The Value equity style is now down 7.2% over the past twelve months. Growth (IWF), on the other hand, increased 5.8% in October but actually failed to improve its TTM performance. Growth was down 22.7% between September 2021 & 2022, and is 24.8% lower between October 2021 & 2022 despite the positive gain this past month.
Download Visual | Modify in YCharts
US Sector Movement
Download Visual | Modify in YCharts
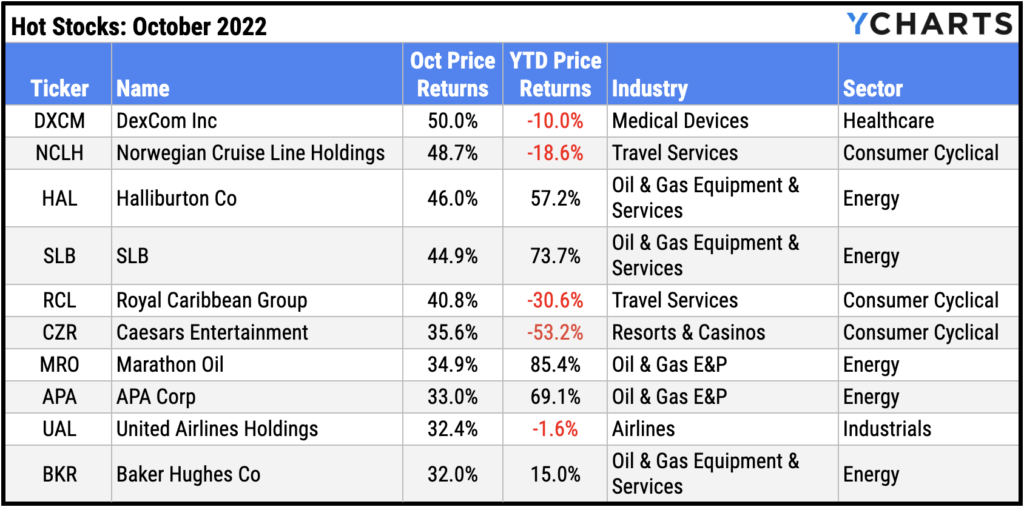
Hot Stocks: Top 10 S&P 500 Performers of October 2022
DexCom Inc (DXCM): 50.0%
Norwegian Cruise Line Holdings (NCLH): 48.7%
Halliburton Co (HAL): 46.0%
SLB (SLB): 44.9%
Royal Caribbean Group (RCL): 40.8%
Caesars Entertainment (CZR): 35.6%
Marathon Oil (MRO): 34.9%
APA Corp (APA): 33.0%
United Airlines Holdings (UAL): 32.4%
Baker Hughes Co (BKR): 32.0%
Download Visual | Modify in YCharts
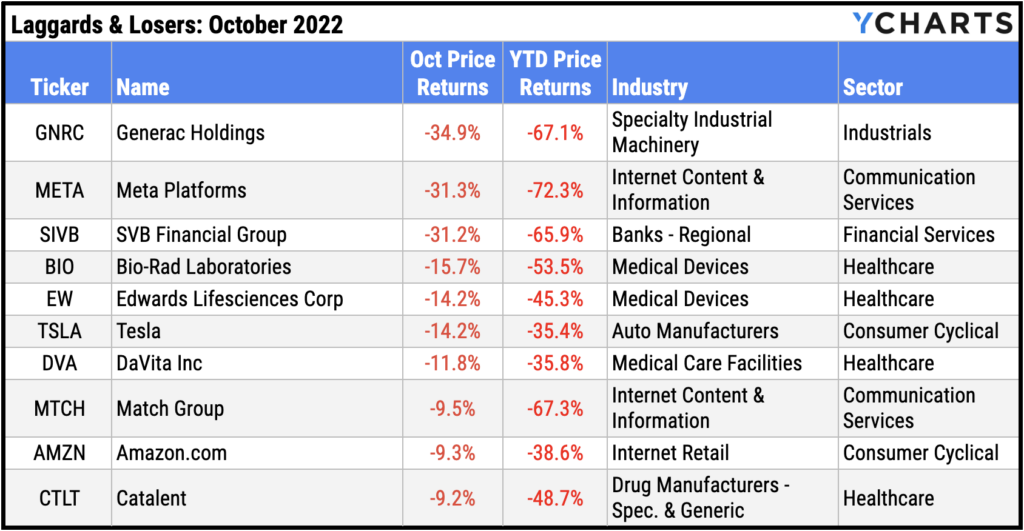
Laggards & Losers: 10 Worst S&P 500 Performers of October 2022
Generac Holdings (GNRC): -34.9% decline in October
Meta Platforms (META): -31.3%
SVB Financial Group (SIVB): -31.2%
Bio-Rad Laboratories (BIO): -15.7%
Edwards Lifesciences Corp (EW): -14.2%
Tesla (TSLA): -14.2%
DaVita Inc (DVA): -11.8%
Match Group (MTCH): -9.5%
Amazon.com (AMZN): -9.3%
Catalent (CTLT): -9.2%
Download Visual | Modify in YCharts
Featured Market & Advisor News
Nearly $1 Billion Swamps Junk-Bond ETF In Record Haul Before Fed (FA-Mag)
Economic Update — Reviewing Q3 2022 (YCharts)
Annuity sales soared again in third quarter (InvestmentNews)
Do ESG Funds Strengthen Investor Portfolios? (YCharts)
SEC Wants a Higher Hurdle for RIAs’ Use of Third Parties (WealthManagement.com)
Q3 2022 Fund Flows: Investors Sound the Recession Alarm, Move into Money Markets, Flee Fixed Income (YCharts)
Economic Data
Employment
The unemployment rate fell back to a near-record low of 3.5% in September, one month after posting its first increase in the last seven. However, the labor force participation rate dipped 0.1 percentage point to 62.3%. The labor force participation rate sits 1.1 percentage points below its February 2020 high. At the state level, Florida’s unemployment rate of 2.5% was the lowest out of 10 major states.
Production and Sales
US Retail and Food Services Sales were unchanged in September, but in October the US ISM Manufacturing PMI slipped 0.7 points to 50.2. The ISM Manufacturing PMI was well above 60 one year ago, but has since fallen to the cusp of “contraction” territory.
Housing
Following a positive surprise in US New Single-Family Home Sales for August, September saw a monthly decrease of 10.9%. 603K new homes were sold nation-wide in September, which represents a YoY change of -17.6%. Existing Home Sales fell for an eighth straight month, but by only 1.5% in contrast. The housing market slowdown translated into reduced home prices, with the US Existing Home Median Sales Price falling 1.8% in September to $384,800. Finally, 15-Year and 30-Year Mortgage Rates surpassed their 2007 levels, clocking in at 6.36% and 7.08%, respectively.
Consumers and Inflation
September’s US Inflation Rate was little changed at 8.2%. However, US Core Inflation for September rose 0.3 percentage points to 6.63%, signaling prices have increased for goods outside of food and energy. The MoM US Consumer Price Index was up 0.39% in September and personal spending increased by 0.65%.
Commodities
The price of gold fell 1.4% MoM to $1,648.10 per ounce as of October 28th, and is down 8.7% year-to-date. Crude oil prices experienced a volatile October following steady declines since June. The spot price for a barrel of WTI crude settled at $86.54 at the end of October, after starting the month at $77.17 and reaching a high of $93.07 earlier in October. Brent closed out October at $94.64 per barrel after entering the month at $82.55 and bumping up against $100 in the first week of the month. Gas prices ended October about unchanged with the average price of regular gas at $3.86 per gallon in the final week of October, just three cents higher than a month ago.
Cryptocurrencies
Major cryptocurrencies ended their cold streak in October. The price of Ethereum rallied 19.1% to settle at $1,591. Bitcoin rose 5.4% to $20,624, and Binance Coin advanced 10.5% to $313.60, its third consecutive month of gains. Year-to date performance remains firmly in the red: Binance Coin is 39.5% lower YTD, Bitcoin is down 56.3%, and Ethereum is off 57.2%.
Fixed Income
US Treasury Yield Curve
1 Month Treasury Rate: 3.73%
3 Month Treasury Rate: 4.22%
6 Month Treasury Rate: 4.57%
1 Year Treasury Rate: 4.66%
2 Year Treasury Rate: 4.51%
3 Year Treasury Rate: 4.45%
5 Year Treasury Rate: 4.27%
10 Year Treasury Rate: 4.10%
20 Year Treasury Rate: 4.44%
30 Year Treasury Rate: 4.22%
Download Visual | Modify in YCharts
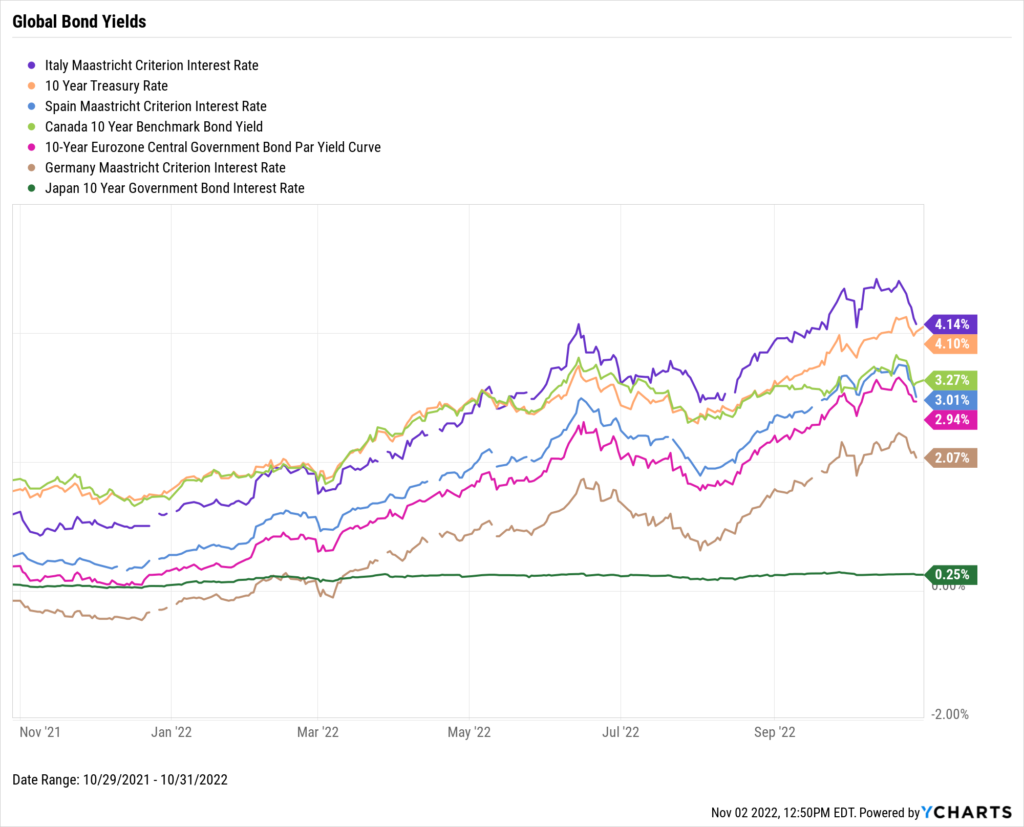
Global Bonds
Italy Long Term Bond Interest Rate: 4.14%
10 Year Treasury Rate: 4.10%
Spain Long Term Bond Interest Rate: 3.01%
Canada 10 Year Benchmark Bond Yield: 3.27%
10-Year Eurozone Central Government Bond Par Yield: 2.94%
Germany Long Term Bond Interest Rate: 2.07%
Japan 10 Year Government Bond Interest Rate: 0.25%
Download Visual | Modify in YCharts
Have a great November! 📈
If you haven’t yet, subscribe to the YCharts Monthly Market Wrap here: