Moving On From Your Investment Research and Analytics Platform?
If you’re being forced off your investment research and analytics platform to a system that you didn’t choose, you’re not alone.
Here’s why transitioning to YCharts could be the right move for you.
Recognizing and empowering financial advisors for their dedication to serving hard-working individuals isn’t just what we do—it’s part of who we are.
YCharts sets a high standard for client success, evidenced by our exceptional client service ratings. Our professional users’ Net Promoter Score (NPS) of 69 serves as proof of our commitment to delivering an excellent client experience.
Further proof comes from Dani Fava, Chief Strategy Officer at Carson Wealth: “Empowering our advisors with YCharts means they now have access to top-tier research and proposal tools. We’re thrilled to see the value it’s already adding for clients. We also value that YCharts is a great partner to do business with.”
Mike Golaszewski, Senior Technology Consultant at Ezra Group, puts it this way: “YCharts seems to provide holistic value across almost all your critical advisory functions–from investment research to client communications to portfolio management. Given that their platform already integrates seamlessly with many popular RIA systems, YCharts should be in the consideration set for foundational technology that enables advisors to scale and thrive.”
And that’s before we even get into the research and client engagement capabilities that YCharts offers to help you better serve your clients.
Right now, if you want to add YCharts to your core tech stack. Advisors with proof of a sunsetting technology provider can access YCharts for $20.25 for the first year.*
The Premier Tool For RIAs
For years, RIAs have been switching to YCharts because of our competitive pricing, powerful research capabilities, and increasingly robust client engagement tools.
Our platform provides comprehensive data, customizable yet compliant disclosures, and an award-winning suite for building client-facing reports—making YCharts the trusted technology partner for firms of all sizes.
Highlighted in industry-leading surveys like the 2025 T3 & Inside Information Survey and the Kitces Advisor Tech Survey, YCharts is the top choice for investment data & analytics and economic analysis & stress testing.
Our market share has grown significantly, increasing from 8% in 2022 to nearly 15% in 2025, demonstrating the capability of YCharts to meet the evolving needs of today’s financial advisors.
This includes 20 of Barron’s Top 25 RIAs, including Savant. Gina Beall, Savant’s Director of Investment Research, shared:
“With YCharts, the proposal generation process has been drastically cut to an average of just 10 minutes, allowing advisors to focus more on meaningful client engagement.”
Easily import portfolios and other assets from your preferred integration partners into YCharts. From there, leverage complaint-ready comparison reports, build personalized proposals, and enhance client service or acquisition—all within a single, powerful platform.
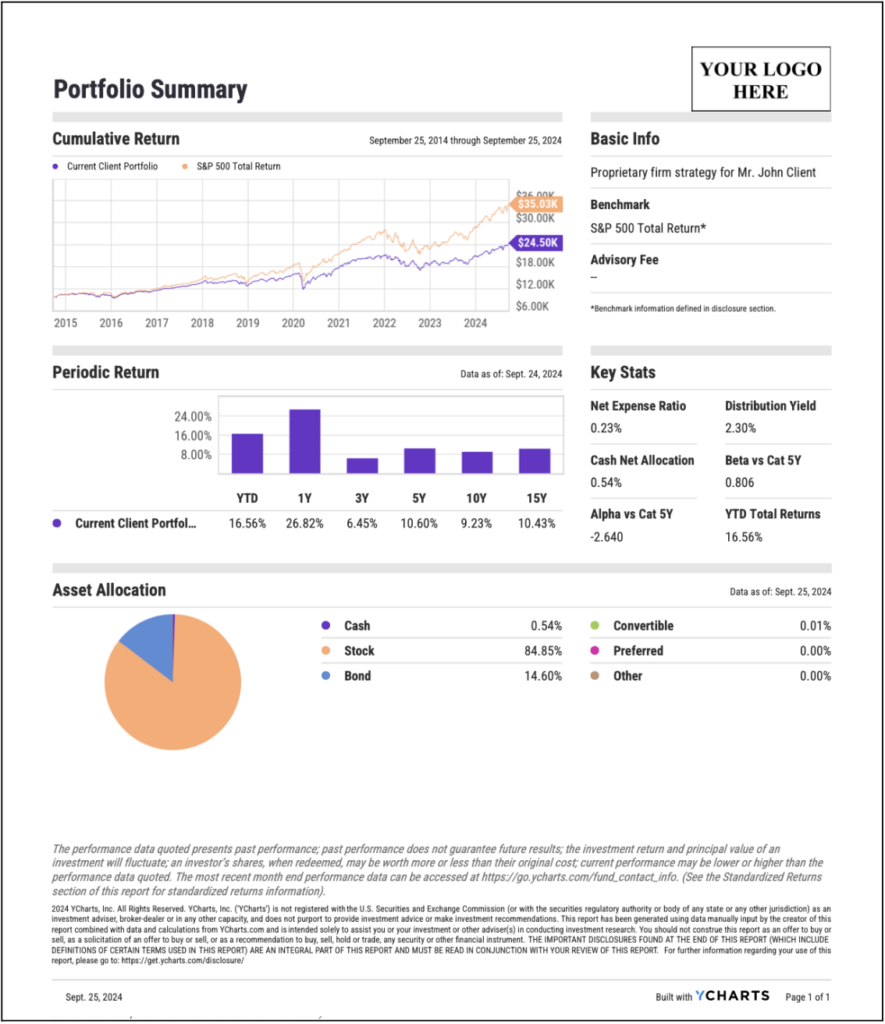
All reports are created with an intuitive drag-and-drop function and can be customized with your firm’s logo and brand colors. Additionally, templates built at the firm level further enhance the efficiency and personalization you seek.
Best-in-class Research Capabilities
YCharts provides financial advisors with a comprehensive suite of tools that streamline research and portfolio management. This allows you to efficiently develop and present tailored investment strategies that cater to the unique risk tolerances and financial objectives of your clients.
Our unwavering commitment to excellence in research and analytics has not only garnered the trust of industry leaders but has also earned us prestigious accolades. YCharts is proud to be designated as a ‘Software All-Star’ in two categories in the 2025 T3 & Inside Information Survey.
Additionally, the Kitces Advisor Tech Survey has recognized YCharts as an Investment Research Market Leader, surpassing industry competitors with a remarkable customer satisfaction score of 8.2 out of 10 and a perceived value rating of 8.3.
Key features of our toolkit include:
- Stock & Fund Screeners: Analyze over 4,500 technical and fundamental metrics, including Sharpe ratios, drawdowns, and beta. With these screeners, you can create proprietary scoring models, identifying prime investment opportunities tailored to your firm’s strategies or client portfolios.
- Portfolios & Portfolio Optimizer: Effortlessly manage and analyze models, benchmarks, and client portfolios all in one place. Use intuitive metrics and visual tools to turn complex data into actionable insights. From there, use the Optimizer to develop the ideal asset allocation and craft personalized, diversified portfolios that maximize returns and minimize risk.
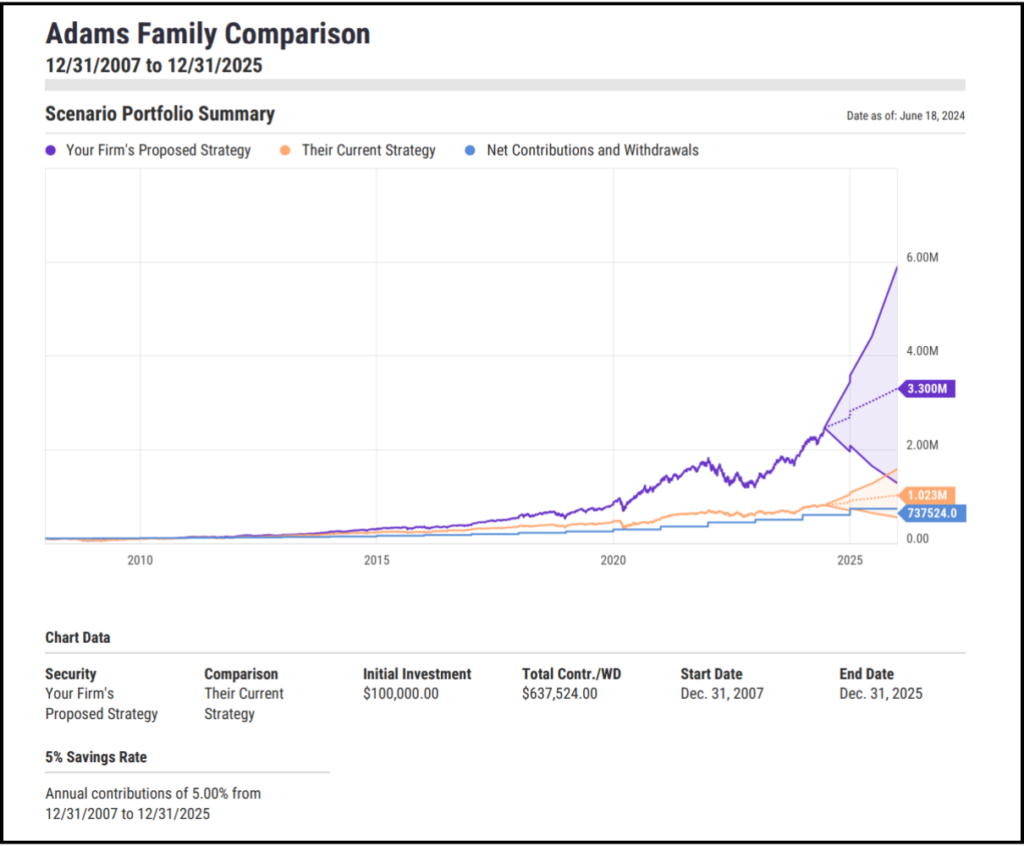
- Stress Tests & Scenarios: Assess portfolio resilience during turbulent market events like the Global Financial Crisis. Use Scenarios to illustrate the long-term advantages of early investing and examine how various withdrawal rates impact client wealth, ultimately helping clients make informed decisions.
Top-Notch Support
As mentioned, YCharts is committed to supporting hard-working professionals like yourself.
This commitment is reflected in our exceptional live chat service, which boasts a 99% satisfaction rating from users. Additionally, when you sign up, you’re assigned a dedicated account manager to ensure you receive white glove treatment and support as you and your team get acquainted with YCharts.
To further enhance the value we provide to advisors, YCharts offers a suite of ready-to-use resources designed to enrich client interactions.
By crafting impactful visuals that boost client confidence and address their concerns, we allow advisors to concentrate on personalizing their presentations and deepening client conversations rather than on time-consuming backend preparations. Below is a selection of our most valuable resources:
- The Top 10 Visuals for Client & Prospect Meetings Slide Deck
- The Best Performing ETFs
- Debunking Investing Myths Slide Deck
- Quarterly Economic Summary Deck
- Fund Flow Reports
- Monthly Market Wrap Slide Deck
View our full resource library here.
Ready to see the difference? Take advantage of our exclusive offer— $20.25 access for the first year to advisors with proof of a sunsetting technology provider.*
*The offer referenced throughout this article requires a 2-year commitment with proof of your current provider plan. The second year starts on 1/1/26 at a rate of $4,800. For a 1-year commitment, the introductory rate is $4,800.*
Whenever you’re ready, here’s how YCharts can help you:
1. Looking to Move On From Your Investment Research and Analytics Platform?
Send us an email at hello@ycharts.com or call (866) 965-7552. You’ll be directly in touch with one of our Chicago-based team members.
2. Want to test out YCharts for free?
Start a no-risk 7-Day Free Trial.
Disclaimer
©2025 YCharts, Inc. All Rights Reserved. YCharts, Inc. (“YCharts”) is not registered with the U.S. Securities and Exchange Commission (or with the securities regulatory authority or body of any state or any other jurisdiction) as an investment adviser, broker-dealer or in any other capacity, and does not purport to provide investment advice or make investment recommendations. This report has been generated through application of the analytical tools and data provided through ycharts.com and is intended solely to assist you or your investment or other adviser(s) in conducting investment research. You should not construe this report as an offer to buy or sell, as a solicitation of an offer to buy or sell, or as a recommendation to buy, sell, hold or trade, any security or other financial instrument. For further information regarding your use of this report, please go to: ycharts.com/about/disclosure
Next Article
Monthly Market Wrap: February 2025Read More →