Navigating the 2025 Government Shutdown with YCharts

Executive Summary: With federal agencies paused during the government shutdown, key economic reports like jobs, inflation, and retail sales are delayed or missing. This article highlights which data are affected and how advisors can use YCharts’ alternative indicators to stay informed and guide clients with confidence.
Interested in testing out YCharts for free?
Start 7-Day Free TrialWhen the federal government shuts down, markets continue trading, but data pauses. Key indicators like employment, inflation, and GDP reports are delayed or suspended, leaving investors and advisors with less information to guide decisions.
As we approach what could become the longest shutdown in U.S. history, it helps to look back at similar moments. The previous extended shutdown began in December 2018 and lasted 35 days. Despite the disruption, major indexes performed strongly, with the Nasdaq, S&P 500, and Dow gaining more than 10 percent each during the period.
Table of Contents
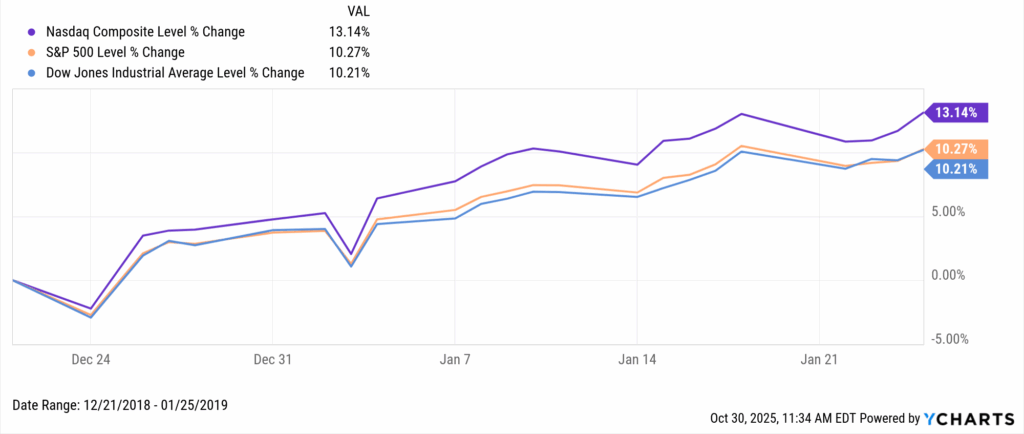
Explore in YCharts → 2018 Government Shutdown
This latest shutdown, which began on October 1, has now stretched to 30 days, with no resolution in sight. Like most past shutdowns, markets have shown a limited immediate reaction, instead focusing on earnings fundamentals and ongoing developments in Federal Reserve policy.
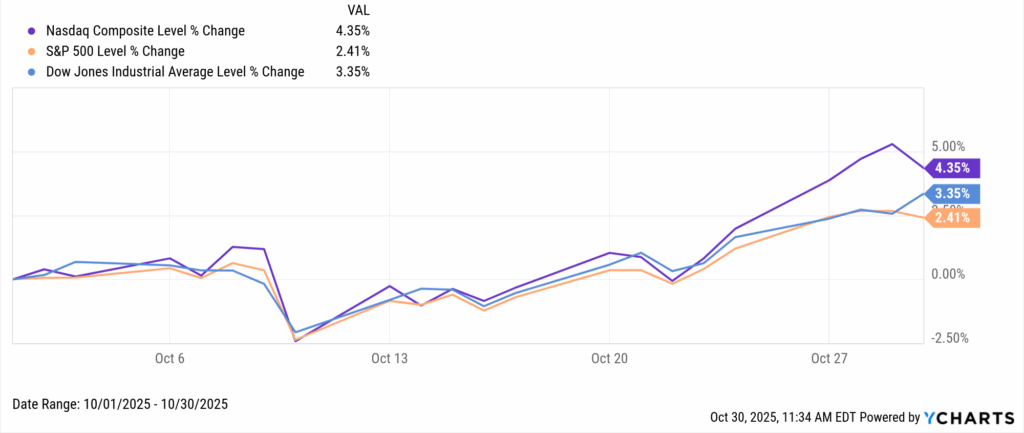
Explore in YCharts → 2025 Government Shutdown
Historically, markets have been higher 86 percent of the time 12 months after a shutdown ends, with an average gain of 12.7 percent. That resilience suggests investors should continue to avoid overreacting.
In this article, we’ll outline which economic data points are affected, where investors can find reliable alternative sources, and how to continue analyzing market trends even when official releases are on hold.
Blurring Economic Health
While markets tend to remain positive, the overarching health of the economy will continue to blur as this shutdown persists. Many influential government reports were either delayed or halted entirely for September data, and we are tracking for the same with October.
Bureau of Labor Statistics (BLS): Most labor and wage data remain on pause as the BLS halts operations. That includes the Employment Situation report, Average Hourly Earnings, and related wage growth metrics. The Consumer Price Index (CPI) for September was initially delayed, but was eventually released several weeks late.
U.S. Census Bureau (Department of Commerce): The Census has suspended all economic indicator programs, delaying Retail Sales, New Residential Sales, and Construction Spending. These pauses remove core inputs for tracking consumer strength and housing activity, leaving notable gaps in near-term economic visibility.
While producing YCharts’ Q3 Economic Update, we encountered these issues firsthand. It is challenging to build a complete picture of an economy when key pieces of the foundation are missing.
This got us thinking: where can advisors look for answers during this unique period?
Employment & Labor Market
Advisors can continue to track critical labor conditions in YCharts using private-sector data that remains available throughout the shutdown.
- ADP Employment Change & ADP Private Employment: Monthly measures of private payroll growth across industries and company sizes. These indicators often serve as early reads on labor conditions.
- The Challenger Report: A monthly summary of corporate layoff announcements that can signal emerging weakness in specific sectors.
For additional context, LinkedIn’s Jobs Report provides a public view of hiring trends and labor shifts based on its members activity.
Jerome Powell stated following October’s FOMC meeting that “job creation is pretty close to zero.” Access to alternative datasets allows advisors to stay current on employment conditions and evaluate how job trends may influence market sentiment and sector performance.
Inflation & Consumer Spending
Inflation data has become harder to track in real time during the shutdown. September’s Consumer Price Index (CPI) was released nearly three weeks later than planned, and a similar delay could occur again with upcoming reports.
PCE, the Federal Reserve’s preferred inflation gauge, and PPI have not been released, leaving significant gaps in tracking cost trends and pricing pressure. Alternatives remain available in YCharts:
- US ISM Manufacturing Prices Paid Index & US ISM Services Prices Paid Index: Forward-looking measures of cost pressures from business surveys that remain active and widely followed for early inflation signals.
- University of Michigan Consumer Sentiment Index: Continuously updated by UM’s Institute for Social Research, providing independent insight into household confidence and expected spending.
YCharts visuals of commodity markets, energy prices, and sector-level fundamentals help advisors connect inflation trends to market behavior, showing where cost pressures are building and how they’re affecting different parts of the economy.
Housing & Construction
Housing data has been among the most heavily impacted by the shutdown. With the U.S. Census Bureau suspended, reports such as New Home Sales, Building Permits, and Construction Spending have not been released.
Advisors can continue to evaluate the housing landscape in YCharts using indicators that remain active:
- 30-Year Mortgage Rate: Reflects affordability pressures and the broader impact of interest rates on homebuyer demand.
- Housing Affordability Index: Tracks the relationship between income levels, home prices, and mortgage costs to gauge household purchasing power.
- NAHB Housing Market Index: This index measures homebuilder confidence, providing an early indication of construction sentiment and future building activity.
The MBA Purchase Applications Index is released weekly, tracking the volume of mortgage applications for home purchases. Redfin and Zillow’s Market Trends Reports also offer near real-time insights into listings, median prices, and regional activity based on their extensive housing databases.
Private sources can help fill in the gaps while Census data remains unavailable. YCharts helps advisors stay informed about housing trends and keep clients updated throughout the shutdown.
Stay Informed Through the Shutdown
The government shutdown has created more uncertainty surrounding economic data than around the markets themselves. While official releases remain delayed, advisors can still rely on YCharts to visualize alternative datasets, track evolving trends, and maintain perspective when information is limited.
Subscribe to the YCharts Blog for ongoing analysis that helps advisors interpret new economic data and navigate the remainder of the government shutdown.
Ready to Move On From Your Investment Research and Analytics Platform?
Follow YCharts Social Media to Unlock More Content!
Disclaimer
©2025 YCharts, Inc. All Rights Reserved. YCharts, Inc. (“YCharts”) is not registered with the U.S. Securities and Exchange Commission (or with the securities regulatory authority or body of any state or any other jurisdiction) as an investment adviser, broker-dealer or in any other capacity, and does not purport to provide investment advice or make investment recommendations. This report has been generated through application of the analytical tools and data provided through ycharts.com and is intended solely to assist you or your investment or other adviser(s) in conducting investment research. You should not construe this report as an offer to buy or sell, as a solicitation of an offer to buy or sell, or as a recommendation to buy, sell, hold or trade, any security or other financial instrument. For further information regarding your use of this report, please go to: ycharts.com/about/disclosure.
Next Article
Yield Curve Inversion 2025: What the 2-10 Spread Tells Us About Recession RiskRead More →