NEW on YCharts: Attribution Analysis
With YCharts’ new Attribution Analysis tool, users gain a deeper understanding of an individual holdings’ impact on portfolio (or fund) performance, facilitating streamlined decision-making and strategy refinement.
Seamlessly integrated into YCharts’ Report Builder, these insights can be easily customized and presented, empowering professionals to craft impactful narratives tailored to client needs. Want to see it in action? Check out the short video below:
Analyze the Direct Impact of Individual Holdings
Utilize the YCharts’ Absolute Attribution Analysis page to gain valuable insights into how each holding directly influences your portfolio’s performance. This available heatmap module showcases the primary contributors and detractors, enabling you to grasp the individual impact of investments on returns. Leverage this feature for streamlined analysis ahead of client meetings or for deeper insights on the key securities shaping your fund or portfolio strategy.
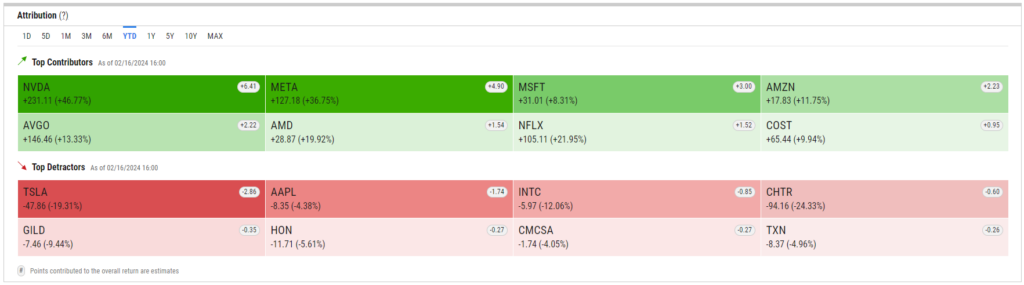
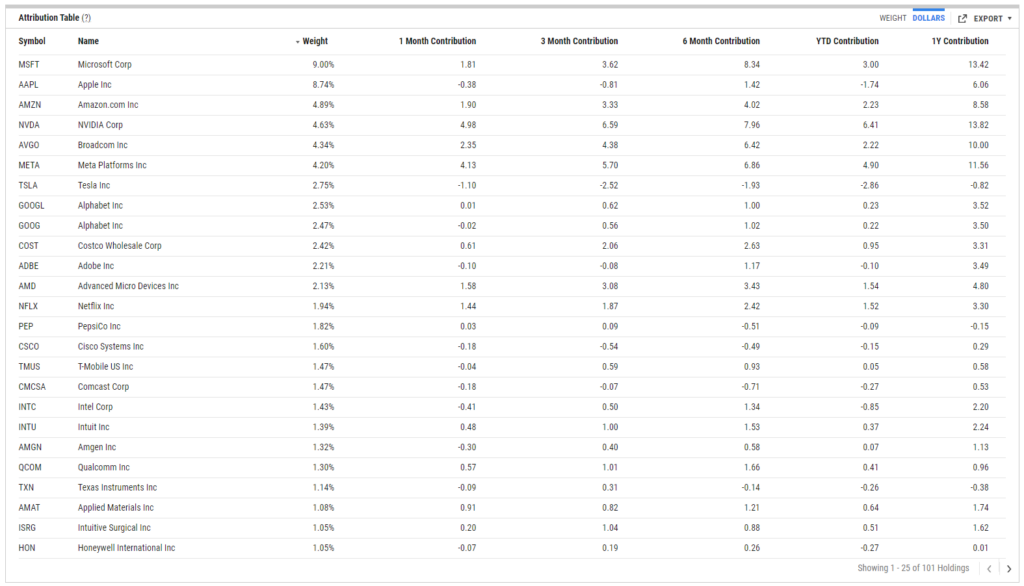
Additionally, the contributions/detractions table comprehensively explains each holding’s impact on a portfolio or fund’s returns. By multiplying the weight of each holding by its return, absolute attribution offers a concise overview of what drives your portfolio’s overall performance.
Understand Category Performance Relative to a Benchmark
In addition to the Absolute Attribution page, YCharts provides a couple of options for Relative Attribution analysis, which breaks down a portfolio or fund’s performance compared to an assigned benchmark (users can define as they see fit). This includes:
Allocation: Evaluates the impact of asset allocation decisions on sector or category performance.
Selection: Assesses how individual securities within each category perform compared to their counterparts in the benchmark.
Interaction: Considers the combined effect of allocation and selection decisions on portfolio performance, revealing their synergistic or conflicting impacts.
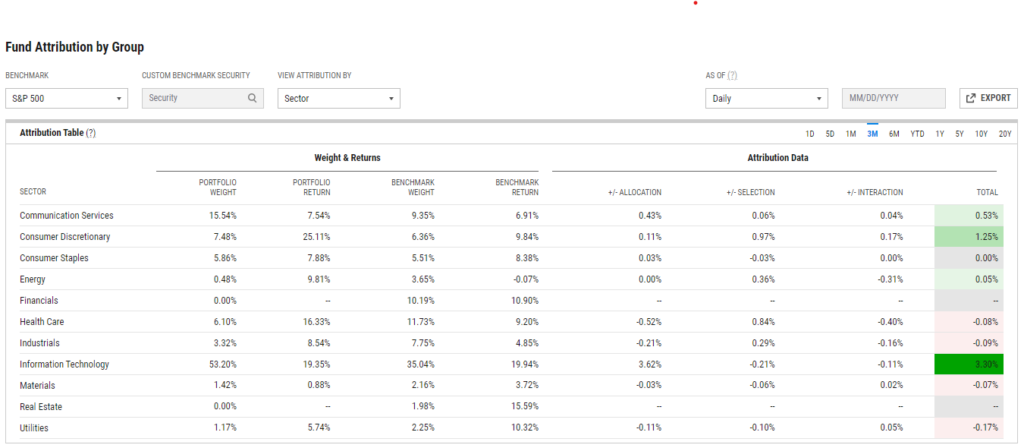
Select from Sector, Equity Style, Broad Asset Class, Bond Sector, and Bond Maturity views to gain deeper insights into how each specific category contributes to the portfolio’s overall performance. This detailed analysis aids in identifying strengths and weaknesses, allowing for more informed decision-making when reallocating assets or adjusting strategies to align with a portfolio or fund’s intended goals and optimize return potential.
Additionally, users can leverage the “As-of-Date” functionality to perform point-in-time analyses with options for Daily (latest data), Month End, Quarter End, or a custom date selection.
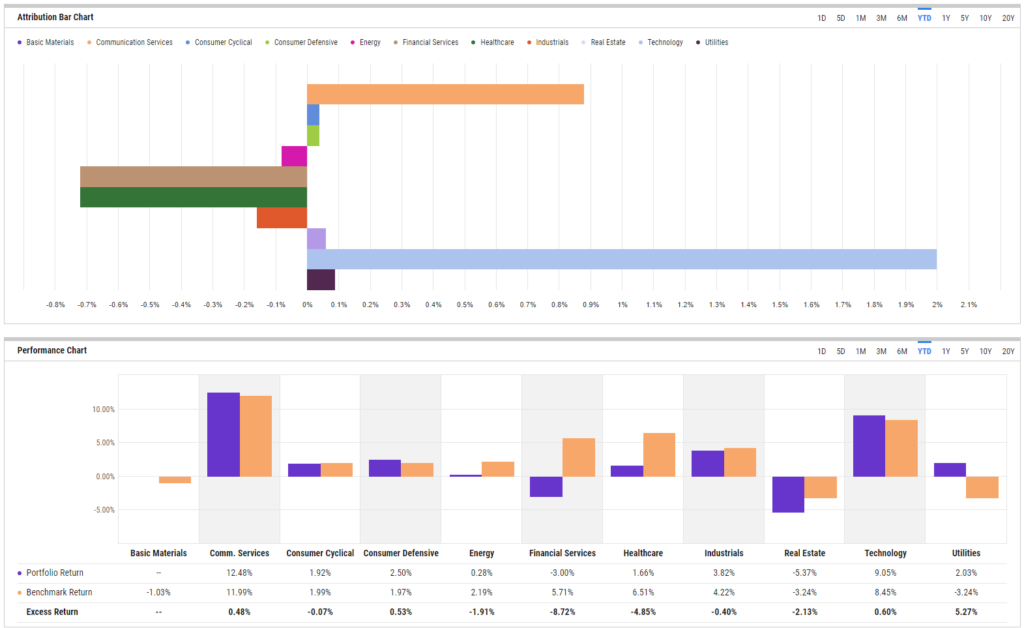
The associated bar chart and performance charts visualize the data for quick-hitting and easy-to-understand analyses to provide further context. Whether you’re an advisor working to align your portfolio strategy based on a client’s goals or a fund manager ensuring your fund is balanced based on its prospectus, YCharts’ Relative Attribution analysis will enable you to make more informed decisions.
Tailor Your Investment Narrative to the Audience
Preparing for an upcoming client meeting or investment committee presentation? Elevate your narrative with YCharts’ powerful attribution visuals.
Utilize YCharts’ Report Builder to seamlessly integrate attribution tables and visuals into your proposals, crafting a tailored investment story that emphasizes your strategy’s strengths and resonates with your client’s interests.
For an even faster alternative, export visuals as a PDF directly from the Relative Attribution analysis page, ensuring you have compelling insights at your fingertips in seconds.
Whenever you’re ready, there are 3 ways YCharts can help you:
1. Looking for comprehensive, best-in-class data?
Send us an email at hello@ycharts.com or call (866) 965-7552. You’ll be directly in touch with one of our Chicago-based team members.
2. Want to test out YCharts for free?
Start a no-risk 7-Day Free Trial.
3. Download a copy of the Top 10 Visuals for Client and Prospect Meetings slide deck:
Disclaimer
©2024 YCharts, Inc. All Rights Reserved. YCharts, Inc. (“YCharts”) is not registered with the U.S. Securities and Exchange Commission (or with the securities regulatory authority or body of any state or any other jurisdiction) as an investment adviser, broker-dealer or in any other capacity, and does not purport to provide investment advice or make investment recommendations. This report has been generated through application of the analytical tools and data provided through ycharts.com and is intended solely to assist you or your investment or other adviser(s) in conducting investment research. You should not construe this report as an offer to buy or sell, as a solicitation of an offer to buy or sell, or as a recommendation to buy, sell, hold or trade, any security or other financial instrument. For further information regarding your use of this report, please go to: ycharts.com/about/disclosure
Next Article
How 3 Stocks Drove 49% of the S&P 500's Gains in 1H 2024Read More →