NEW on YCharts: Portfolio Types & Advanced Features
YCharts’ ever-popular Model Portfolios just got even better with the addition of two portfolio types:
1. Benchmark Portfolios: Create custom blended benchmarks to compare other portfolios or investments against. User-defined inputs simplify the benchmarking process, focusing on relevant data for effective comparisons.
2. Client Portfolios: Offer personalized financial insights based on your clients’ holdings and investments. Client Portfolios provide a client-centric perspective to focus on actual holdings and drive more detailed insights into client-specific accounts.
Designed to streamline your benchmarking process and offer better client-centric financial insights, these new features will help you elevate your wealth management strategies and make more informed investment decisions for better client results.
We’ve also added advanced functionality to further build out your portfolio construction and analysis. Elevate your allocation precision with Exposure Proxy, address historical gaps using Performance Proxy, seamlessly incorporate returns data with Portfolio Performance Backfill, and gain granular client insights with Cost Basis inputs.
Improve Allocation & Exposure Calculations
Leverage YCharts’ Exposure Proxy capabilities to more accurately calculate a model portfolio or benchmark’s asset allocation and exposure to different categories. You can now assign a chosen security as a proxy for each holding. Whether you’ve just created a benchmark made up of various indices or want to update how your holdings’ exposure is calculated, this advanced portfolio functionality will ensure it is representative of your assets and aligned with your investment strategy.
.gif)
Bridge Historical Data Gaps
The value of the advanced Performance Proxy feature lies in its capacity to address historical data gaps by allowing users to assign a security proxy to holdings during periods with limited or nonexistent performance data. For example, suppose a client holds an ETF that was converted from a mutual fund. In that case, Performance Proxy can provide a more complete picture of a particular strategy’s performance over a longer period of time. This enables more precise calculations for a more comprehensive understanding of a portfolio or benchmark’s performance.
Depending on the situation, one could use the Performance Proxy when adding new holdings to an existing model portfolio or for assets of interest with incomplete historical data. This ensures a more robust and strategy-aligned analysis across all of YCharts’ portfolio types.
Incorporate Historical Returns Data Seamlessly
YCharts’ Portfolio Performance Backfill is a crucial tool for wealth management professionals to help them establish a reliable representation of historical performance by directly uploading portfolio return data. This functionality enhances the precision of one’s portfolio analyses, ensuring that they’re built on a solid foundation. It is particularly valuable when aiming to backfill portfolios with accurate data, especially for funds or securities with incomplete or unavailable data. Available for all of YCharts’ portfolio types, it enables more informed investment decisions for better results for your clients.
Gain Insights at a Granular Level
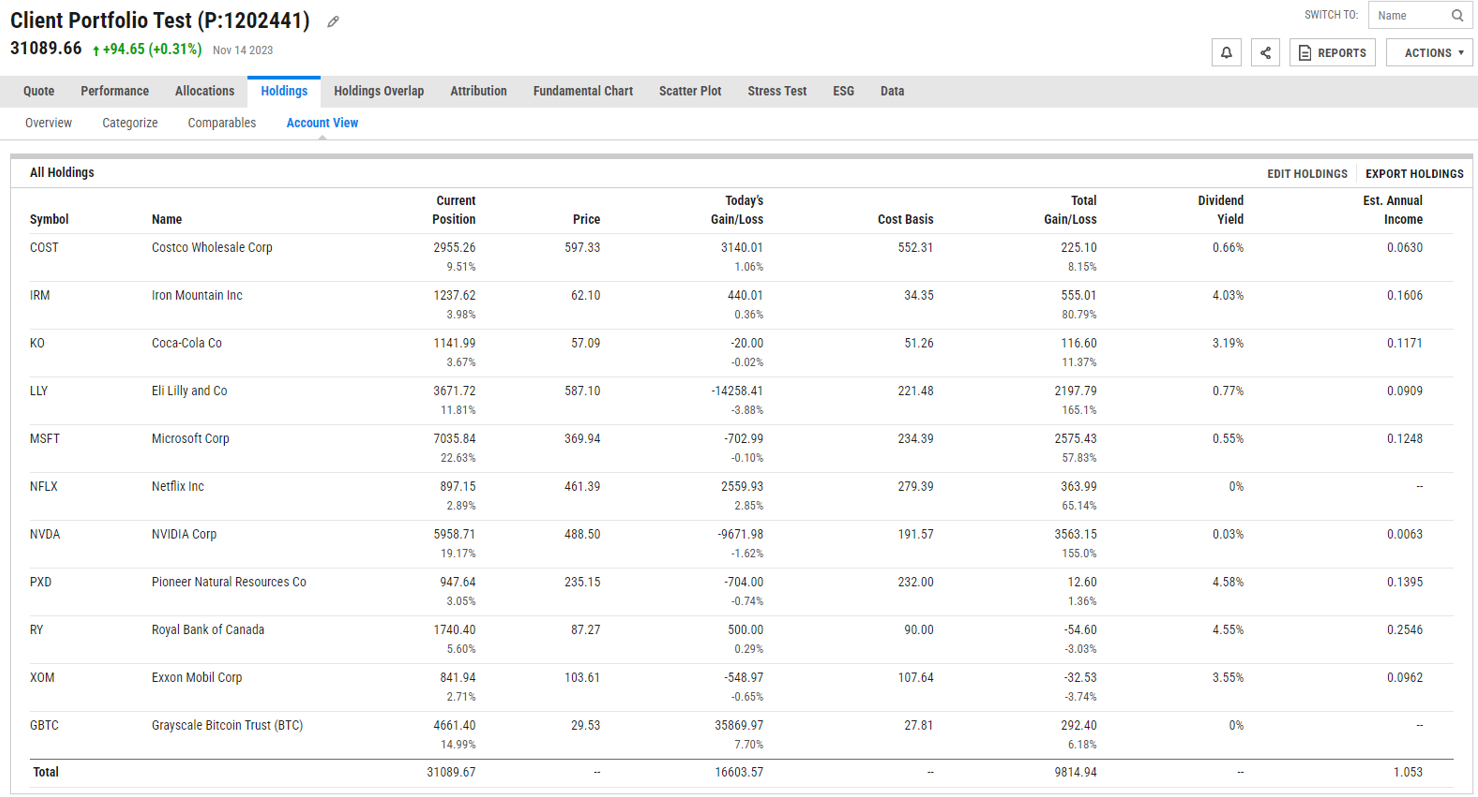
The Cost Basis feature, available for YCharts’ Client Portfolios, allows for a precise dollar-centric view of client portfolios by entering Average Cost Basis values for each holding. This provides insights into the actual cost of assets, the implications of selling, and offers comprehensive position insights, which include Total Gain/Loss for each individual holding, enabling a more nuanced and granular analysis of individual asset performance within your clients’ portfolios.
Whenever you’re ready, there are 3 ways YCharts can help you:
1. Looking for comprehensive, best-in-class data?
Send us an email at hello@ycharts.com or call (866) 965-7552. You’ll be directly in touch with one of our Chicago-based team members.
2. Want to test out YCharts for free?
Start a no-risk 7-Day Free Trial.
3. Download a copy of The Top Charts of 2023 slide deck:
Dowload the expertly-curated ‘Top 23 Charts of 2023’ deck for essential visuals on the year’s key market and economic trendsDisclaimer
©2023 YCharts, Inc. All Rights Reserved. YCharts, Inc. (“YCharts”) is not registered with the U.S. Securities and Exchange Commission (or with the securities regulatory authority or body of any state or any other jurisdiction) as an investment adviser, broker-dealer or in any other capacity, and does not purport to provide investment advice or make investment recommendations. This report has been generated through application of the analytical tools and data provided through ycharts.com and is intended solely to assist you or your investment or other adviser(s) in conducting investment research. You should not construe this report as an offer to buy or sell, as a solicitation of an offer to buy or sell, or as a recommendation to buy, sell, hold or trade, any security or other financial instrument. For further information regarding your use of this report, please go to: ycharts.com/about/disclosure
Next Article
Michael Batnick & Ben Carlson’s Year-End Strategy Session RecapRead More →