New on YCharts: Report Builder
Whether meeting with a client, prospect, or colleague, Report Builder gives you the power to create and customize your ideal investment report for every conversation. Custom Reports have quickly become one of the most popular features on YCharts, and Report Builder makes it even easier to generate these powerful tools for client and prospect meetings.
Report Builder is available in YCharts Professional (as permitted by account administrators), and as an add-on feature for asset manager users.
Create portfolio and security reports for every conversation
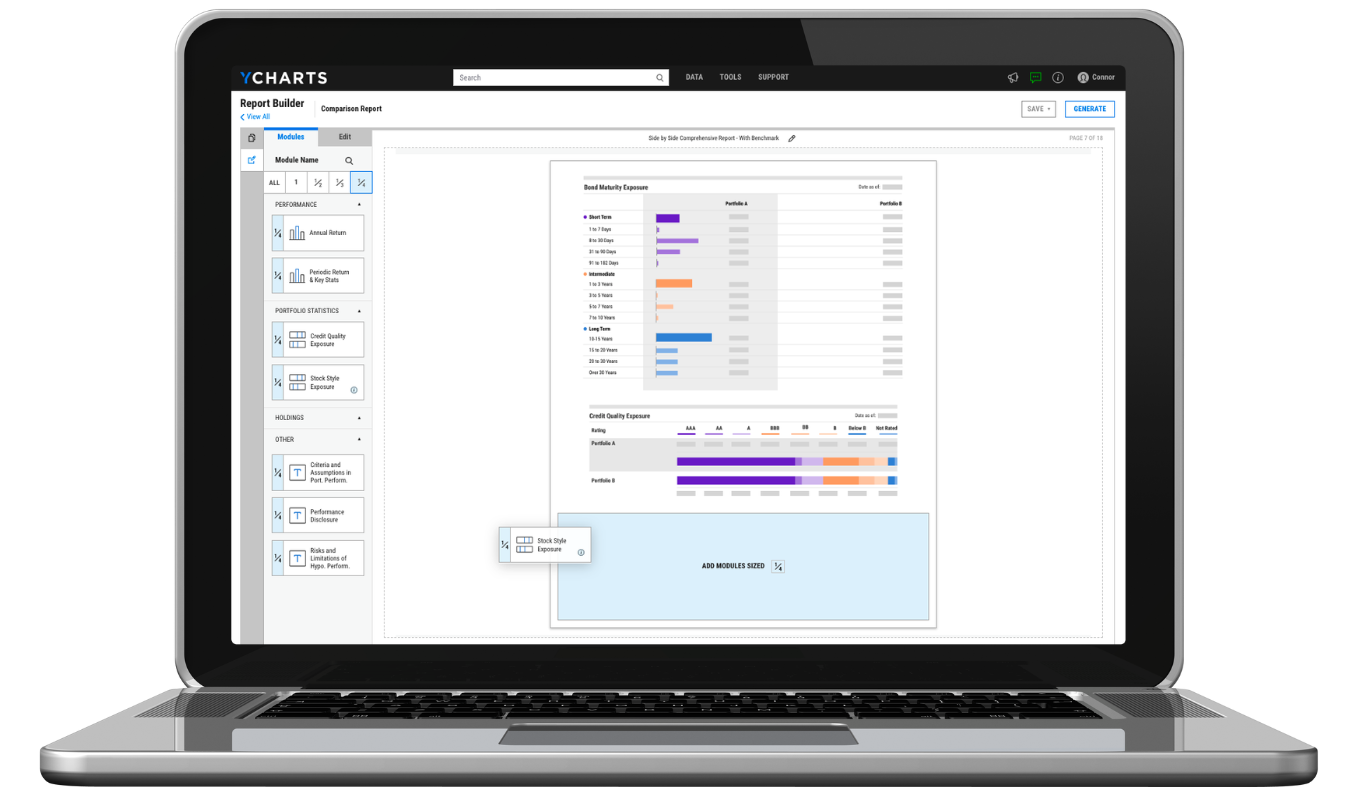
Starting from four different report types—Overview, Comparison, Multi-Comparison, and Presentation—use Report Builder to rearrange and customize 30+ visual and data modules, add your firm’s logo, colors, and disclosures, and even upload PDFs or images from outside of YCharts.
Your objectives when meeting with a prospect differ from those when onboarding a new client, so shouldn’t your meeting collateral be uniquely purpose-built as well? Report Builder enables you to drag and drop the most relevant visuals and data, creating the most impactful talk track possible for every interaction.
Investment Policy Statements (IPS), financial plan information, and market outlooks can also be added to fit seamlessly alongside YCharts-powered content.
Equip advisors and teams with better collateral for asset gathering
To support asset gathering while also ensuring compliance best practices are followed, use Report Builder to standardize the templates your reps in the field can access. Especially valuable for accumulating assets in firm-managed models, your home-office team can decide to share Report Templates with “edit” or “view only” access.
Several pre-built templates, available by default within YCharts, adhere to the SEC’s Marketing Rule (Rule 206(4)(1) under the Investment Advisers Act of 1940) or are FINRA-reviewed. Additionally, the dynamic disclosure module automatically includes necessary definitions for securities and metrics included in your report, while the custom text module can be added to give you even more control of your report narrative and address compliance needs.
Streamline meeting prep to spend more time with clients & prospects
Save time and effort by utilizing the intuitive drag-and-drop designer to create tailored reports on-the-fly. Report Builder’s intuitive interface ensures meeting prep doesn’t consume your day. Report modules are also organized by size—full-page, ½, ⅓, or ¼—so you don’t need to worry about formatting issues and page breaks. Utilize the various tearsheet modules to create a clean, concise overview of a security or model strategy’s performance, risk statistics, and fundamentals to provide clients and prospects as a quick reference.
Leverage Previously Saved Charts & Data Tables
Use Report Builder’s saved assets module to pull in previously built-out research from your saved Fundamental Charts, Scatter Plots, Comp Tables, and more to provide a complete narrative about your portfolio strategy and investment insights. Incorporate economic data into your analyses to provide additional context for your intended audience. You’ll also be able to further customize a client or prospect’s experience by adding visuals outside of the YCharts ecosystem using the full-page image module.
Connect with YCharts
Much like the advisors and asset managers we serve, we pride ourselves on listening to and understanding our clients’ needs.
Report Builder is available for YCharts Professional users only (as permissioned by account administrators), and as an add-on feature for asset manager users. For questions or feedback, reach out to your account manager.
Not a YCharts user? Sign up for a 7-Day Free Trial or contact us via email at hello@ycharts.com and by phone at (866) 965-7552 to learn more.
Disclaimer
©2023 YCharts, Inc. All Rights Reserved. YCharts, Inc. (“YCharts”) is not registered with the U.S. Securities and Exchange Commission (or with the securities regulatory authority or body of any state or any other jurisdiction) as an investment adviser, broker-dealer, or in any other capacity, and does not purport to provide investment advice or make investment recommendations. This report has been generated through application of the analytical tools and data provided through ycharts.com and is intended solely to assist you or your investment or other adviser(s) in conducting investment research. You should not construe this report as an offer to buy or sell, as a solicitation of an offer to buy or sell, or as a recommendation to buy, sell, hold or trade, any security or other financial instrument. For further information regarding your use of this report, please go to: ycharts.com/about/disclosure
Next Article
ICYMI: Retain or Lose Clients Based On Your Communication Approach With Sam RussellRead More →