Nvidia’s Strong Q4 2025 Earnings: What It Means for Investors & Financial Advisors
Introduction: Nvidia’s Earnings Beat & Market Reaction
Nvidia (NVDA) delivered another strong earnings report, surpassing analyst expectations for revenue, earnings per share (EPS), and forward guidance. The semiconductor giant continues to ride the AI-driven demand surge, with data center revenue hitting record highs and gaming sales showing resilience.
With Nvidia serving as a bellwether for the AI and semiconductor sectors, today’s earnings have broad implications for equity markets, sector allocations, and portfolio strategies.
This analysis will cover:
- Key earnings highlights and market reaction
- Sector and macroeconomic implications
- Investment insights for asset managers and financial advisors
Key Takeaways from Nvidia’s Q4 FY2025 Earnings Report
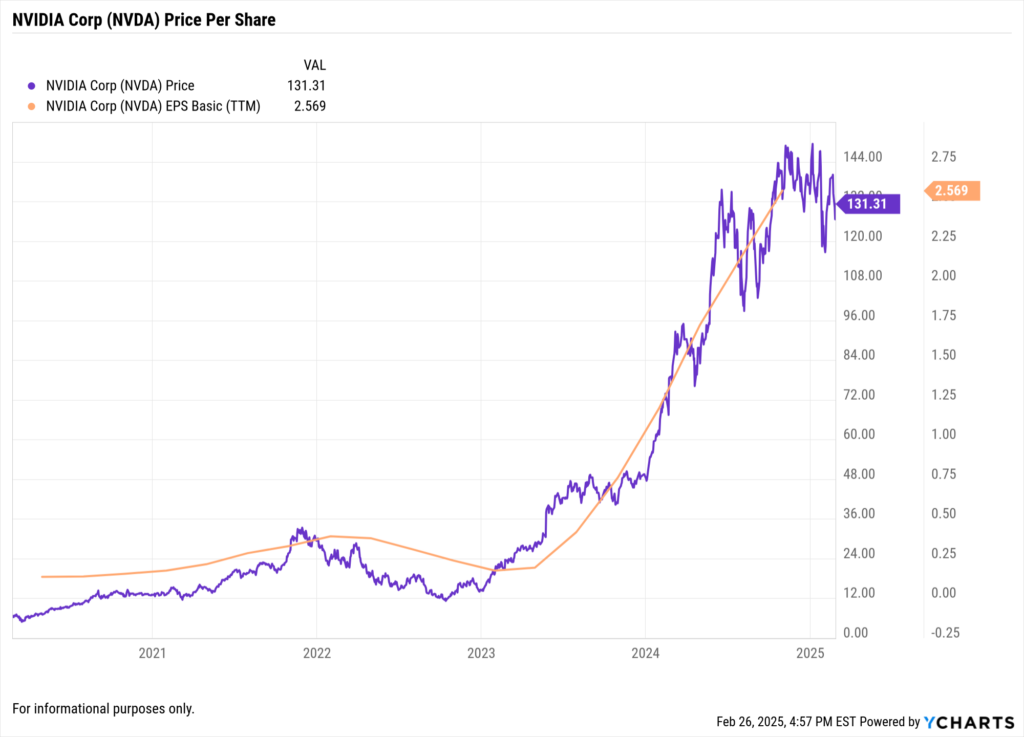
Earnings & Revenue Beat Expectations
- Revenue: Reported at $39.3 billion, exceeding analyst estimates of $38.1 billion.
- EPS: Adjusted earnings per share of $0.89, surpassing expectations of $0.85.
- Gross Margin: Expanded to 73.5%, reflecting strong pricing power in AI chip sales.
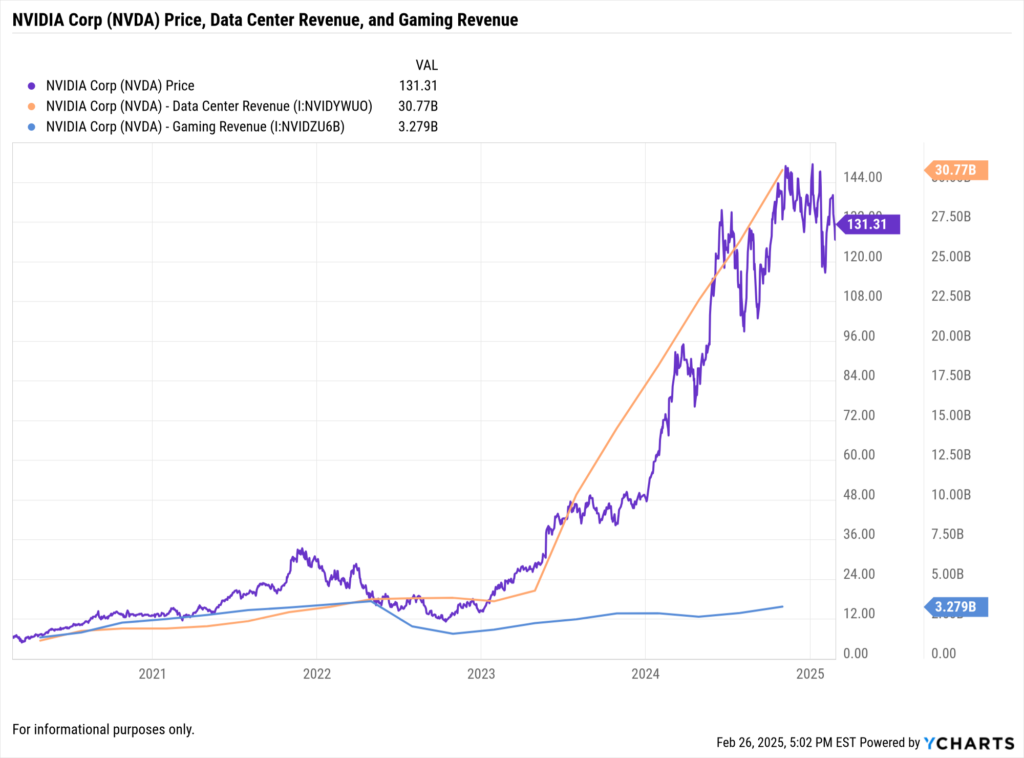
- Data Center Revenue: Grew 93% year-over-year, reaching a new all-time high of $35.6 billion.
AI & Data Center Growth Driving Nvidia’s Expansion
Nvidia’s data center business continues to be the dominant revenue driver, fueled by:
- Cloud service providers ramping up AI infrastructure.
- Demand for AI chips like the H100 & B100 series.
- Enterprise AI adoption gaining traction across industries.
Gaming & Consumer Graphics Show Stability
Despite a broader industry slowdown, Nvidia’s gaming division reported an 11% increase year-over-year, driven by:
- Continued strength in GeForce RTX 50-series GPUs.
- AI-powered gaming innovations enhancing performance.
- Resilient consumer demand despite economic uncertainty.
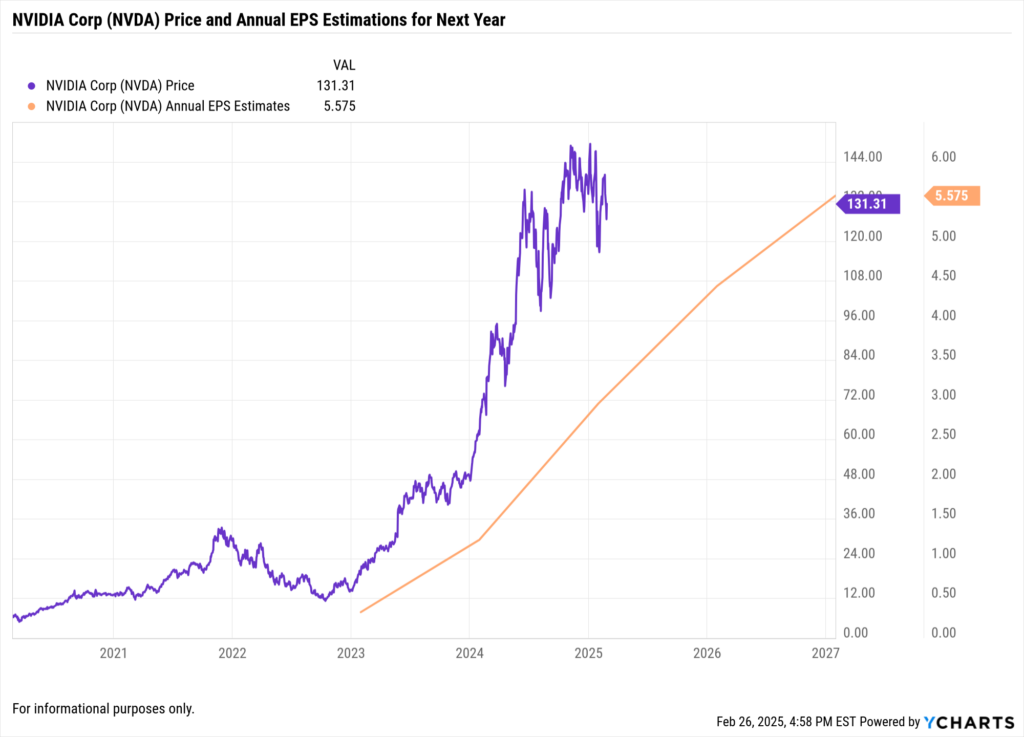
Forward Guidance Points to Continued Strength
- Nvidia raised full-year revenue guidance above market expectations.
- Management cited sustained AI demand and new partnerships in AI computing.
- Stock buyback program expanded, signaling confidence in long-term growth.
Market Reaction: How Stocks & Sectors Are Moving
Following Nvidia’s earnings release, markets reacted positively, with strong gains across the semiconductor sector and broader technology index.
- NVDA Stock Price: Up 2.3% in after-hours trading following earnings.
- Semiconductor ETF (SOXX): Rose 3%, reflecting positive sentiment across the industry.
- Nasdaq-100 Futures: Up 1.5%, driven by Nvidia’s influence on growth stocks.
Investment Implications for Financial Advisors & Asset Managers
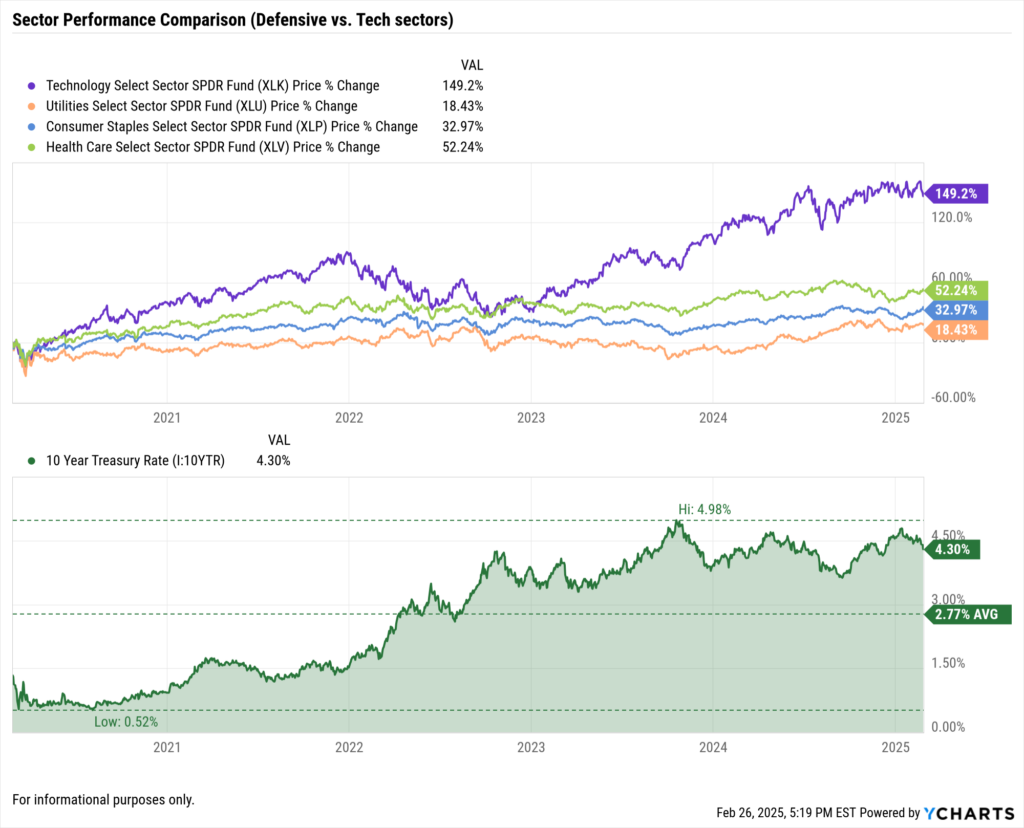
Tech & AI Sector Outlook: Where Are the Opportunities?
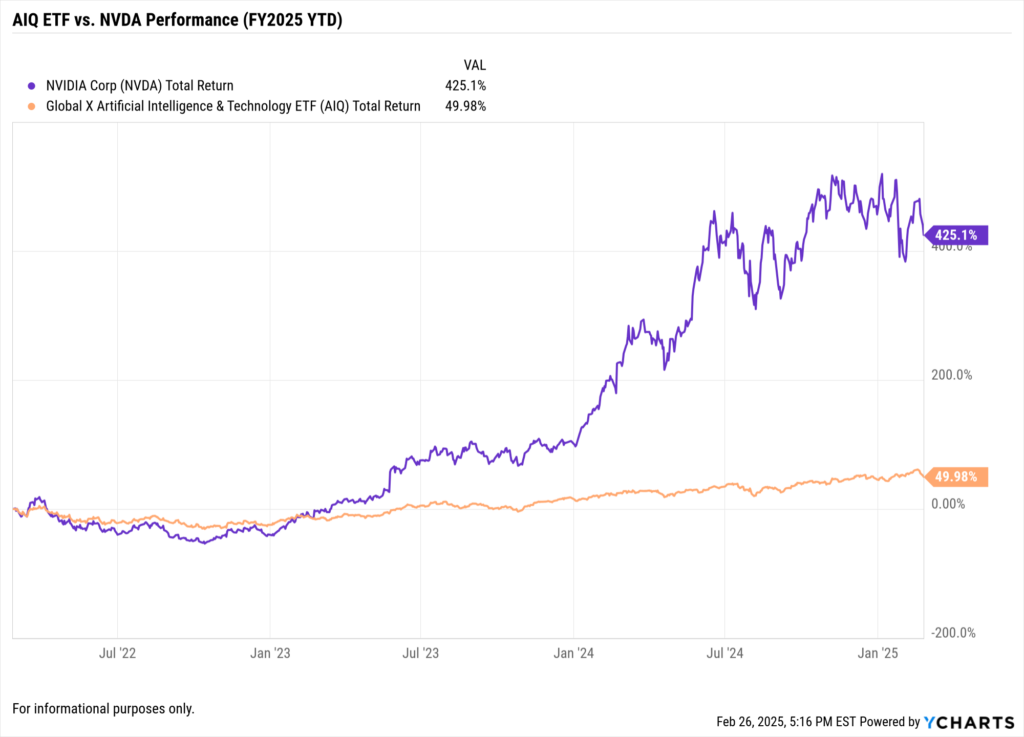
Nvidia’s strong report reinforces the AI investment thesis, with implications for:
- Semiconductors: Competitors like AMD, Broadcom, and Taiwan Semiconductor may benefit from AI-driven demand.
- Cloud Computing: AI infrastructure spending continues to drive revenue for Microsoft, Amazon, and Google.
- AI ETFs: Funds like the Global X AI & Big Data ETF (AIQ) and iShares Semiconductor ETF (SOXX) could see inflows.
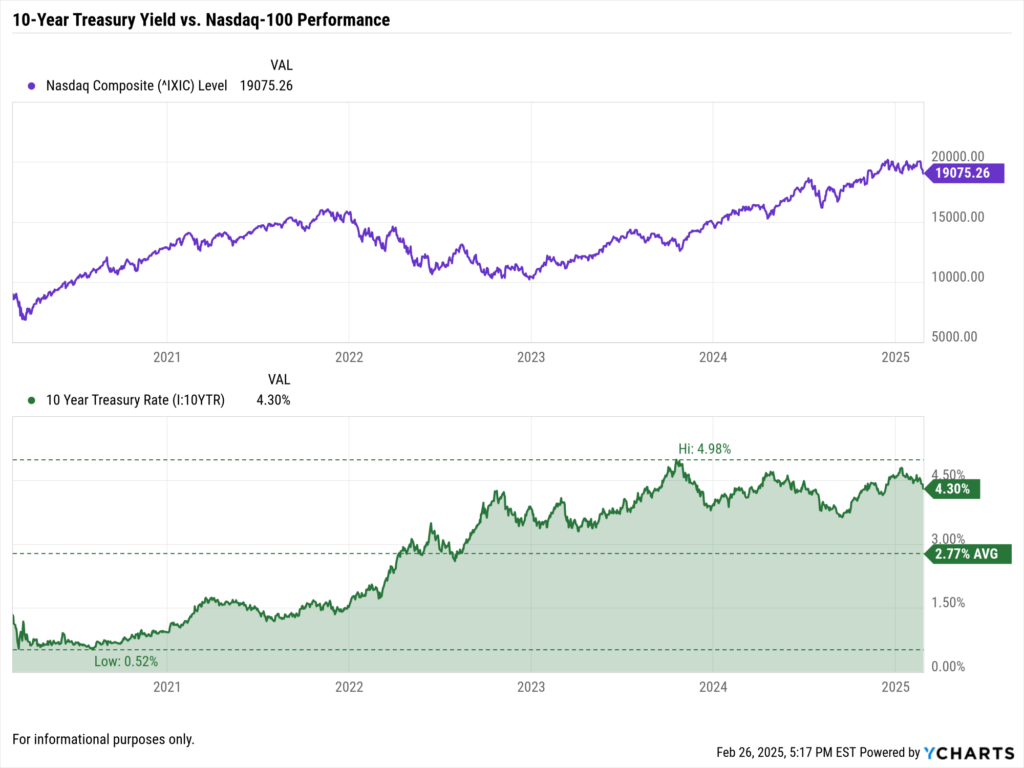
Fixed Income: Rising Treasury Yields & Growth Stock Valuations
While Nvidia’s earnings are bullish for tech, rising Treasury yields could impact valuations for high-growth stocks.
- 10-Year Treasury Yield: Recently climbed to 4.3%, increasing discount rates for long-duration assets.
- Equity Premium Risk: Growth stocks remain sensitive to macroeconomic conditions.
Portfolio Positioning: Balancing AI Exposure & Risk
For financial advisors and asset managers, today’s report supports continued AI exposure, but with risk considerations.
- Long-Term AI Allocation: Nvidia remains a core AI holding, but could balance exposure with diversification.
- Hedging Strategies: Options-based hedging or sector rotation may help manage volatility.
- Dividend Growth Stocks: Investors may consider blending AI exposure with dividend-paying technology firms for stability.
How YCharts Helps Financial Professionals Track AI & Market Trends
YCharts offers the tools advisors need to analyze Nvidia’s earnings in real-time and adjust portfolios accordingly.
- Track AI & Semiconductor Sector Trends: Compare NVDA against semiconductor ETFs, tech sector indices, and peer stocks.
- Monitor Treasury Yields & Market Correlations: Use YCharts’ Economic Indicators to track macroeconomic trends that impact AI valuations.
- Create Client-Ready Reports: Generate data-backed insights to guide AI-focused investment strategies.
Start tracking Nvidia’s AI dominance today: Request a Free YCharts Trial
Conclusion: Nvidia’s Earnings Set the Tone for AI Investing
Nvidia’s strong Q4 FY2025 results reaffirm its leadership in AI computing and semiconductors, with broad implications for markets:
- AI-driven data center growth remains a long-term investment theme.
- Technology and semiconductor ETFs could see inflows following strong earnings.
- Interest rate trends remain a key factor for NVDA’s valuation and overall tech sector performance.
For asset managers and financial advisors, today’s report underscores the importance of tracking AI industry leaders while balancing market risks and sector exposure.
Whenever you’re ready, there are 3 ways YCharts can help you:
1. Looking for a best-in-class data & visualization tool?
Send us an email at hello@ycharts.com or call (866) 965-7552. You’ll be directly in touch with one of our Chicago-based team members.
2. Want to test out YCharts for free?
Start a no-risk 7-Day Free Trial.
3. Get your copy of The Top Metrics Advisors Used in Portfolio Reports: 2024
Disclaimer
©2025 YCharts, Inc. All Rights Reserved. YCharts, Inc. (“YCharts”) is not registered with the U.S. Securities and Exchange Commission (or with the securities regulatory authority or body of any state or any other jurisdiction) as an investment adviser, broker-dealer or in any other capacity, and does not purport to provide investment advice or make investment recommendations. This report has been generated through application of the analytical tools and data provided through ycharts.com and is intended solely to assist you or your investment or other adviser(s) in conducting investment research. You should not construe this report as an offer to buy or sell, as a solicitation of an offer to buy or sell, or as a recommendation to buy, sell, hold or trade, any security or other financial instrument. For further information regarding your use of this report, please go to: ycharts.com/about/disclosure
Next Article
Apple’s $500 Billion U.S. Investment: What It Means for Asset Managers & Financial AdvisorsRead More →