Q1 2025 Consumer Staples Earnings: Live Updates & Market Reactions

Updated as of: April 30, 2025 @ 11:38AM CST
Introduction: How Consumer Staples Are Navigating Inflation and Trade Pressures
As Q1 2025 earnings unfold, the Consumer Staples sector is under scrutiny. Traditionally seen as a defensive play during economic uncertainty, this quarter reveals a complex picture. While pricing power remains evident, volume softness and geopolitical challenges are testing the resilience of major players. This live-updating blog provides financial professionals with timely insights into key earnings reports, management commentary, and YCharts visualizations to inform investment decisions.
Latest Earnings Reports
YCharts users can view a full breakdown of all current and upcoming earnings calls and reports live here.
Not a YCharts user? Try a 7-Day Free Trial.
April 30, 2025 Earnings
PepsiCo Inc. (PEP) Faces Tariff Headwinds and Lowers 2025 Outlook
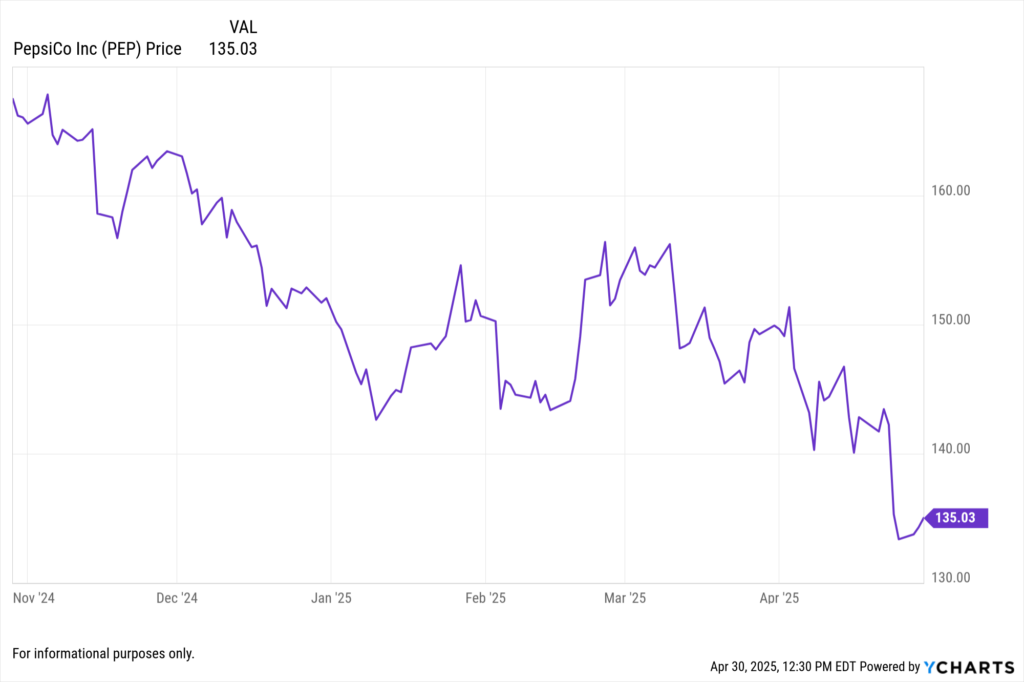
PepsiCo reported Q1 2025 revenue of $17.92 billion, a 1.8% decline year-over-year, narrowly beating forecasts. Net income stood at $1.83 billion, or $1.33 per share, missing estimates by $0.15. The company cited foreign exchange headwinds and rising costs due to new tariffs, including a 10% levy on soda concentrate imports from Ireland and a 25% tariff on aluminum. These factors led to a downward revision of its full-year earnings forecast.
View PepsiCo’s Earnings Report Here >
April 29, 2025 Earnings
Sysco Corp. (SYY) Cuts Annual Forecast Amid Weak Restaurant Traffic
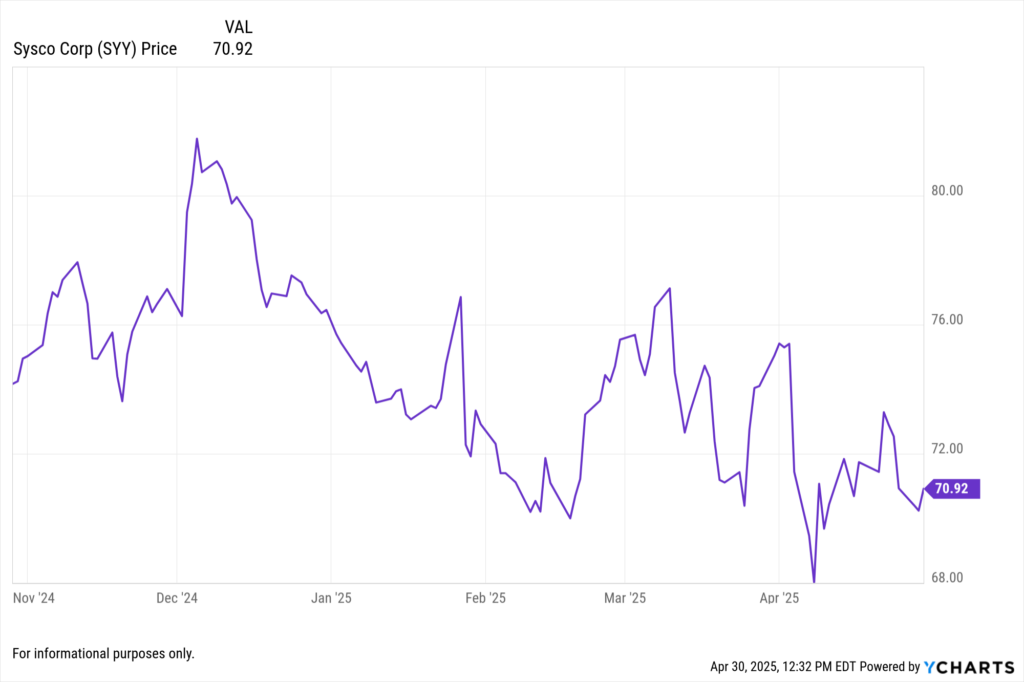
Sysco reported Q3 FY2025 revenue of $19.6 billion, a 1.1% increase year-over-year, but below analyst estimates of $20.05 billion. Adjusted EPS came in at $0.96, missing expectations of $1.02. The company lowered its annual forecast, citing weakening consumer sentiment and reduced restaurant traffic, exacerbated by the Trump administration’s tariffs.
View Sysco’s Earnings Report Here >
Coca-Cola Co. (KO) Delivers Mixed Q1 Results; Maintains 2025 Outlook
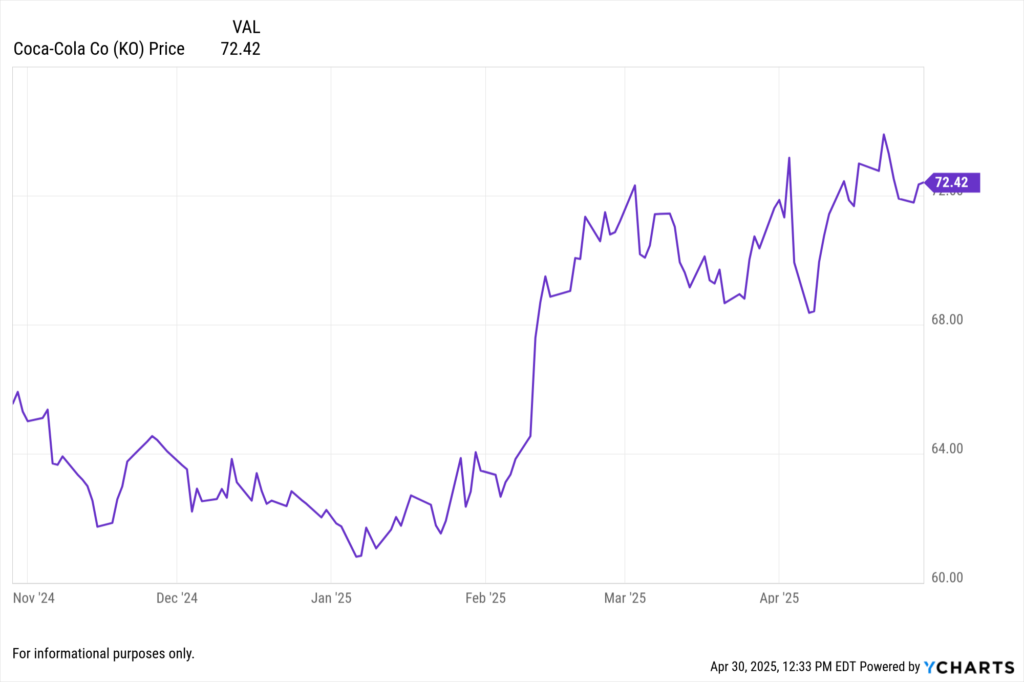
Coca-Cola reported Q1 2025 revenue of $11.13 billion, a 2% decline year-over-year, impacted by currency headwinds and refranchising of bottling operations. Net income rose to $3.33 billion, up from $3.18 billion a year earlier. Adjusted EPS increased by 1% to $0.73, slightly beating analyst expectations. The company maintained its full-year EPS growth outlook of 2-3%, stating that tariff impacts are manageable due to its localized production strategy.
View Coca-Cola’s Earnings Report Here >
April 23, 2025 Earnings
Philip Morris International Inc. (PM) Surpasses Q1 Expectations with Strong Smoke-Free Product Sales
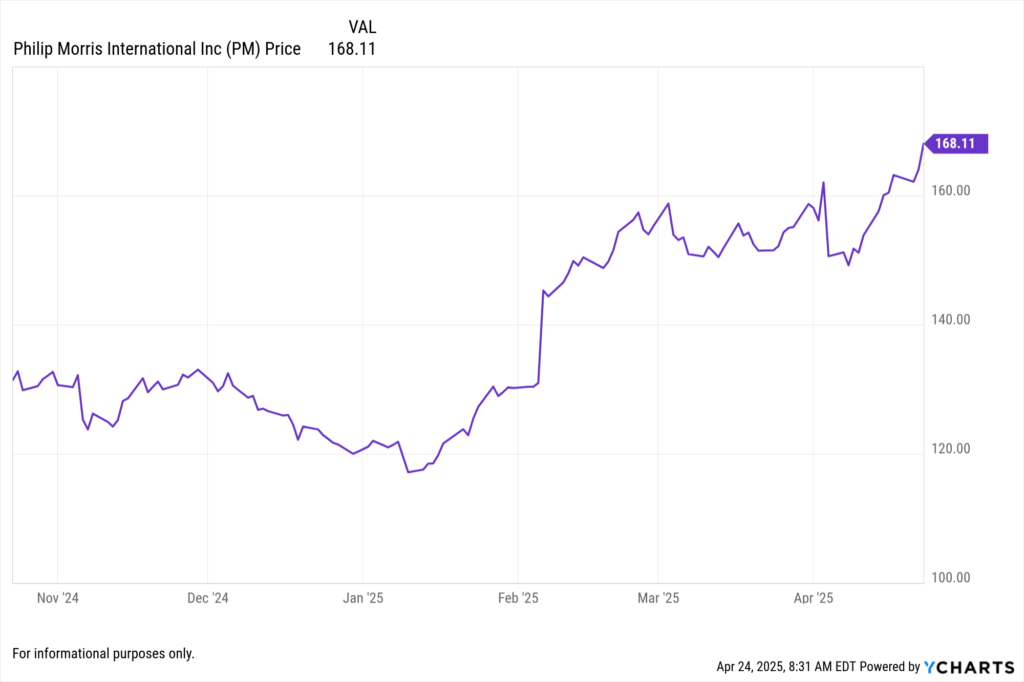
Philip Morris International reported Q1 2025 adjusted earnings per share (EPS) of $1.69 on revenue of $9.30 billion, exceeding analyst expectations. The company’s smoke-free products, notably the ZYN nicotine pouches, accounted for 42% of total revenue, with U.S. shipment volumes of ZYN increasing by 53% year-over-year. In response to the strong performance, Philip Morris raised its full-year adjusted EPS guidance to a range of $7.36 to $7.49, up from the previous forecast of $7.04 to $7.17.
View Philip Morris International Inc’s Earnings Report Here >
April 22, 2025 Earnings
Kimberly-Clark Corporation (KMB) Reports Q1 Revenue Decline Amid Tariff Pressures
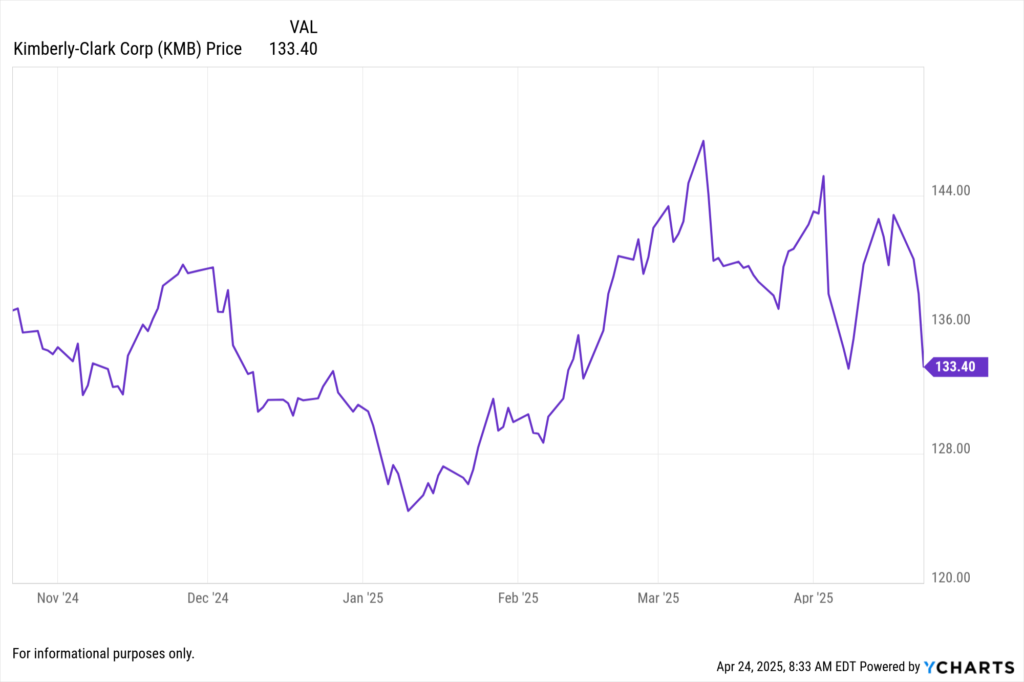
Kimberly-Clark reported Q1 2025 revenue of $4.84 billion, a 6% decrease year-over-year, falling short of analyst estimates. Adjusted EPS came in at $1.93, slightly above expectations. The company cited increased costs due to tariffs, projecting a $300 million impact on gross margins for the year. Consequently, Kimberly-Clark revised its full-year EPS guidance to reflect flat growth, down from the previously anticipated 6.5% increase.
View Kimberly-Clark Corporation’s Earnings Report Here >
April 15, 2025 Earnings
Albertsons Companies Inc. (ACI) Reports Q4 2024 Results with Modest EPS Beat
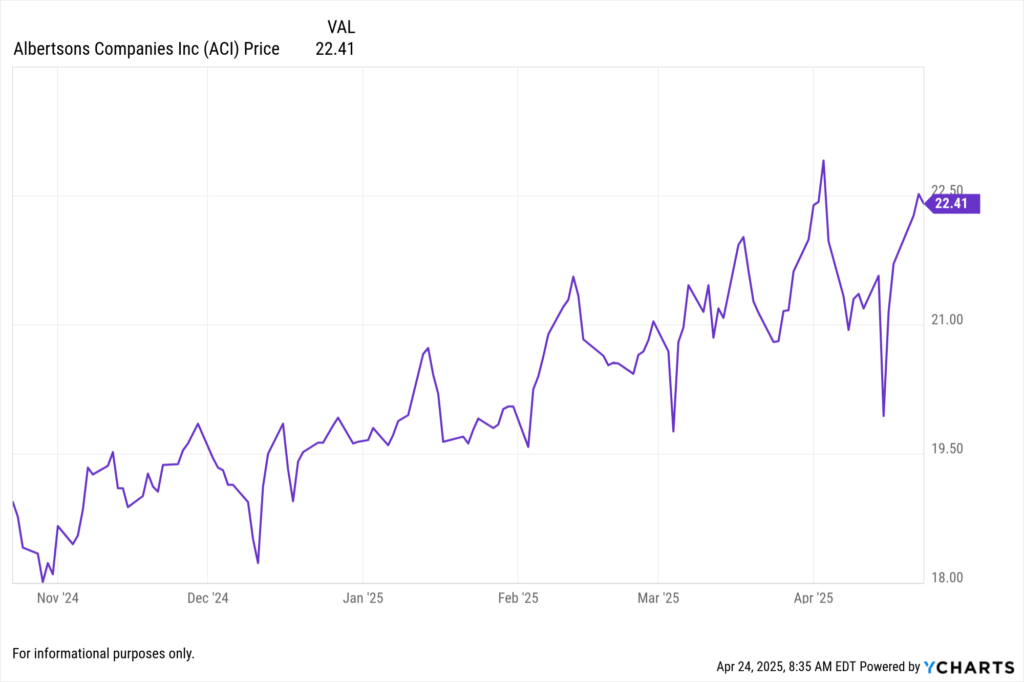
Albertsons Companies announced its fiscal Q4 2024 earnings on April 15, 2025, reporting earnings per share (EPS) of $0.46, surpassing the consensus estimate of $0.40 by $0.06. Quarterly revenue reached $18.80 billion, slightly above analyst expectations of $18.78 billion . The company highlighted significant growth in its pharmacy segment, with pharmacy revenue increasing 18% year-over-year, driven by leading script and immunization growth . Despite the earnings beat, Albertsons’ shares experienced a decline due to a weaker-than-anticipated profit outlook for fiscal 2025.
View Albertsons Companies Inc’s Earnings Report Here >
How YCharts Can Help
Event Calendar: Track upcoming earnings reports in the Consumer Staples sector.
Fundamental Charts: Compare revenue, EPS, and other key metrics over time.
Stock Screeners: Identify top-performing stocks based on customized criteria.
Custom Reports: Create shareable reports for client presentations and updates.
Whenever you’re ready, here’s how YCharts can help you:
1. Looking to Move On From Your Investment Research and Analytics Platform?
2. Want to test out YCharts for free?
Start a no-risk 7-Day Free Trial.
Disclaimer
©2025 YCharts, Inc. All Rights Reserved. YCharts, Inc. (“YCharts”) is not registered with the U.S. Securities and Exchange Commission (or with the securities regulatory authority or body of any state or any other jurisdiction) as an investment adviser, broker-dealer or in any other capacity, and does not purport to provide investment advice or make investment recommendations. This report has been generated through application of the analytical tools and data provided through ycharts.com and is intended solely to assist you or your investment or other adviser(s) in conducting investment research. You should not construe this report as an offer to buy or sell, as a solicitation of an offer to buy or sell, or as a recommendation to buy, sell, hold or trade, any security or other financial instrument. For further information regarding your use of this report, please go to: ycharts.com/about/disclosure
Next Article
Q1 2025 Consumer Discretionary Earnings: Live Updates & Market ReactionsRead More →