Q1 2025 Earnings Recap: Sector Trends & Tariff Impact Analysis

Introduction: Initial Observations
The recently concluded Q1 2025 earnings season offered a complex tapestry of performance across the U.S. equity market. While certain sectors demonstrated resilience and even robust growth, the undercurrent of persistent inflation, evolving consumer behavior, and the re-emergence of trade tensions cast a shadow on the overall outlook. This report dissects the key trends observed during this earnings period, analyzes their potential impact on the broader market, and examines how the current landscape of tariff policies could shape investment strategies for the remainder of the year.
Key Takeaways from Q1 2025 Earnings
Instead of a simple sector-by-sector rundown, let’s focus on the overarching themes and critical data points that emerged, providing a more holistic view for investment professionals.
The Resilience of Innovation: Technology and Healthcare Lead
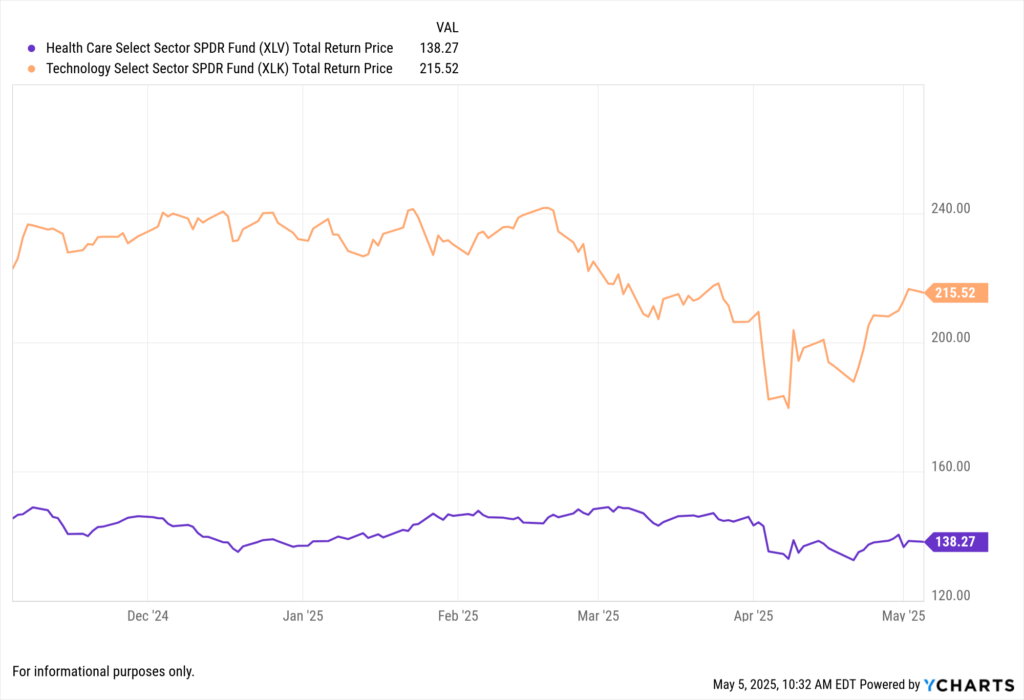
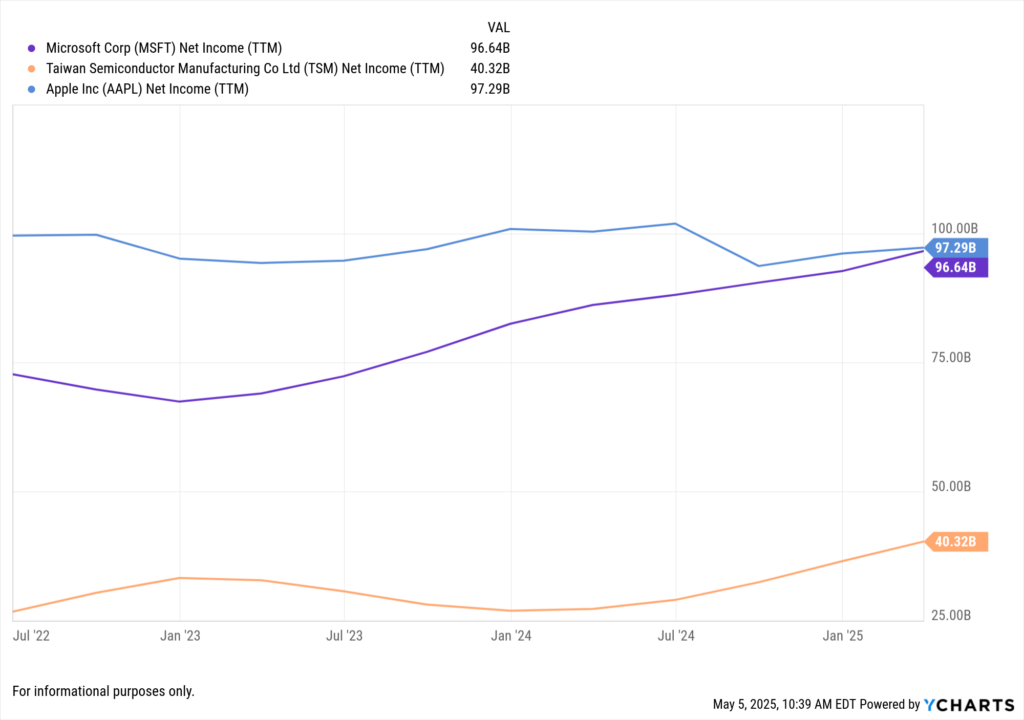
The Technology (XLK) and Healthcare (XLV) sectors stood out for their strong earnings performance. In Technology, the continued proliferation of artificial intelligence and the sustained demand for cloud computing services fueled impressive results for giants like NVIDIA and Microsoft. This underscores the market’s ongoing appetite for innovation and the digital transformation narrative.
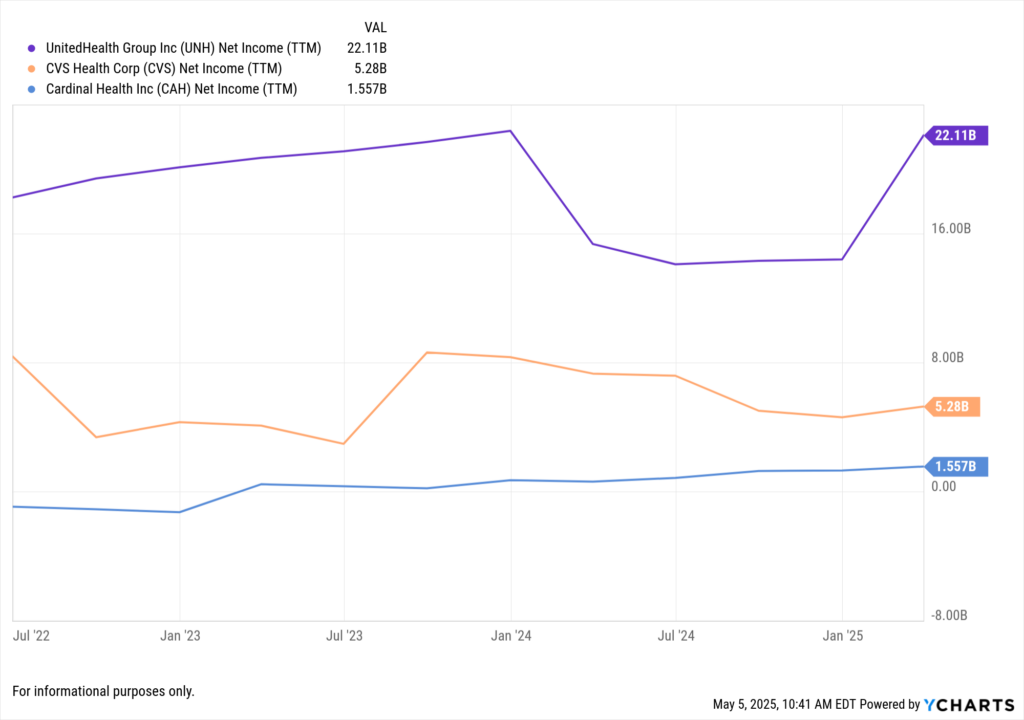
Similarly, the Healthcare sector exhibited its characteristic resilience, driven by consistent demand for services and advancements in medical treatments. The demographic tailwind of an aging population further solidifies the long-term growth prospects for this sector.
Implication for Investors: Allocations towards companies driving technological advancements and those in the stable and growing healthcare space may continue to offer compelling opportunities, even amidst broader economic uncertainties.
Consumer Spending Under Scrutiny: Discretionary vs. Staples
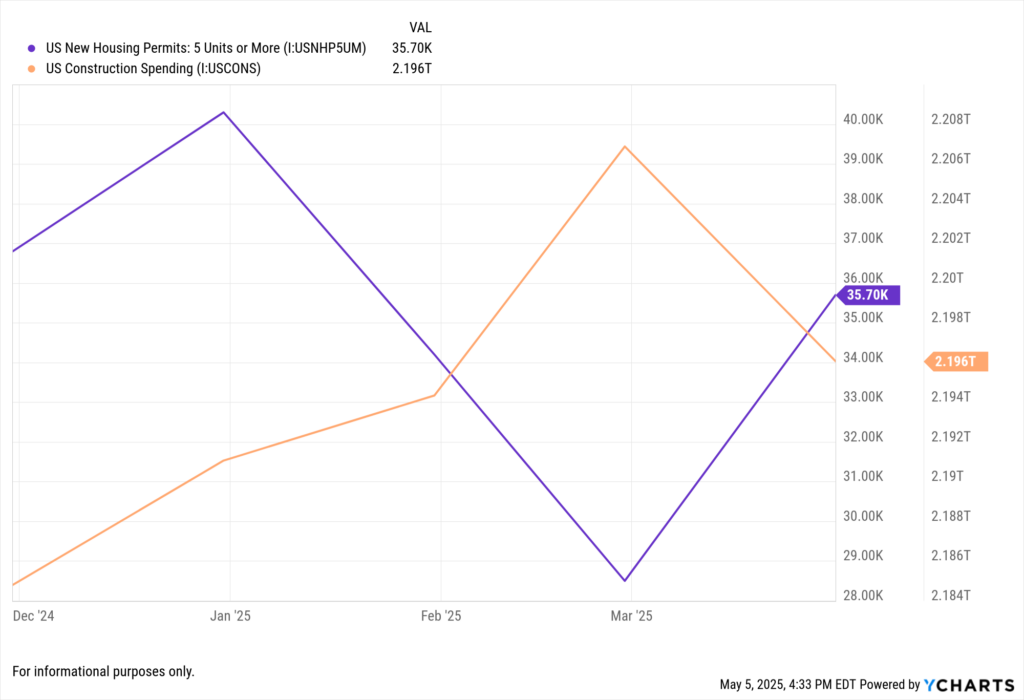
The performance of the Consumer Discretionary (XLY) and Consumer Staples (XLP) sectors painted a nuanced picture of the American consumer. While some discretionary companies, like homebuilders such as Taylor Morrison, reported strong revenues, the sector as a whole showed signs of increased sensitivity to pricing pressures. This suggests that while consumer spending remains relatively robust, the impact of inflation and potentially higher prices due to tariffs is beginning to factor into purchasing decisions.
In contrast, the Consumer Staples sector delivered stable earnings, reflecting the consistent demand for essential goods. However, even within this traditionally defensive sector, companies noted increasing input costs, hinting at potential margin compression if these costs cannot be fully passed on to consumers.
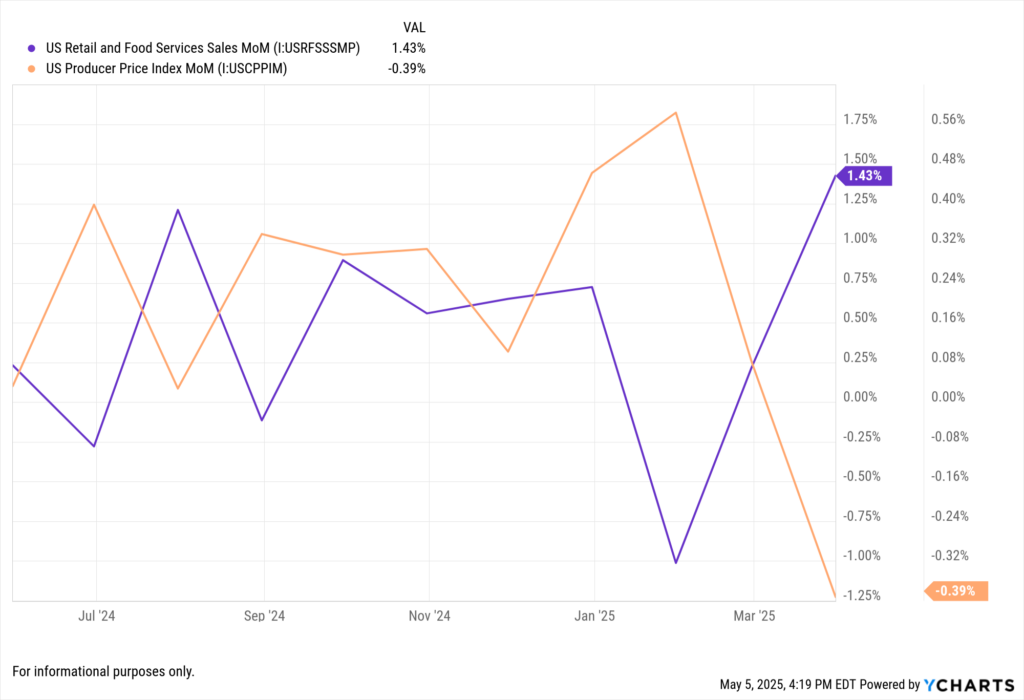
Implication for Investors: A more cautious approach to consumer-related sectors might be warranted. Favoring companies with strong pricing power or those offering essential goods could be a prudent strategy in an environment where consumer budgets may come under increasing pressure. Monitoring key consumer confidence indicators and retail sales data will be crucial in the coming quarters.
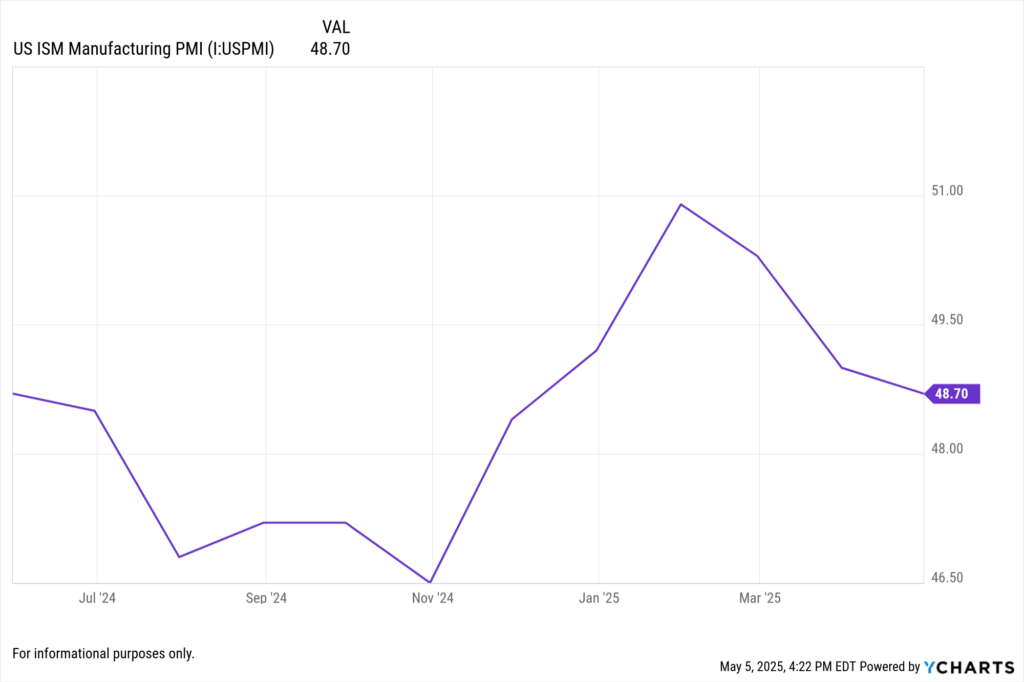
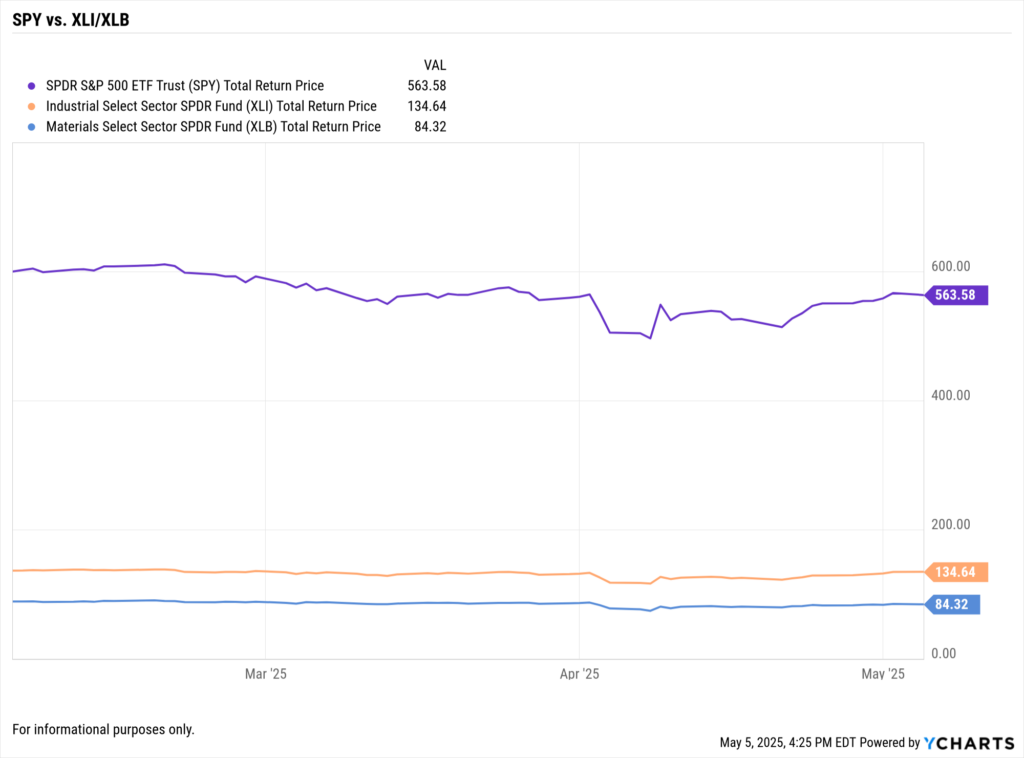
Industrial and Materials Sectors Feel the Pinch: Tariff Effects Materialize
The Industrials (XLI) and Materials (XLB) sectors provided a clear illustration of the tangible impact of the current tariff regime. Increased costs for raw materials like steel and aluminum, coupled with ongoing supply chain complexities, presented significant headwinds for many industrial companies, impacting their profitability.
Similarly, the Materials sector experienced a mixed bag, with some segments, such as precious metals, benefiting from global uncertainty. However, broader pricing pressures and disruptions to supply chains due to tariffs weighed on the performance of other material producers.
Implication for Investors: Sectors heavily reliant on raw materials and global supply chains are likely to face continued margin pressure if tariffs remain in place. Investors should carefully analyze companies within these sectors for their ability to mitigate these cost increases through operational efficiencies or pricing strategies.
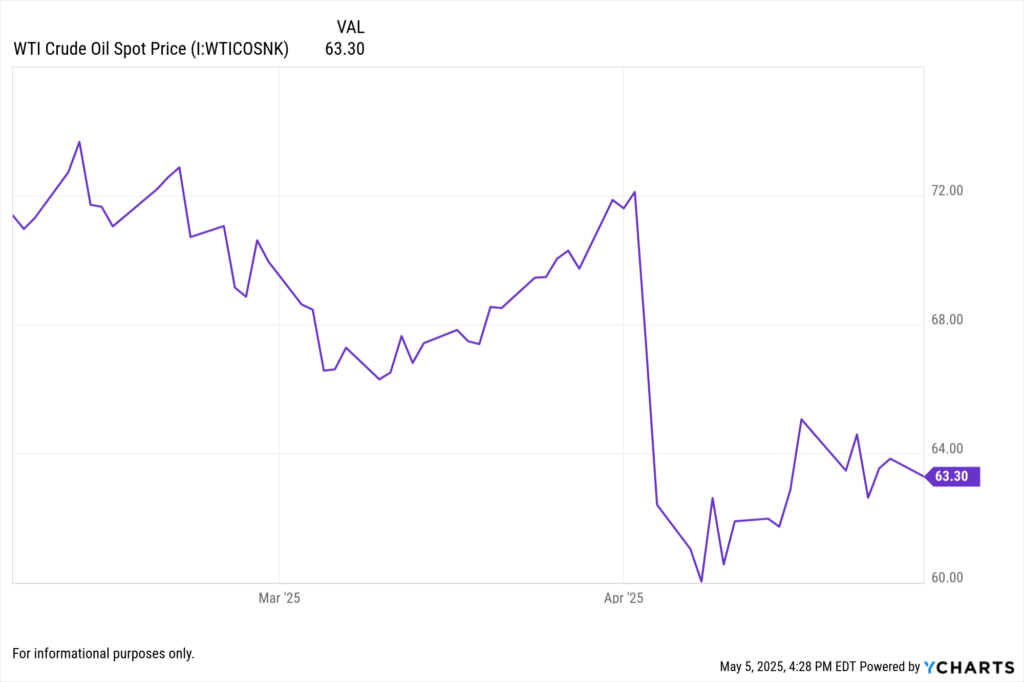
Energy and Financials Navigate Uncertainty
The Energy (XLE) sector’s performance was characterized by volatility, largely driven by fluctuations in global oil prices and geopolitical factors. While earnings can be significant during periods of high energy prices, the long-term outlook remains subject to global demand dynamics and the transition towards cleaner energy sources. Tariffs on imported equipment also add a layer of complexity to the sector’s cost structure.
The Financials (XLF) sector reported steady earnings, primarily supported by the prevailing higher interest rate environment. However, the indirect impact of tariffs leading to a potential economic slowdown could negatively affect loan demand and credit quality in the future. Monitoring macroeconomic indicators and Federal Reserve policy will be critical for assessing the trajectory of this sector.
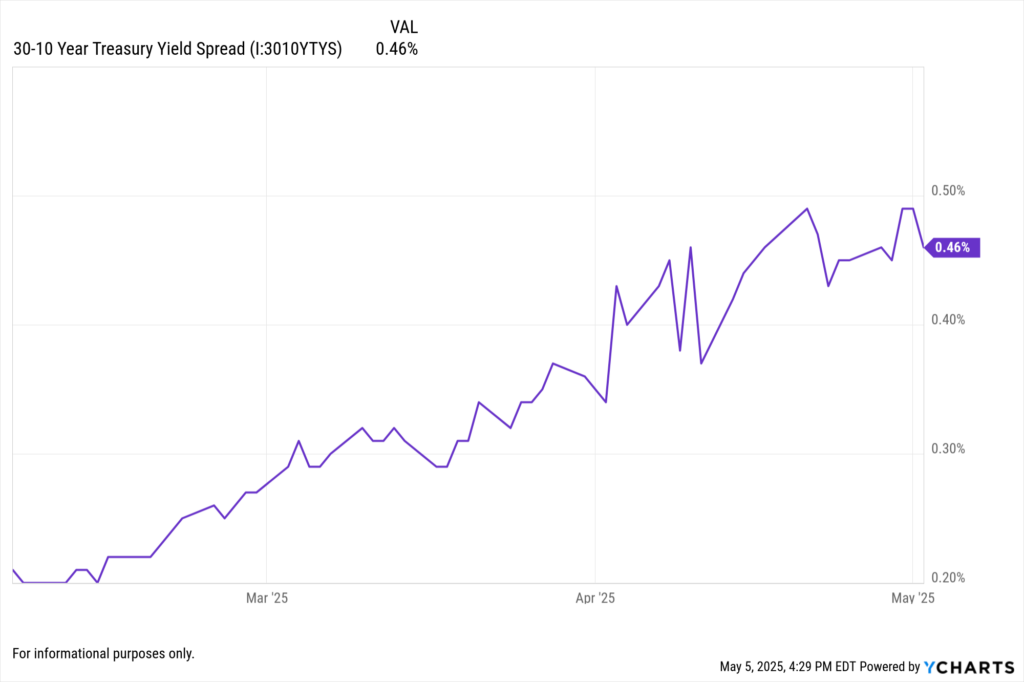
Implication for Investors: The Energy sector requires a nuanced understanding of global supply and demand dynamics, as well as geopolitical risks. For Financials, a close watch on economic growth and interest rate movements is essential to gauge future performance.
Real Estate and Utilities: Stability with Caveats
The Real Estate (XLRE) sector demonstrated relative stability, supported by generally low vacancy rates and stable rental income. However, rising construction costs, partly attributable to tariffs on building materials, could pose challenges for future development projects and potentially impact long-term returns.
The Utilities (XLU) sector also reported modest but stable earnings, benefiting from regulated pricing structures. However, investments in renewable energy infrastructure, which may involve imported components subject to tariffs, could increase capital expenditures.
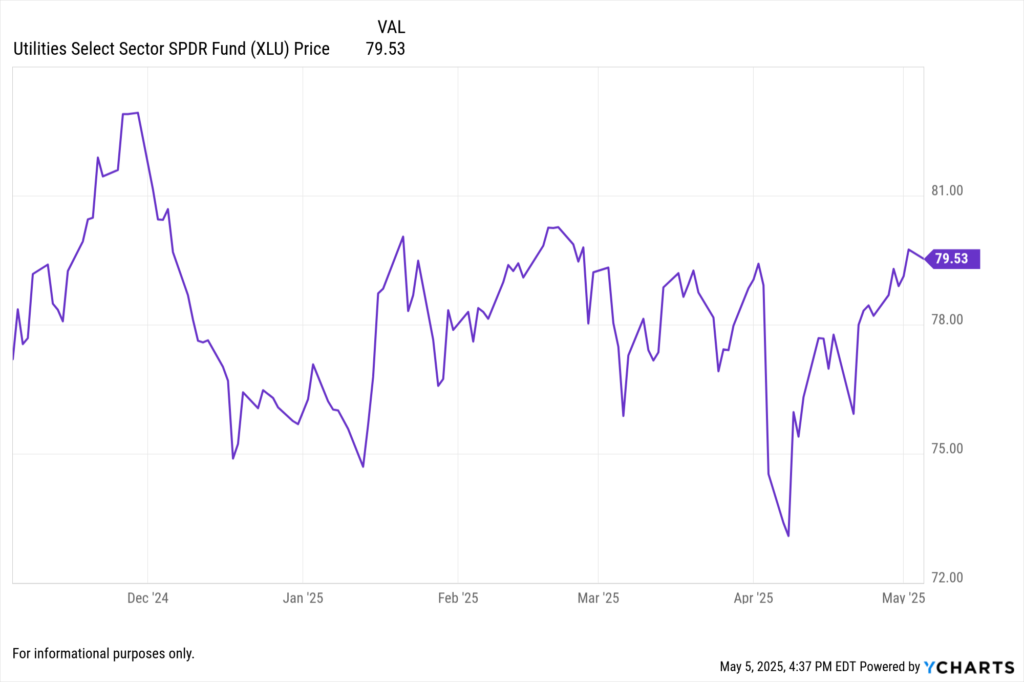
Implication for Investors: While these sectors offer stability, investors should be mindful of the potential long-term impacts of rising costs on profitability and development pipelines.
The Tariff Tailwind (or Headwind?): Shaping the Market Outlook
President Trump’s current tariff policies, particularly those targeting Chinese imports and key industrial materials, are increasingly becoming a significant factor influencing the U.S. economic landscape and market performance.
- Increased Input Costs and Inflation: The most immediate impact of tariffs is the direct increase in the cost of imported goods. This ripples through various sectors, from manufacturing (Industrials, Materials) to consumer goods (Consumer Discretionary, Consumer Staples), potentially leading to higher inflation and squeezing corporate margins.
- Supply Chain Adjustments and Inefficiencies: Tariffs can incentivize companies to shift their supply chains, which can lead to temporary inefficiencies and increased costs as new sourcing and production networks are established.
- Potential for Retaliation and Trade Wars: The imposition of tariffs by the U.S. can provoke retaliatory measures from other countries, further disrupting global trade and negatively impacting export-oriented sectors.
- Impact on Consumer Spending: Higher prices resulting from tariffs can erode consumer purchasing power, potentially dampening demand, particularly for non-essential goods.
Looking Ahead: If the current tariff policies remain in effect, we anticipate continued upward pressure on inflation, potential headwinds for corporate earnings in tariff-sensitive sectors, and increased market volatility due to trade policy uncertainty. The extent of these impacts will depend on the duration and scope of the tariffs, as well as any potential retaliatory actions from trading partners.
How YCharts Can Help
Event Calendar: Track upcoming earnings dates and calls across the S&P 500 and beyond
➝ View the Event Calendar
Fundamental Charts: Compare quarterly revenue, EPS, margins, and stock price reactions over time
➝ Explore Fundamental Charts
Stock Screeners: Filter stocks by post-earnings reaction, YoY EPS growth, or earnings surprise
➝ Try the Stock Screener
Custom Reports: Create client-ready visuals showing earnings-driven portfolio performance
➝ Build a Custom Report
Conclusion: Adapting to a Tariff-Influenced Market
The Q1 2025 earnings season offered valuable insights into the current state of the U.S. economy and the varying resilience of different sectors. However, the looming presence of tariff policies introduces a significant layer of complexity and uncertainty for the remainder of the year. By focusing on data-driven analysis, understanding the specific exposures of different sectors and companies, and leveraging powerful tools like YCharts, asset managers and advisors can navigate this evolving landscape and make informed decisions to protect and grow their clients’ portfolios. Staying agile and continuously monitoring both economic data and policy developments will be crucial in the months ahead.
Whenever you’re ready, here’s how YCharts can help you:
1. Looking to Move On From Your Investment Research and Analytics Platform?
2. Want to test out YCharts for free?
Start a no-risk 7-Day Free Trial.
Disclaimer
©2025 YCharts, Inc. All Rights Reserved. YCharts, Inc. (“YCharts”) is not registered with the U.S. Securities and Exchange Commission (or with the securities regulatory authority or body of any state or any other jurisdiction) as an investment adviser, broker-dealer or in any other capacity, and does not purport to provide investment advice or make investment recommendations. This report has been generated through application of the analytical tools and data provided through ycharts.com and is intended solely to assist you or your investment or other adviser(s) in conducting investment research. You should not construe this report as an offer to buy or sell, as a solicitation of an offer to buy or sell, or as a recommendation to buy, sell, hold or trade, any security or other financial instrument. For further information regarding your use of this report, please go to: ycharts.com/about/disclosure
Next Article
Monthly Market Wrap: April 2025Read More →