Q1 2025 Energy Sector Earnings: Key Highlights & Market Reactions
Introduction: Energy Markets Face Margin Compression and Demand Uncertainty
The Q1 2025 Energy Sector Earnings season is highlighting major shifts in the Energy sector. While oil prices remained volatile and refining margins compressed year-over-year, operational efficiency and downstream integration have helped several companies outperform lowered analyst expectations. Refiners, service providers, and integrated majors alike are grappling with softer demand signals, higher input costs, and global inventory buildups.
This live-updating blog provides financial professionals with timely insights into key Energy sector earnings releases, commentary from management teams, and YCharts visualizations that can help inform portfolio decisions as volatility persists.
Latest Earnings Reports
YCharts users can view a full breakdown of all current and upcoming earnings calls and reports live here.
Not a YCharts user? Try a 7-Day Free Trial.
April 25, 2025 Earnings
Schlumberger Ltd. (SLB) Reports Record International Growth in Q1 2025
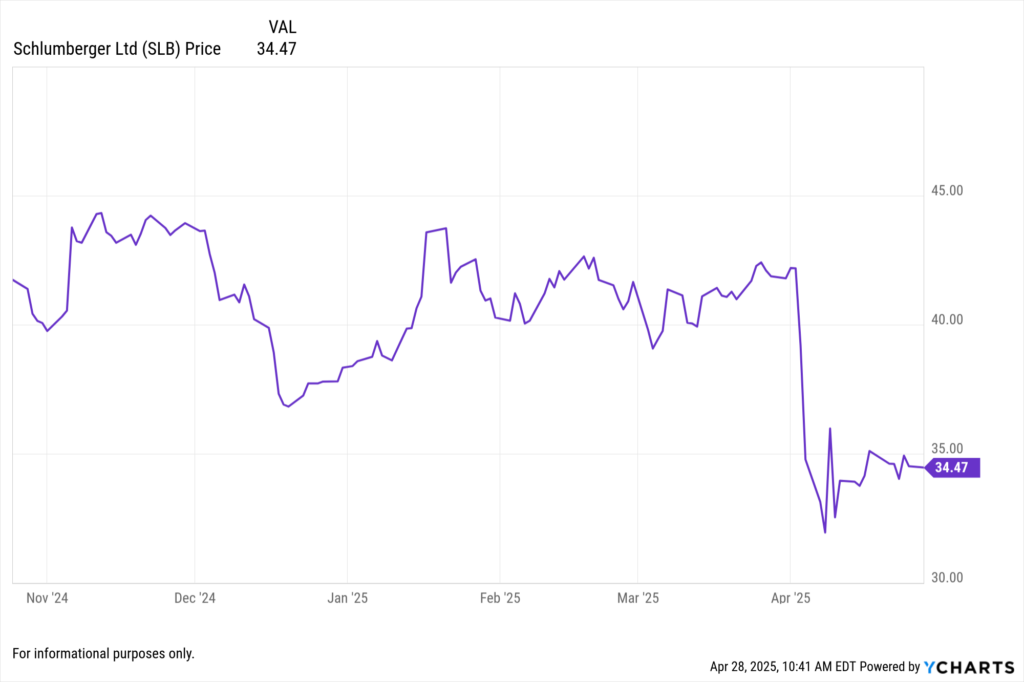
Schlumberger (SLB) posted Q1 2025 revenue of $9.82 billion, a 12.3% year-over-year increase, driven by strength in international markets, particularly in the Middle East and offshore drilling segments. Normalized diluted EPS for the trailing twelve months reached $3.391. Management cited ongoing investments in exploration and production (E&P) activities outside North America as key drivers, helping offset weaker U.S. land activity. SLB reaffirmed full-year revenue and margin guidance, signaling confidence in the global E&P spending cycle.
View Schlumberger Ltd.’s Earnings Report Here >
Phillips 66 (PSX) Faces Refining Margin Headwinds but Delivers Solid Q1 Results
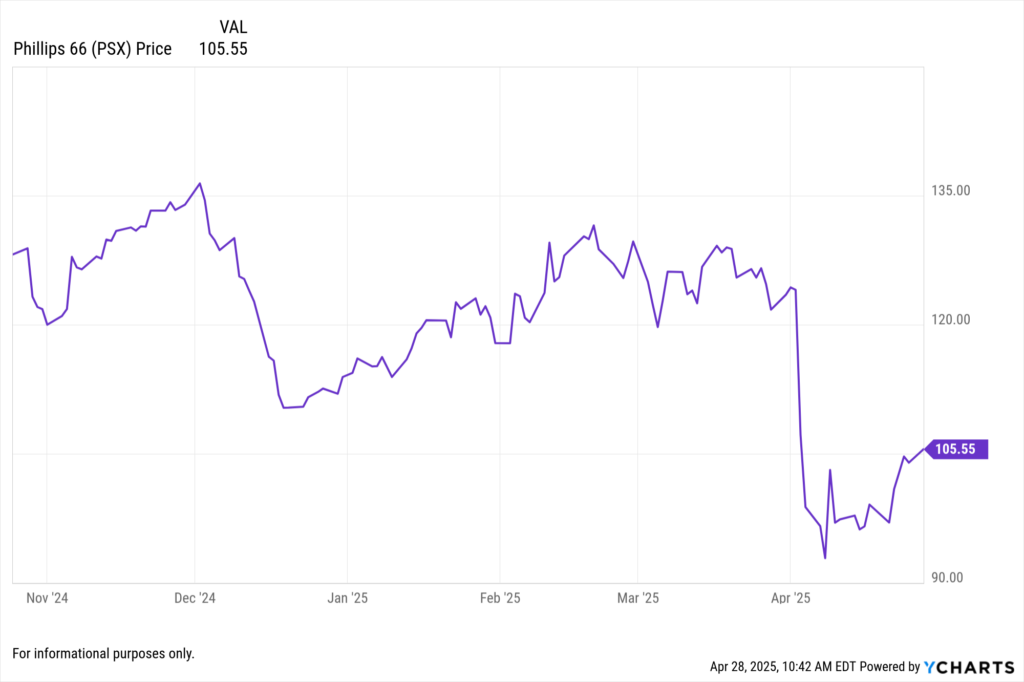
Phillips 66 reported Q1 2025 revenue of $35.4 billion, marking a 3% year-over-year decline, while normalized diluted EPS came in at $5.119 for the trailing twelve months. Net income for the quarter was $796 million. Management pointed to weaker Gulf Coast and Atlantic Basin refining margins, offset partially by strong Chemicals and Midstream performance. Phillips 66 expects margin recovery later in the year, especially as summer travel demand picks up.
View Phillips 66’s Earnings Report Here >
April 24, 2025 Earnings
World Kinect Corp (WKC) Posts Strong Q1 Amid Cost Control Initiatives
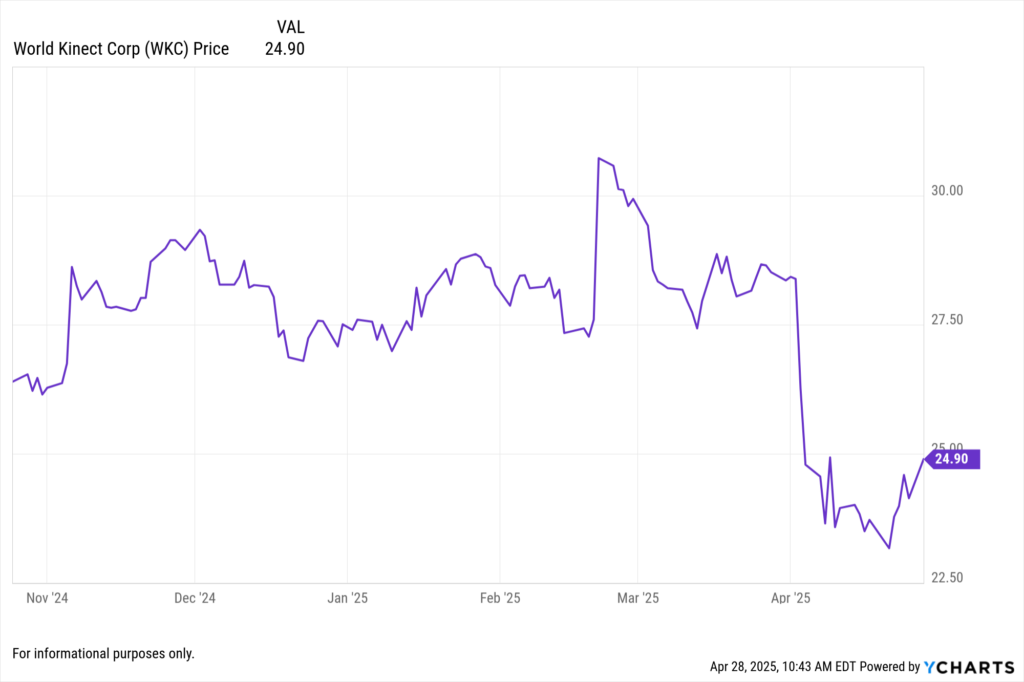
World Kinect Corporation reported Q1 2025 revenue of $10.74 billion, relatively flat year-over-year, but achieved meaningful margin expansion through cost optimization efforts. Net income reached $67.4 million, with normalized diluted EPS at 1.662. The company delivered an impressive 5.46% positive annual EPS surprise, highlighting the effectiveness of its global energy logistics and supply chain management strategies.
View World Kinect Corp’s Earnings Report Here >
Valero Energy Corp (VLO) Beats Expectations Despite Lower Refining Throughput
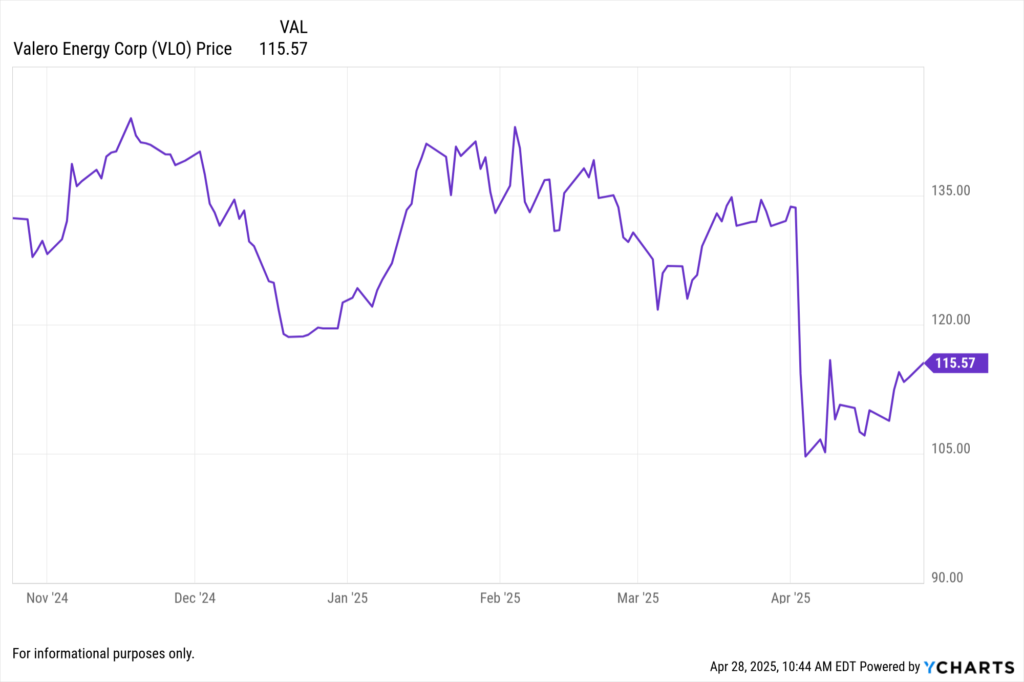
Valero Energy reported Q1 2025 net income of $930 million, normalized diluted EPS of 5.391, and revenue of $30.6 billion. Though throughput volumes decreased slightly versus Q1 2024, Valero outperformed analysts’ expectations with stronger-than-expected export margins and disciplined cost management. Management indicated that while crack spreads remain under pressure, resilient diesel demand is expected to support margins heading into Q2.
View Valero Energy Corp’s Earnings Report Here >
Eni SpA (E) Reports Decline in Net Income on Lower Hydrocarbon Prices
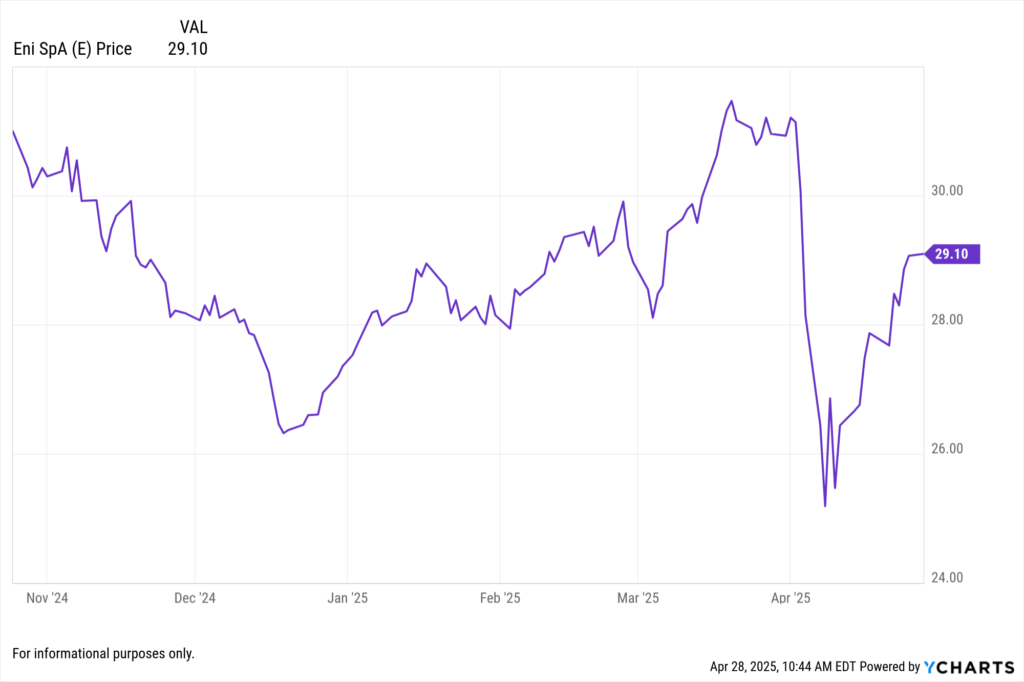
Eni (E) reported Q1 2025 revenue of $22.4 billion and net income of $1.1 billion, reflecting a 15% year-over-year decline. Normalized diluted EPS was 3.026 for the trailing twelve months. The company faced headwinds from lower realized oil and gas prices and softer refining margins, leading to a negative 10.34% annual EPS surprise. Eni reiterated its focus on accelerating renewables investments and maintaining dividend stability despite challenging upstream conditions.
View Eni SpA’s Earnings Report Here >
How YCharts Can Help
Event Calendar: Track upcoming earnings calls and key dates for Energy sector companies
Fundamental Charts: Visualize revenue, net income, EPS growth trends over time
Stock Screeners: Find high-performing Energy stocks based on EPS growth, margin strength, and dividend payouts
Custom Reports: Build client-ready earnings summaries and Energy sector reports with ease
Conclusion: Efficiency and Global Exposure Drive Q1 Energy Sector Standouts
The Q1 2025 Energy earnings season reveals a sector balancing cost discipline with shifting demand dynamics. Companies with strong international exposure (like Schlumberger) or diversified downstream businesses (like Valero and Phillips 66) outperformed despite broader margin pressures. Meanwhile, integrated majors such as Eni face tougher headwinds from hydrocarbon price declines and energy transition demands.
Stay tuned — as more Energy sector earnings come in, this page will be updated with the latest highlights, management insights, and actionable investment takeaways.
Whenever you’re ready, here’s how YCharts can help you:
1. Looking to Move On From Your Investment Research and Analytics Platform?
2. Want to test out YCharts for free?
Start a no-risk 7-Day Free Trial.
Disclaimer
©2025 YCharts, Inc. All Rights Reserved. YCharts, Inc. (“YCharts”) is not registered with the U.S. Securities and Exchange Commission (or with the securities regulatory authority or body of any state or any other jurisdiction) as an investment adviser, broker-dealer or in any other capacity, and does not purport to provide investment advice or make investment recommendations. This report has been generated through application of the analytical tools and data provided through ycharts.com and is intended solely to assist you or your investment or other adviser(s) in conducting investment research. You should not construe this report as an offer to buy or sell, as a solicitation of an offer to buy or sell, or as a recommendation to buy, sell, hold or trade, any security or other financial instrument. For further information regarding your use of this report, please go to: ycharts.com/about/disclosure
Next Article
iShares, PIMCO, and Fidelity Are Leading the Charge in Active Fixed Income ETFsRead More →
