Q1 2025 Materials Sector Earnings: Key Highlights & Market Reactions

Introduction: Margin Pressures and Commodity Volatility Shape Q1 Materials Results
The Q1 2025 Materials Sector Earnings season highlights a sector adapting to softer global demand, persistent inflationary inputs, and commodity price volatility. While chemical producers face margin compression, mining companies are leveraging gold and copper price stability to offset operational challenges. Financial professionals are closely monitoring trends in cost control, capex discipline, and global demand signals across the Materials space.
This live-updating blog captures the latest financial results, strategic commentary, and YCharts visualizations to support better investment decisions during this critical earnings season.
Latest Earnings Reports
YCharts users can view a full breakdown of all current and upcoming earnings calls and reports live here.
Not a YCharts user? Try a 7-Day Free Trial.
April 25, 2025 Earnings
Linde plc (LIN) Posts Strong Q1 Amid Stable Industrial Gas Demand
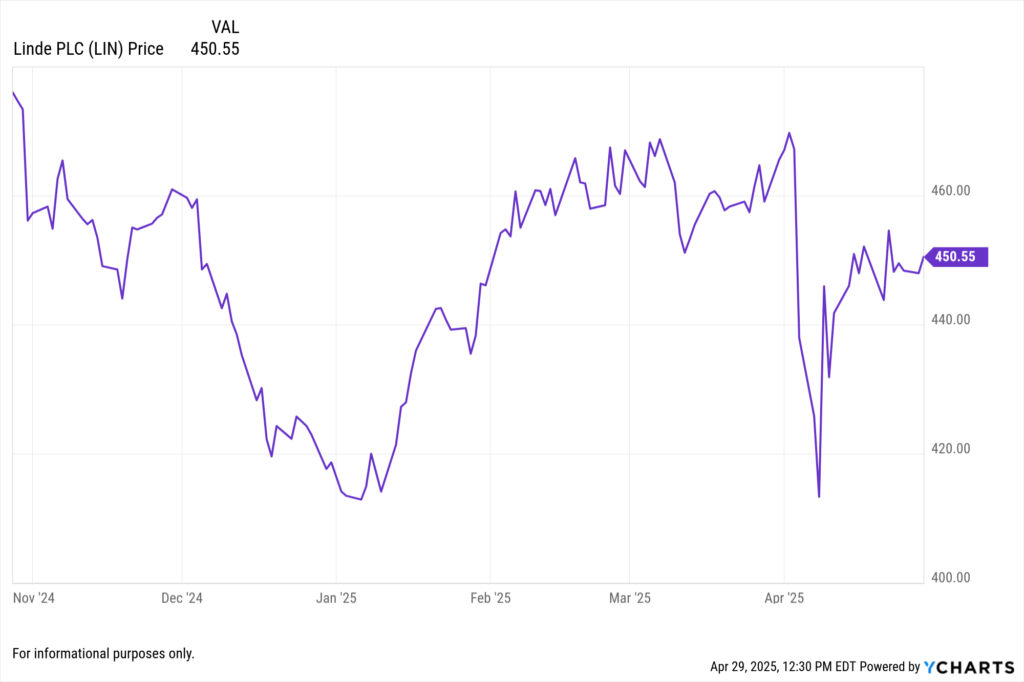
Linde reported Q1 2025 revenue of $8.4 billion, roughly flat year-over-year, but delivered EPS of $3.90, exceeding consensus estimates. Resilient pricing in healthcare, electronics, and manufacturing supported margins despite soft global manufacturing output. Management reaffirmed full-year guidance and continued its aggressive share repurchase program.
View Linde plc’s Earnings Report Here >
Newmont Corporation (NEM) Benefits from Gold Price Strength
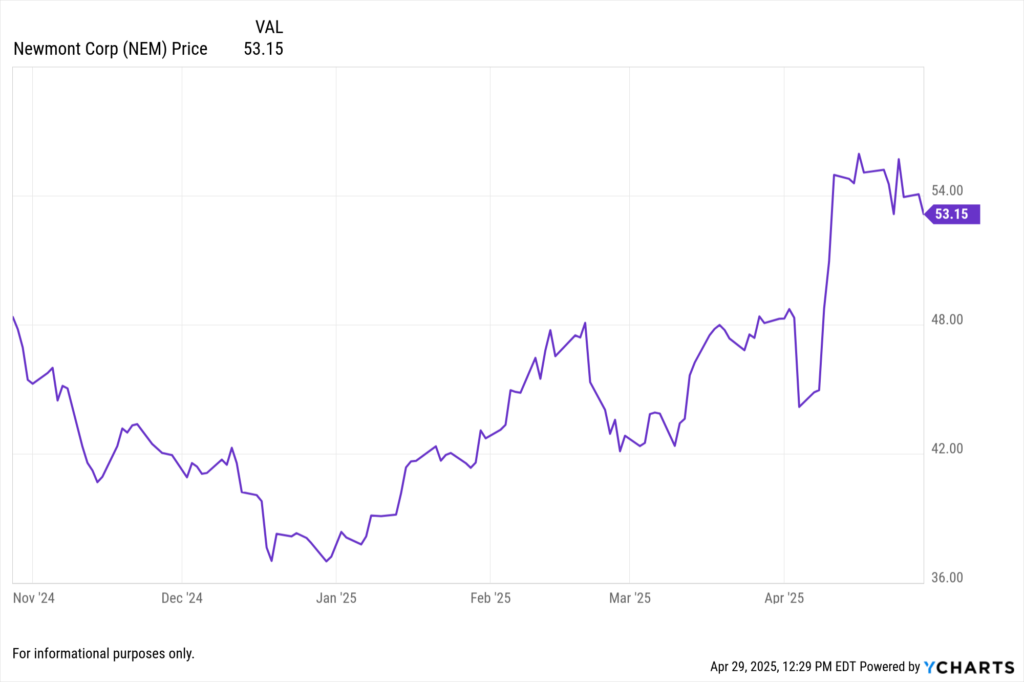
Newmont reported Q1 2025 revenue of $3.2 billion, up 8% year-over-year, with adjusted EPS of $0.55. Higher average realized gold prices and disciplined production helped offset inflationary mining costs. Management reaffirmed its production guidance for 2025 while announcing a $500 million share repurchase initiative.
View Newmont Corporation’s Earnings Report Here >
Dow Inc. (DOW) Navigates Challenging Pricing Environment
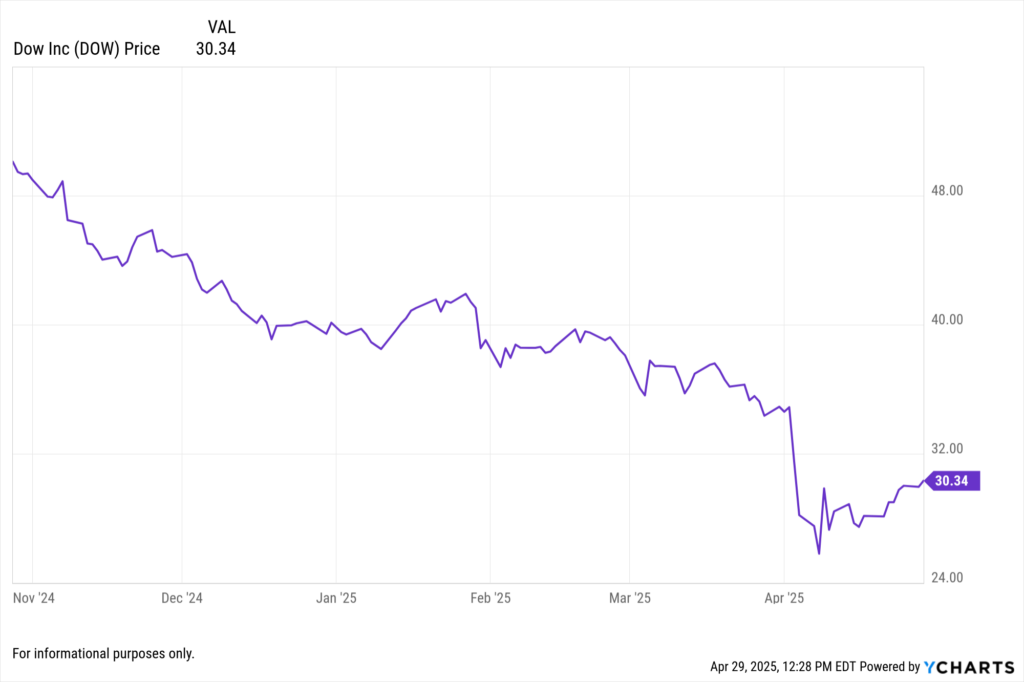
Dow posted Q1 2025 revenue of $10.8 billion, down 4% year-over-year. Adjusted EPS came in at $0.71, slightly missing expectations. Management cited persistent softness in consumer durable demand and lower polyethylene prices. Dow is pursuing operational efficiency initiatives to protect margins in the near term.
View Dow Inc.’s Earnings Report Here >
April 24, 2025 Earnings
Freeport-McMoRan Inc. (FCX) Capitalizes on Copper Price Strength
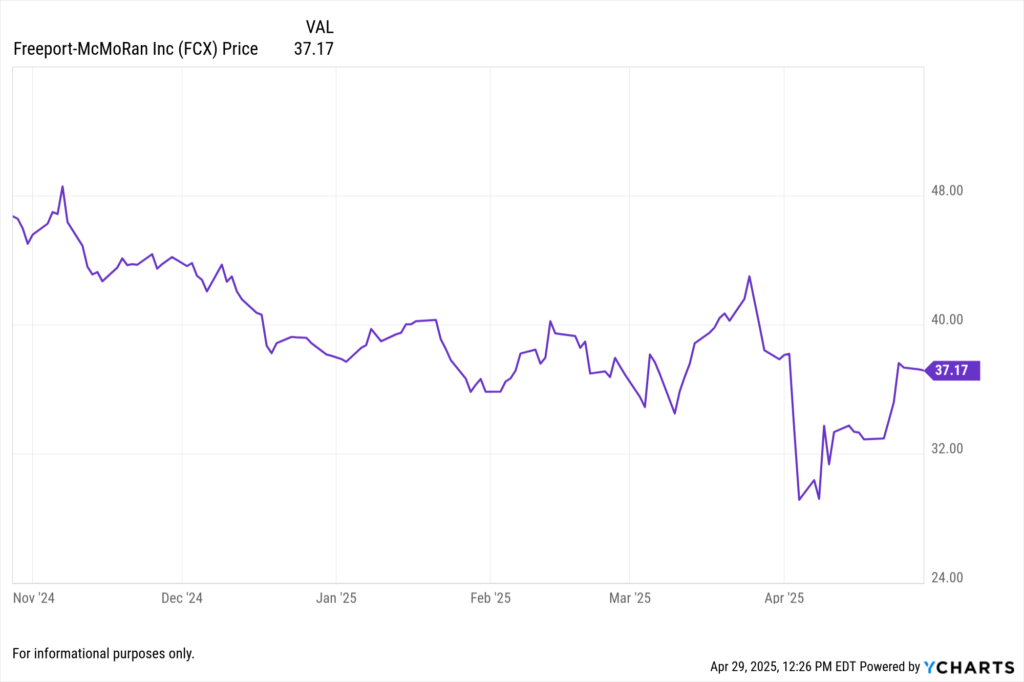
Freeport-McMoRan reported Q1 2025 revenue of $5.4 billion, up 6% year-over-year, and EPS of $0.62, beating consensus expectations. Higher copper production volumes and favorable pricing contributed to strong financial results. Management highlighted expansion projects in Indonesia and Arizona to meet future global copper demand.
View Freeport-McMoRan Inc.’s Earnings Report Here >
April 23, 2025 Earnings
Sherwin-Williams Co. (SHW) Sees Residential Recovery Boosting Q1 Sales
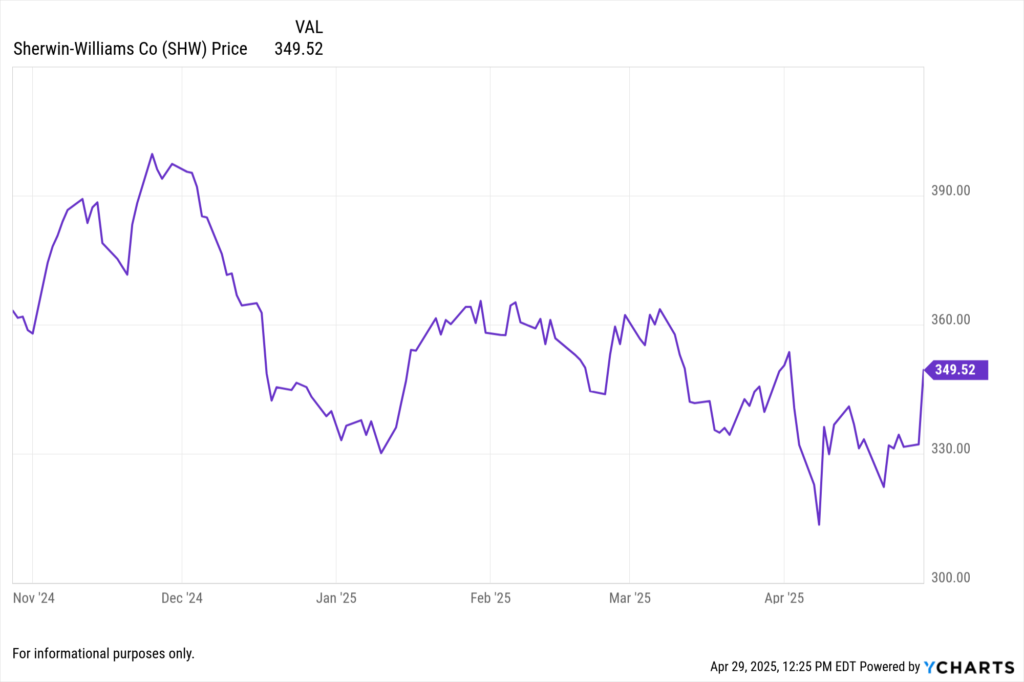
Sherwin-Williams reported Q1 2025 revenue of $5.55 billion, up 4.5% year-over-year, and EPS of $2.22, beating consensus estimates. Residential repaint demand showed early signs of recovery, helping offset continued weakness in new construction coatings. Management raised its full-year sales guidance slightly based on improving market conditions.
View Sherwin-Williams Co.’s Earnings Report Here >
How YCharts Can Help
Whether you’re tracking commodity-sensitive sectors, manufacturing inputs, or margin pressures across Materials stocks, YCharts offers critical tools to support investment and portfolio decisions.
Event Calendar: Monitor upcoming Materials sector earnings dates
Fundamental Charts: Analyze revenue, net income, margin trends, and commodity correlations
Stock Screeners: Identify outperformers in chemicals, mining, and construction materials
Custom Reports: Build professional-grade earnings recaps for Materials portfolios
Conclusion: Margin Management and Capex Discipline Key to Materials Sector Success
The Q1 2025 Materials Sector Earnings season reveals a sector prioritizing efficiency and selective growth amid a complex macro backdrop. Resilient gold and copper pricing supported miners like Newmont and Freeport-McMoRan, while chemical producers like Dow focus on cost optimization. The sector’s trajectory in 2025 will depend heavily on commodity market stability and industrial demand recovery.
Bookmark this page for continued updates on the Materials sector’s earnings performance.
Whenever you’re ready, here’s how YCharts can help you:
1. Looking to Move On From Your Investment Research and Analytics Platform?
2. Want to test out YCharts for free?
Start a no-risk 7-Day Free Trial.
Disclaimer
©2025 YCharts, Inc. All Rights Reserved. YCharts, Inc. (“YCharts”) is not registered with the U.S. Securities and Exchange Commission (or with the securities regulatory authority or body of any state or any other jurisdiction) as an investment adviser, broker-dealer or in any other capacity, and does not purport to provide investment advice or make investment recommendations. This report has been generated through application of the analytical tools and data provided through ycharts.com and is intended solely to assist you or your investment or other adviser(s) in conducting investment research. You should not construe this report as an offer to buy or sell, as a solicitation of an offer to buy or sell, or as a recommendation to buy, sell, hold or trade, any security or other financial instrument. For further information regarding your use of this report, please go to: ycharts.com/about/disclosure
Next Article
Q1 2025 Utilities Sector Earnings: Key Highlights & Market ReactionsRead More →