2022 Fund Flows: Investor Moves Confirm Recession Worries
The Federal Reserve closed out 2022 with two additional rate hikes as US Inflation hit its lowest point of the year. Additionally, both the S&P 500 and Bloomberg US Aggregate rallied in Q4 to avoid a bear of a year, and the VIX has stayed relatively calm since late October.
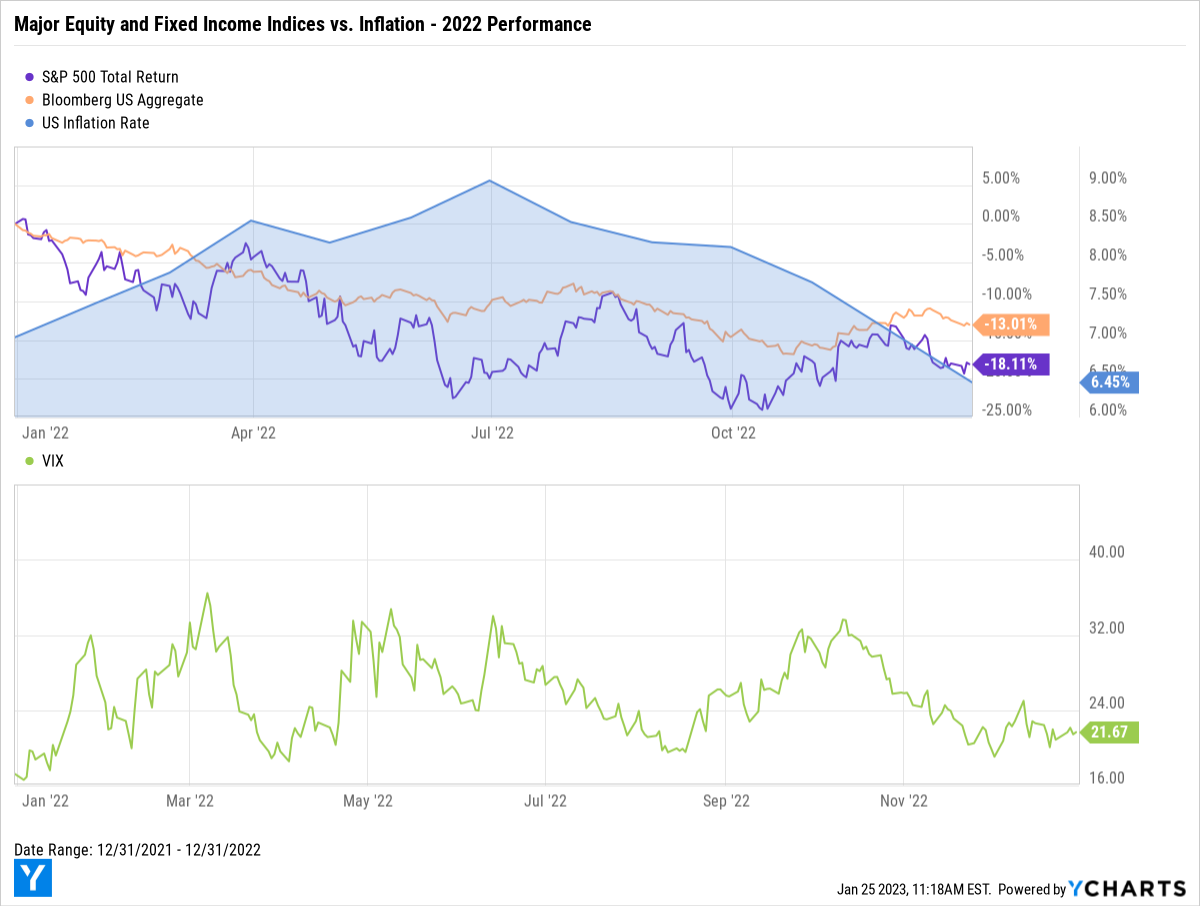
Download Visual | Modify in YCharts
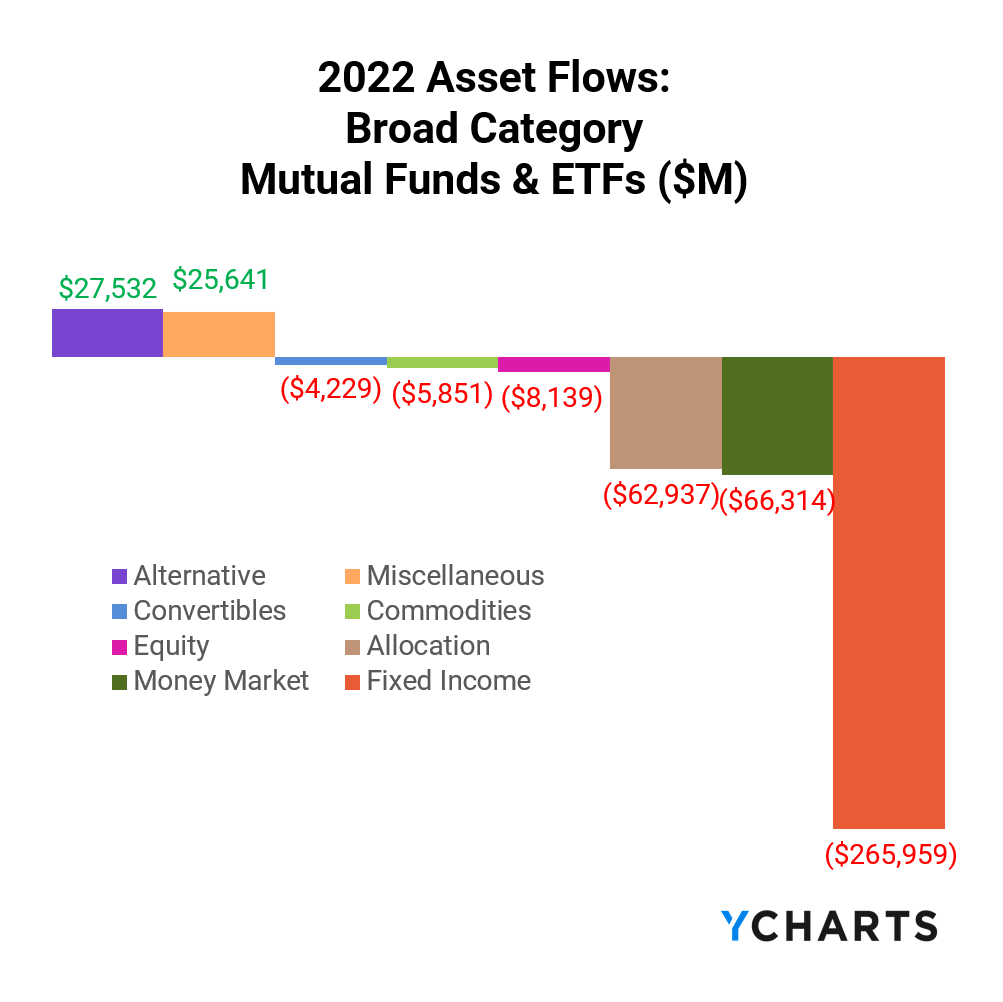
In response to rising interest rates and the AGG’s 13% decline, investors pulled more than $265B out of Fixed Income funds. Meanwhile, Alternative and Miscellaneous funds were the year’s broad category winners.
Fund flows are the net cash inflow into a fund (purchases) or net outflow from a fund (redemptions). Irrespective of fund performance, when a mutual fund or ETF has positive fund flows (or net issuances for ETFs) in a given period, that fund’s managers then have more cash to buy more holdings. The opposite is also true: as fundholders sell shares, fund managers sell out of positions and use the cash to pay redemptions.
This means that fund flow data can indicate higher or lower demand for different asset types, depending on which funds and categories have relatively large inflows or outflows.
Are you discussing fund flows with advisors and clients? Reach out to see how YCharts improves the quality and efficiency of your sales conversations.
Mutual Fund Flows: Biggest Winners and Losers
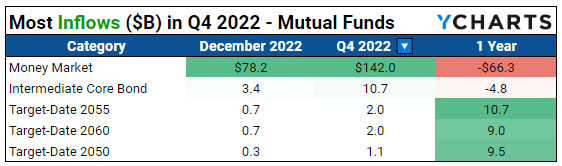
Despite ending the year with $66.3B in net outflows, Money Market mutual funds were actually the biggest mover across all fund types to close out 2022. In Q4, the category took in $142B of net new assets as investors went risk-off. Though the market largely turned its back on Fixed Income funds, Intermediate Core Bond mutual funds picked up $10.7B of net asset flows in an apparent flight to safety.
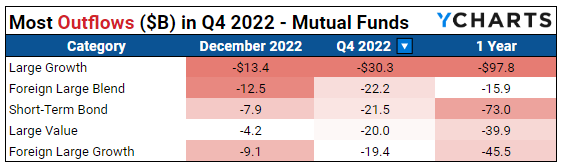
Flows to equity style mutual fund products were nearly all negative in the fourth quarter, with large-cap equity funds of all varieties suffering. Perhaps in anticipation of more Fed Rate hikes, investors pulled $21.5B from Short-Term Bond mutual funds during the quarter, seeking less rate-sensitive investments.
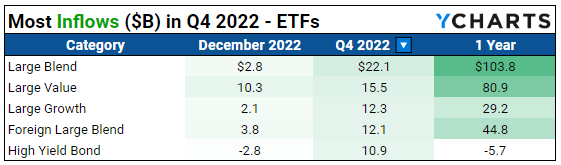
ETF Flows: Biggest Winners and Losers
Equity ETFs have remained the go-to investment vehicle in 2022, mirroring flows to similar mutual funds. Equity fund investors heavily favored Large Cap Blend and Value ETFs, adding $22.1B and $15.5B to each category, respectively. $12.1B was also added to Foreign Large Blend ETFs.
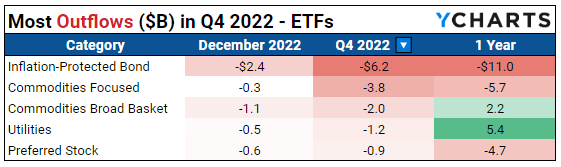
Investors moved a combined $10B out of Inflation-Protected Bond and Commodities Focused ETFs, which had been favorites amid rising inflation. With inflation ending the year slightly lower, have investors signaled expectations of a further cool-down?
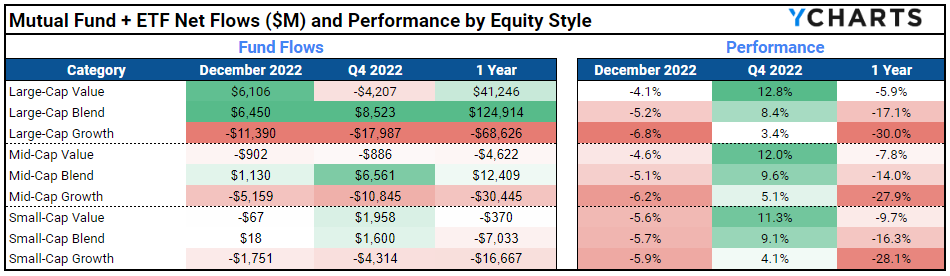
Equity Style Fund Flows and Performance
The table below shows a summation of combined mutual fund and ETF fund flows, plus average category performance, for the nine equity-style boxes.
With abysmal returns and elevated interest rates, investors steered clear of Growth equities in 2022. They opted for Large Cap Blend and Value funds instead, which ended the year with $124.9B and $41.2B in net positive flows.
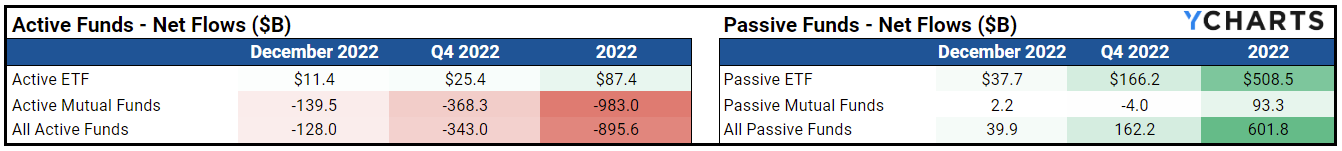
Passive Heavily Favored in 2022 as Investors Avoid Active
Actively managed funds took a significant hit to close out the year with net negative flows of $343B. Q4’s outflows were nearly double those of Q3. Instead, investors continued to allocate their assets into passive funds—flows saw an uptick of 52% quarter-over-quarter.
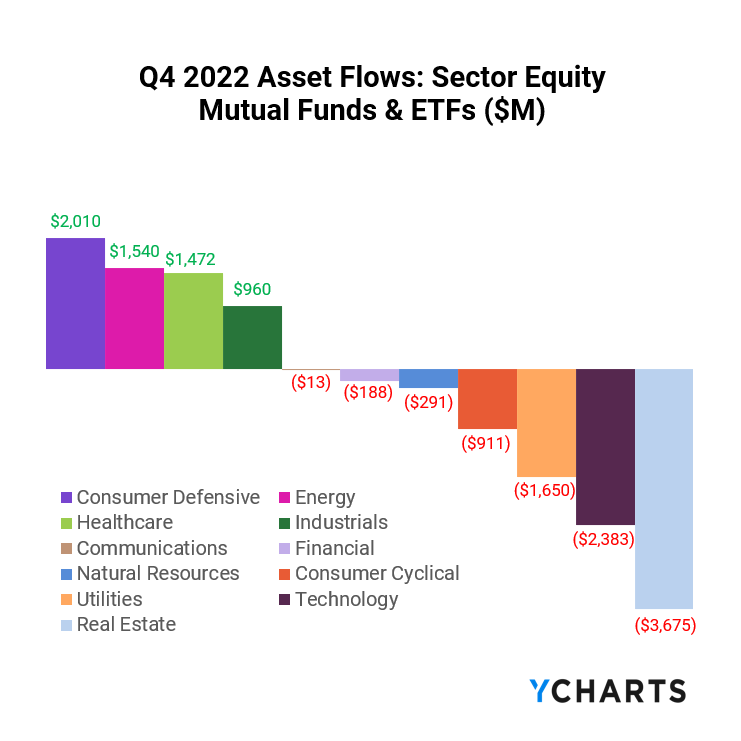
Are Investors Sounding the Recession Alarm?
Investor sentiment seems to be worsening as Consumer Defensive, Energy and Healthcare saw the biggest inflows in Q4. Combined with the significant inflows to Money Market funds and outflows from Fixed Income, more signs are pointing to an impending recession.
Only time will tell. If you missed our latest webinar covering the biggest fund flows trends of 2022, watch the full replay here:
Connect with YCharts
To learn more, schedule time to meet with an asset management specialist, call us at (773) 231-5986, or email hello@ycharts.com.
Want to add YCharts to your technology stack? Sign up for a 7-Day Free Trial to see YCharts for yourself.
Disclaimer
©2022 YCharts, Inc. All Rights Reserved. YCharts, Inc. (“YCharts”) is not registered with the U.S. Securities and Exchange Commission (or with the securities regulatory authority or body of any state or any other jurisdiction) as an investment adviser, broker-dealer, or in any other capacity, and does not purport to provide investment advice or make investment recommendations. This report has been generated through application of the analytical tools and data provided through ycharts.com and is intended solely to assist you or your investment or other adviser(s) in conducting investment research. You should not construe this report as an offer to buy or sell, as a solicitation of an offer to buy or sell, or as a recommendation to buy, sell, hold or trade, any security or other financial instrument. For further information regarding your use of this report, please go to: ycharts.com/about/disclosure
Next Article
Are Advisors Communicating Enough with Their Clients?Read More →