Recession Indicators 2025: The Institutional Framework for Predicting & Managing Economic Downturns
Table of Contents
The Evolution of Recession Prediction: Why Traditional Models Are Being Tested
The art and science of recession prediction has evolved dramatically since the Great Depression, yet the fundamental challenge remains: identifying turning points before they become obvious in hindsight. Traditional indicators that served investors well for decades are now sending conflicting signals in an economy transformed by unprecedented monetary policy, technological disruption, and structural shifts in labor markets.
Consider the yield curve, long regarded as the most reliable recession predictor. The 10-Year Treasury minus 2-Year Treasury spread inverted in July 2022 and remained negative for nearly two years—the longest inversion since 1978. Yet here we are in October 2025, with the curve having normalized to +0.55%, and no recession has materialized. The SPDR S&P 500 ETF (SPY) trades at 685.24, near all-time highs.
This disconnect between traditional indicators and market reality demands a more sophisticated approach. Financial advisors using YCharts’ comprehensive analytics tools must look beyond single indicators to understand the full economic picture. Our framework examines seven core recession indicators plus three critical adjustment factors that account for modern market dynamics.
| Recession Period | Leading Indicator | Warning Lead Time | S&P 500 Drawdown |
|---|---|---|---|
| 2001 Dot-Com | Yield Curve Inversion | 10 months | -49.1% |
| 2007-2009 Financial Crisis | Housing Starts + Yield Curve | 18 months | -56.8% |
| 2020 COVID-19 | None (Black Swan) | 0 months | -33.9% |
| 2025 (Potential) | Mixed Signals | TBD | TBD |
|
Powered by
|
|||
Deep Dive: The 7 Core Recession Indicators Every Advisor Must Monitor
Understanding recession risk requires monitoring multiple economic indicators simultaneously. Each provides a unique perspective on economic health, and their confluence, or divergence, tells the complete story. Let’s examine each indicator with current data and historical context.
1. The Yield Curve: From Inversion to Normalization
The yield curve, measuring the spread between long-term and short-term Treasury rates, has been Wall Street’s most trusted recession predictor since the 1970s. As of September 2025, the 10-Year Treasury yields 4.12% while the 2-Year yields 3.57%, creating a positive spread of 0.55%. This normalization follows the longest inversion since the late 1970s.
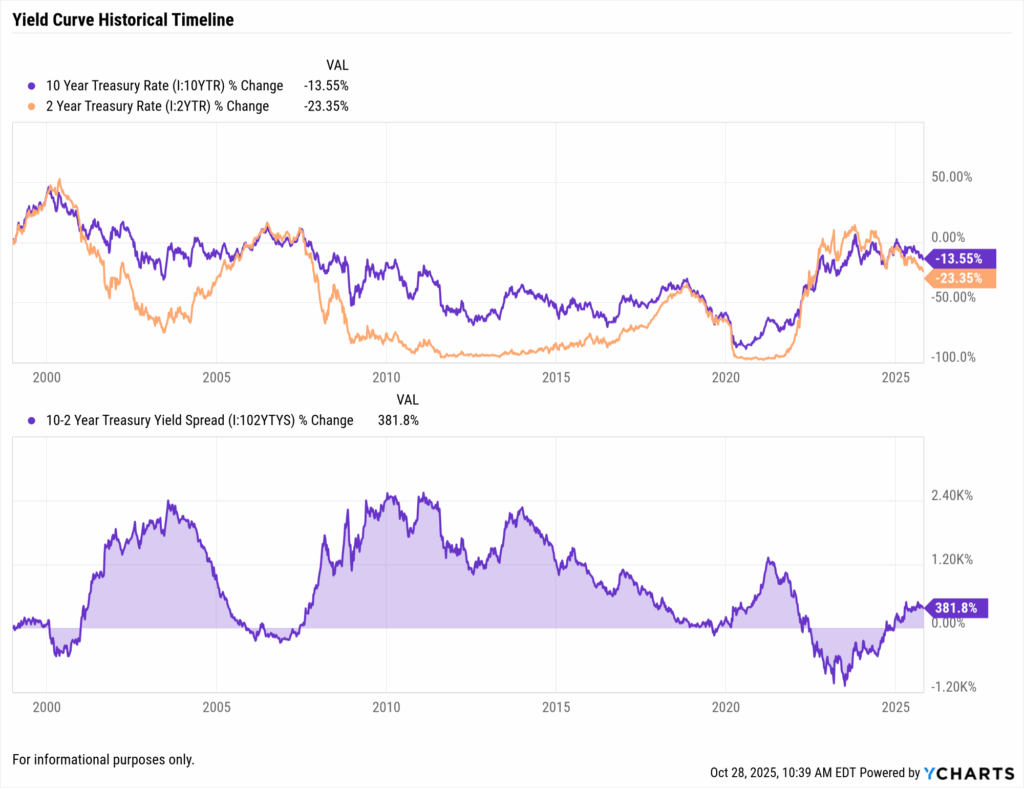
Historically, yield curve inversions have preceded every recession since 1955, with lead times ranging from 6 to 24 months. However, the relationship has become more complex in the era of quantitative easing and unconventional monetary policy. The recent normalization doesn’t necessarily signal “all clear”, often, recessions begin after the curve un-inverts as the Federal Reserve cuts rates in response to weakening economic conditions.
2. Unemployment Rate: The Sahm Rule Indicator
At 4.3% in August 2025, the unemployment rate remains historically low but has risen 0.6 percentage points from the cycle low of 3.7% in January 2024. This increase triggers attention to the Sahm Rule, which signals recession when the three-month average unemployment rate rises 0.5 percentage points above its 12-month low.
While we haven’t definitively crossed the Sahm threshold yet, the upward trend bears watching. Labor market dynamics have changed significantly post-pandemic, with structural shifts in workforce participation and the gig economy potentially altering traditional unemployment patterns. Advisors using YCharts’ economic data tools should monitor both headline unemployment and underlying metrics like labor force participation and job openings.
View YCharts Real-Time Sahm Rule Recession Indicator Page
3. GDP Growth: Decelerating But Positive
Real GDP grew 2.83% year-over-year in Q2 2025, down from the robust 5%+ growth rates seen in 2024’s recovery phase. While any positive GDP growth technically avoids recession (defined as two consecutive quarters of negative growth), the deceleration trend matters more than the absolute number.
The composition of GDP growth provides crucial context. Consumer spending, comprising roughly 70% of GDP, remains resilient despite higher interest rates. However, business investment has softened, and residential investment continues to struggle under the weight of elevated mortgage rates. This divergence suggests an economy in transition rather than outright contraction.
| Indicator | Current Value | Recession Threshold | Status |
|---|---|---|---|
| Yield Curve (10Y-2Y) | +0.55% | < 0% | ✓ Normal |
| Unemployment Rate | 4.3% | > 0.5% from low | ⚠ Watch |
| GDP Growth (YoY) | +2.83% | < 0% | ✓ Positive |
| Leading Indicators | -0.3% | 3mo decline | ⚠ Declining |
| ISM Manufacturing | 48.2 | < 50 | ✗ Contracting |
| Credit Spreads | 125 bps | > 150 bps | ✓ Stable |
| Consumer Confidence | 98.7 | < 90 | ✓ Healthy |
|
Powered by
|
|||
4. Leading Economic Indicators: Mixed Signals
The Conference Board’s Leading Economic Index (LEI) has declined for 15 of the past 18 months, typically a clear recession warning. However, the pace of decline has moderated recently, and some components like stock prices and consumer expectations have improved. This divergence within the index itself reflects the unusual nature of the current economic environment.
5. Manufacturing Activity: Contraction Territory
The ISM Manufacturing Index reading of 48.2 signals contraction (readings below 50 indicate declining activity). Manufacturing has struggled with high interest rates, inventory adjustments, and global trade uncertainties. However, the services sector, which represents a much larger share of the modern economy, remains in expansion territory at 53.4.
6. Credit Market Conditions: Stable But Tightening
Credit spreads at 125 basis points remain well below the 150+ basis point levels that typically signal serious stress. Bank lending standards have tightened but haven’t reached the restrictive levels seen before previous recessions. The regional banking crisis of early 2023 appears contained, though smaller banks remain cautious about lending.
7. Consumer Health: Resilient But Stretched
Consumer confidence at 98.7 remains relatively healthy, supported by low unemployment and wage growth. However, credit card delinquencies are rising from historically low levels, and the personal savings rate has declined. The bifurcation between higher-income consumers who benefit from asset appreciation and lower-income consumers struggling with inflation creates a complex picture.
Modern Adjustment Factors: Why This Time Might Actually Be Different
While “this time is different” are dangerous words in finance, three structural factors genuinely alter how we should interpret traditional recession indicators in 2025:
1. AI and Productivity Revolution
Artificial intelligence deployment is accelerating productivity growth in ways not fully captured by traditional economic statistics. Companies are achieving more output with fewer resources, potentially extending the economic cycle. The Microsoft (MSFT) and Alphabet (GOOGL) AI arms race exemplifies how technology investment continues despite economic uncertainty.
2. Fiscal Support and Government Intervention
Post-pandemic fiscal policy remains more active than in previous cycles. Infrastructure spending, green energy incentives, and industrial policy provide economic support that didn’t exist in past downturns. The federal deficit at 6% of GDP during an expansion would have been unthinkable in previous decades.
3. Changed Consumer and Corporate Behavior
Both consumers and corporations locked in low rates during 2020-2021, providing insulation from rate increases. Corporate balance sheets remain relatively healthy, with many companies having termed out debt at favorable rates. This reduces the immediate impact of Federal Reserve tightening.
Portfolio Positioning Framework: From Analysis to Action
Understanding recession indicators is only valuable if it translates into actionable portfolio decisions. Our framework provides specific allocation strategies based on recession probability levels, helping advisors systematically adjust client portfolios as conditions evolve.
| Strategy Name | Allocation | Best For |
|---|---|---|
| Conservative Defense | 40% Stocks / 50% Bonds / 10% Cash | Risk-averse investors nearing retirement |
| Balanced Resilience | 50% Stocks / 40% Bonds / 10% Alternatives | Long-term investors seeking stability |
| Opportunistic Growth | 65% Stocks / 25% Bonds / 10% Cash | Growth-focused with dry powder for opportunities |
| Tactical Flexibility | Variable Allocation | Active management with dynamic positioning |
|
Powered by
|
||
Quarterly Update Protocol: Staying Ahead of Economic Shifts
Effective recession risk management requires systematic monitoring and regular portfolio reviews. Establishing a quarterly update protocol ensures you’re neither overreacting to short-term noise nor missing important trend changes. Here’s a comprehensive framework for maintaining vigilance without succumbing to analysis paralysis.
Each quarter, advisors should review the seven core indicators, noting both absolute levels and rate of change. Document these observations in client files, creating an audit trail of decision-making that demonstrates fiduciary prudence. Use YCharts’ screening and analytics tools to identify portfolio holdings most vulnerable to recession and those likely to provide stability.
Quarterly Recession Risk Review Checklist
- Update yield curve spread and trend analysis
- Review unemployment rate and Sahm Rule calculation
- Analyze GDP growth trajectory and composition
- Assess inflation trends and Fed policy implications
- Evaluate credit spreads and lending standards
- Stress test holdings under recession scenarios
- Review sector allocations vs. benchmarks
- Assess quality metrics (balance sheets, cash flows)
- Evaluate defensive positioning adequacy
- Check correlation patterns and diversification
- Update risk assessments for vulnerable clients
- Schedule reviews with high-net-worth accounts
- Prepare market outlook communications
- Document all allocation changes and rationale
- Address client concerns proactively
The Path Forward: Navigating Uncertainty with Confidence
As we navigate the final quarter of 2025, the economic landscape presents both challenges and opportunities. The normalization of the yield curve, coupled with resilient but slowing growth, suggests we’re in the later stages of the economic cycle. However, this doesn’t necessitate immediate defensive positioning—markets can remain elevated for extended periods even as recession risks build.
The key to successful navigation lies not in perfect prediction but in preparation and adaptability. By monitoring multiple indicators, maintaining portfolio flexibility, and communicating transparently with clients, advisors can add significant value regardless of economic outcomes. Remember that recessions, while painful, also create opportunities for long-term wealth creation through strategic rebalancing and selective investment.
Technology continues to transform both the economy and investment landscape. Artificial intelligence, clean energy transition, and demographic shifts create new growth vectors even as traditional sectors face headwinds. Advisors who help clients maintain perspective, avoid emotional decisions, and position for long-term success will emerge stronger regardless of near-term economic fluctuations.
Key Takeaways for Financial Advisors
- Mixed Signals Require Nuanced Analysis: With the yield curve normalized but unemployment rising, traditional recession indicators are sending conflicting messages. Focus on the confluence of multiple indicators rather than any single metric.
- Moderate Risk Positioning Appropriate: Current conditions suggest maintaining balanced portfolios with modest defensive tilts. Avoid extreme positioning in either direction while building flexibility for rapid adjustment.
- Quality Over Yield: In late-cycle environments, prioritize balance sheet strength and sustainable cash flows over reaching for yield. The spread between quality and speculation typically widens during economic stress.
- Communication Is Crucial: Proactive client communication about recession risks and portfolio positioning builds trust and prevents emotional decision-making during volatile periods. Document your process and rationale thoroughly.
- Opportunities Await: Recessions create chances to upgrade portfolios and deploy capital at attractive valuations. Maintain adequate liquidity and emotional discipline to capitalize when others are fearful.
- Technology Changes Everything: AI and technological advancement may alter traditional economic relationships. Stay flexible in your framework and avoid rigid adherence to historical patterns.
- Use Professional Tools: Leverage YCharts’ comprehensive analytics platform to monitor indicators, screen for opportunities, and demonstrate value through sophisticated analysis and reporting.
Conclusion: From Analysis to Action
The recession indicators framework presented here provides a comprehensive approach to economic analysis and portfolio management in uncertain times. While no system can perfectly predict economic turning points, systematic monitoring of multiple indicators significantly improves decision-making quality and client outcomes.
As of October 2025, the U.S. economy stands at an inflection point. Growth continues but at a moderating pace. Employment remains healthy but shows early signs of softening. Financial conditions have tightened but remain accommodative by historical standards. This environment demands neither complacency nor panic, but rather thoughtful preparation and disciplined execution.
The most successful advisors will be those who combine quantitative analysis with qualitative judgment, maintaining conviction while remaining flexible. They’ll use tools like YCharts to enhance their analytical capabilities while never losing sight of their fundamental role: helping clients achieve their financial goals regardless of economic conditions.
Remember that every recession ends, and every recovery begins when pessimism peaks. By maintaining perspective, following a disciplined process, and focusing on long-term wealth creation rather than short-term market movements, advisors can guide clients successfully through any economic environment. The framework and indicators discussed here provide the roadmap; your expertise and judgment provide the navigation.
The coming quarters will test both the economy and investor resolve. Armed with comprehensive recession indicators, clear portfolio strategies, and robust communication frameworks, financial advisors can transform uncertainty into opportunity. The key lies not in predicting the exact timing of economic turns but in preparing portfolios and clients for multiple scenarios while maintaining the flexibility to adapt as conditions evolve.
Ready to Move On From Your Investment Research and Analytics Platform?
Follow YCharts Social Media to Unlock More Content!
Next Article
Bridging the Generational Gap Between Advisors and InvestorsRead More →