Reduce Client Anxiety with YCharts Custom Stress Tests
Despite the S&P 500 being up 13.96% YTD, advisors have been navigating tumultuous times in recent years: a global pandemic, a 25% drawdown in 2022, and geopolitical tensions worldwide. These instances likely led to client apprehension about their current holdings or staying in the market altogether.
Advisors, if your clients are second-guessing their market involvement or questioning portfolio diversity, YCharts’ latest enhancement to the Stress Test tool can help you alleviate client concerns.
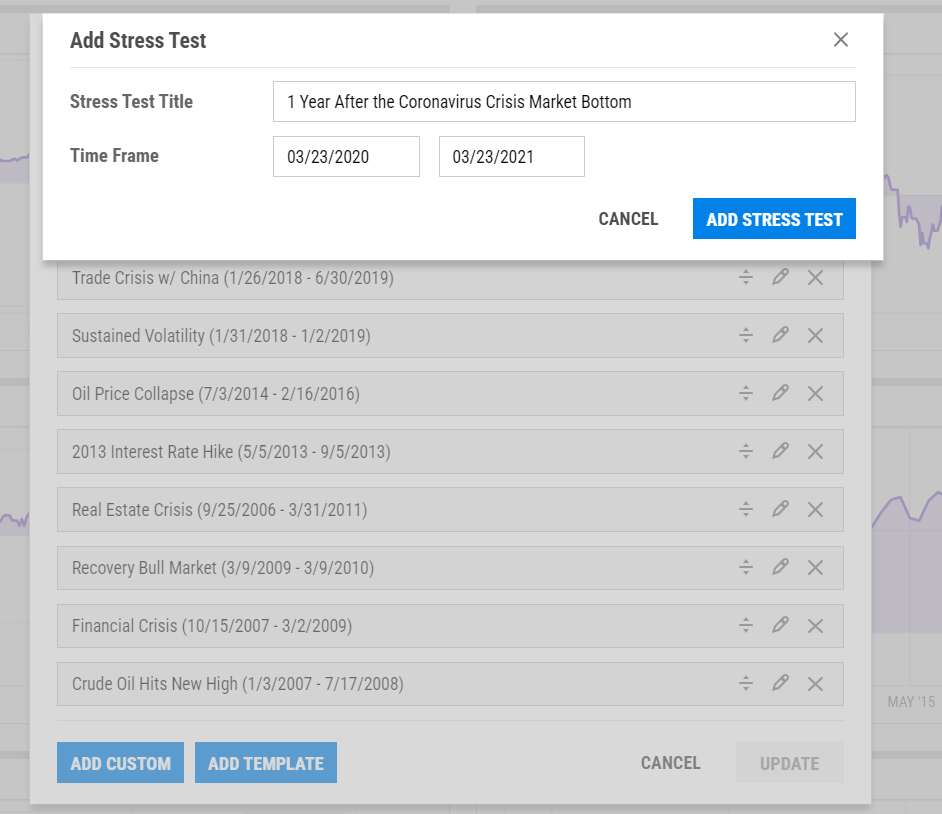
You can now customize the time frame to help illustrate the resilience of your strategy before, during, and following volatile market moments. After customizing and naming your new Stress Test, it will appear in the Stress Test tab along with other pre-built templates. Stress Tests will appear in all securities where data is available.
Start a Free Trial to Customize Your Own Stress Tests
Enhancing Stress Test Insights with Custom Time Frames
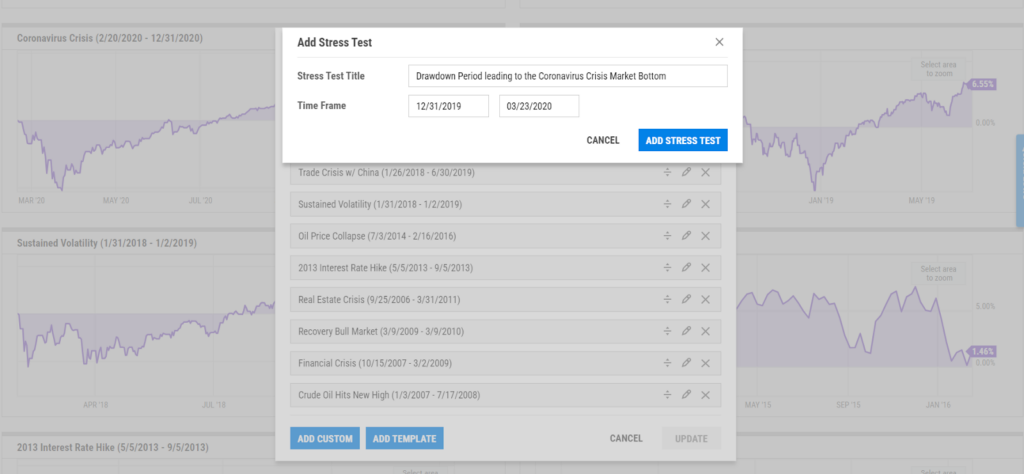
One of the most intuitive ways to use the custom Stress Test feature is to use a pre-built Stress Test and expand the time frame in either direction. For example, if we look at the Stress Test for the Coronavirus Crisis, the pre-built dates are from 2/20/2020-12/31/2020.
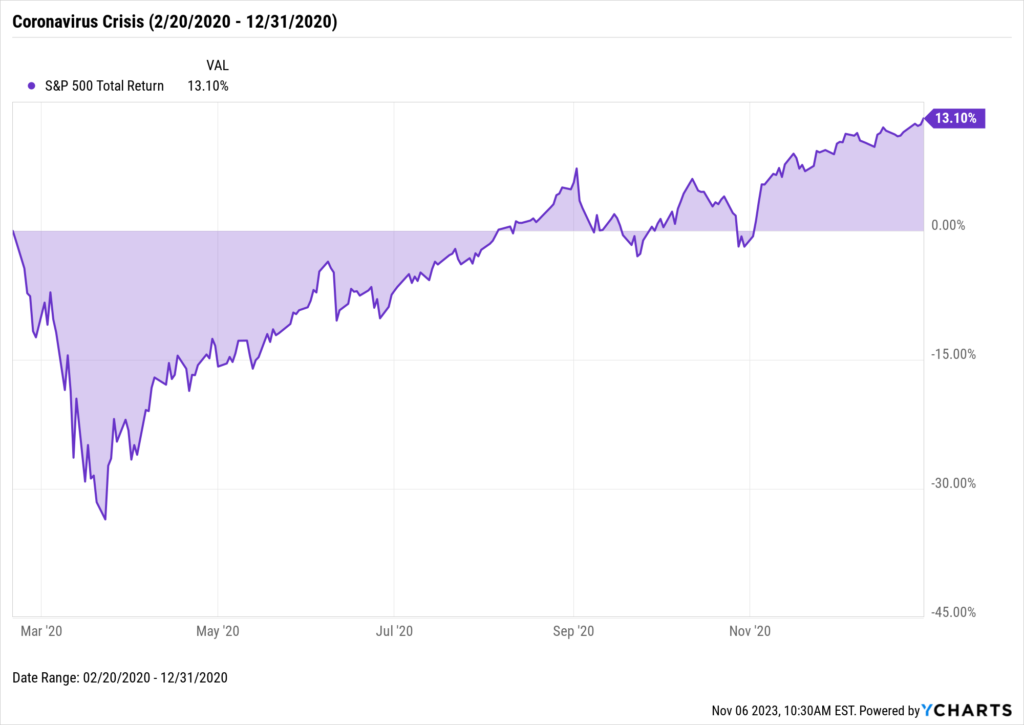
Download Visual | Modify in YCharts
By customizing the time frame to start on 3/23/2020 (when the market bottomed), you could show the value of staying prudent as an investor, even when the world grapples with unprecedented events.
Start a Free Trial to Customize Your Own Stress Tests
You can illustrate the growth of a $10,000 investment over 90 days, 200 days, or 365 days post-bottom to help clients visualize the impact.
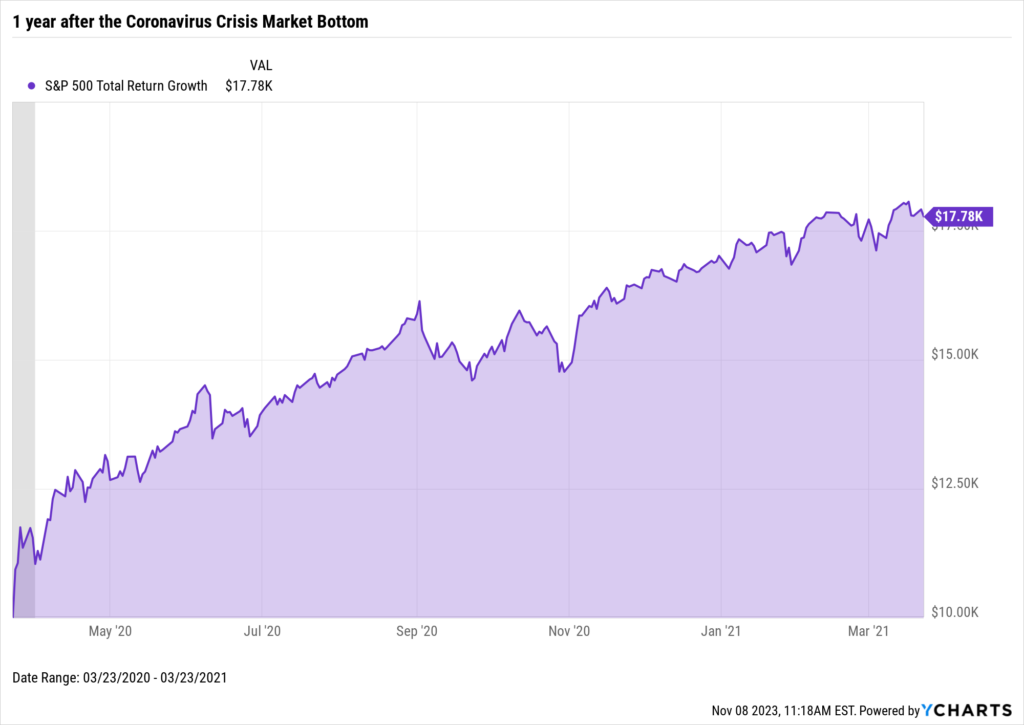
Download Visual | Modify in YCharts
Demonstrate the Resilience of a Diversified Portfolio in Turbulent Times
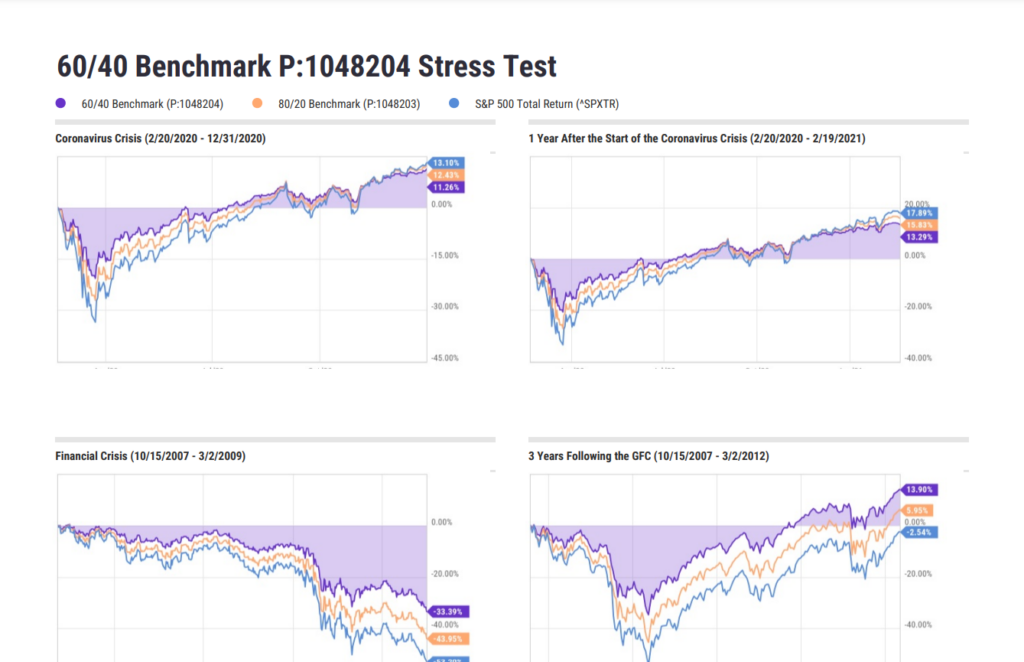
Convincing a client of the merits of a 60/40 portfolio can be challenging, and especially to stay invested when they’re skeptical about its recent performance. However, you could highlight how a 60/40 portfolio did a better job mitigating losses leading up to and during the 2020 Coronavirus Crisis.
By setting up this time frame as a custom Stress Test, you’ll have access to the visual below across all securities and saved Model Portfolios within YCharts. You could quickly research and compare portfolios. Moreover, you can demonstrate the resilience of diversified portfolios during market turmoil to prospects or clients. For instance, in the period leading up to and during the 2020 Coronavirus Crisis, history reveals that a 60/40 portfolio limited losses to 17.8%, whereas the S&P 500 experienced a more substantial decline of 30.4%.
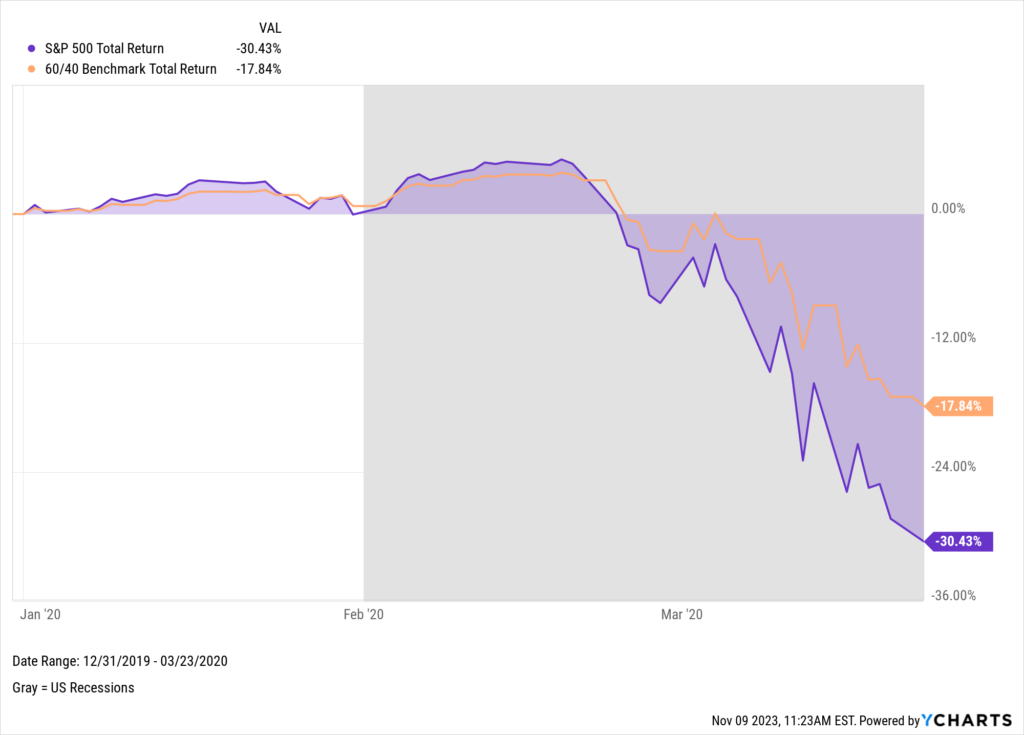
Download Visual | Modify in YCharts
Even though the 60/40 has underperformed over the past two years, you can use Stress Tests to show that such setbacks are exceptions, not the rule. Consider the aftermath of the global financial crisis (GFC) – history shows that having even some portfolio diversity is crucial when cushioning downturns. For example, having just 20% of a portfolio exposed to fixed income reduced volatility and provided a positive return three years following the end of the GFC.
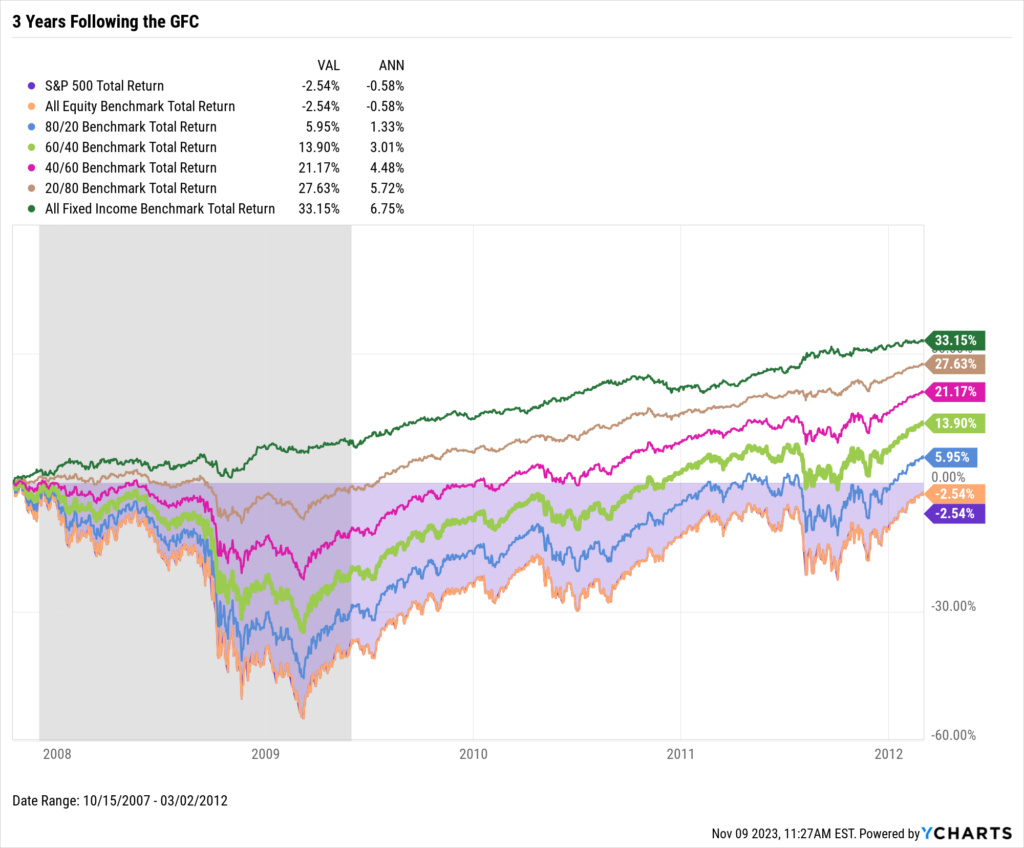
Download Visual | Modify in YCharts
Even in some of the more recent challenging years, the traditional 60/40 portfolio proved its defensive capabilities by softening the blow of the 2020 market downturn. This aspect of risk mitigation is particularly crucial for retiree clients who prioritize capital preservation. They stand to benefit from a strategy that aims to protect their nest egg over seeking to capture the entire upside of a market rebound.
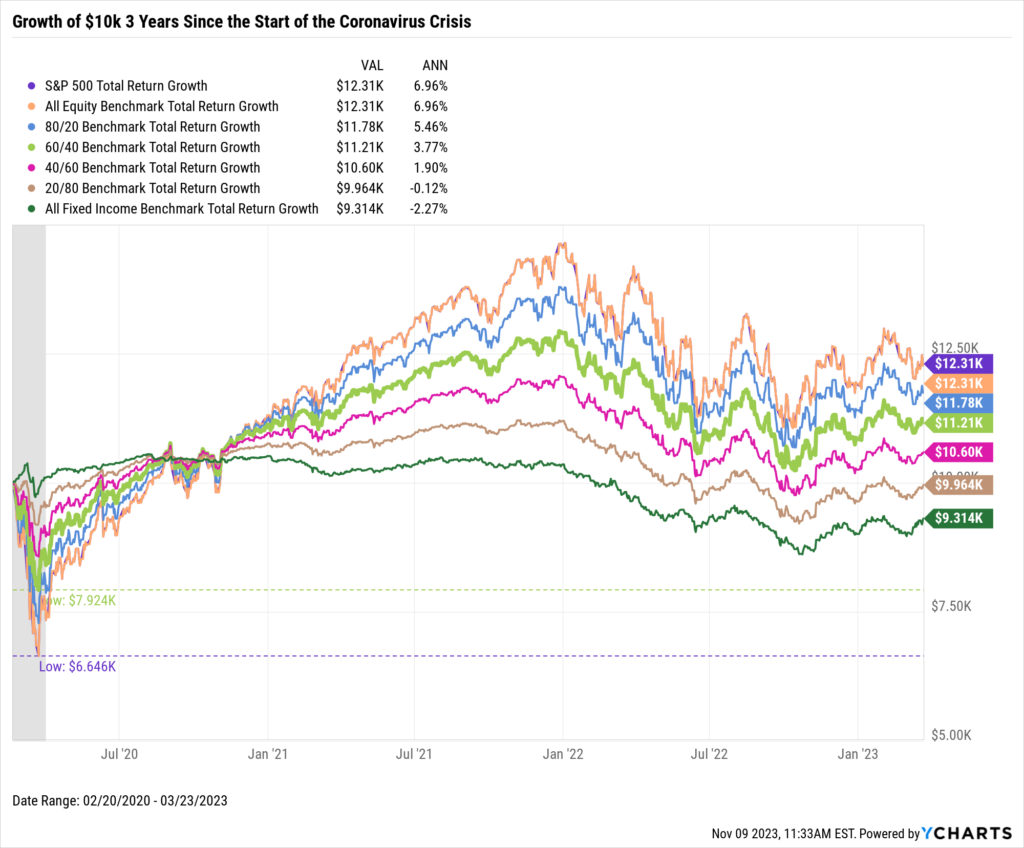
Download Visual | Modify in YCharts
Presenting Stress Test Findings to Clients
With the latest enhancement to Stress Tests, you can export a PDF with Stress Tests of your choice to present to a client.
Start a Free Trial to Customize Your Own Stress Tests
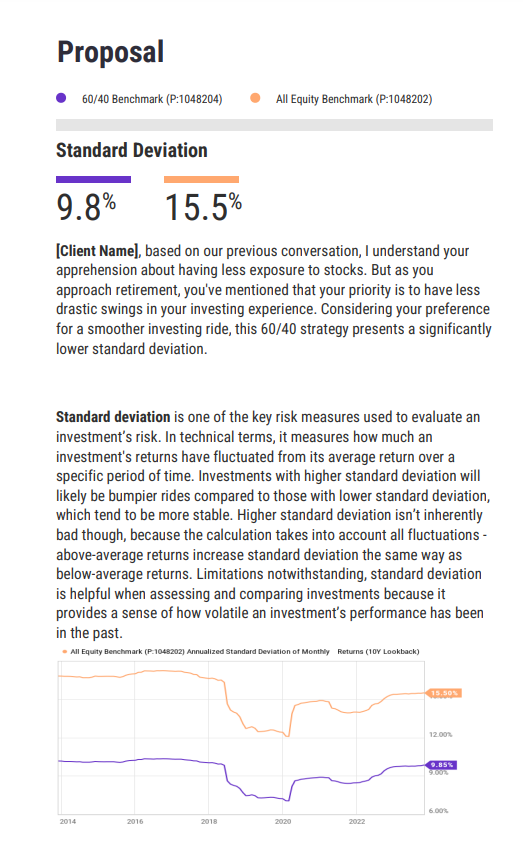
Suppose you want to present a full report to a client. In that case, you can use Talking Points to illustrate the difference in drawdowns between two portfolios in the Proposal module, as well as import Stress Test modules – with the Stress Tests of your choice into Report Builder so that your client gets the whole picture of their strategy’s potential and why it’s the right fit for their current situation.
Start a Free Trial to Craft Your Own Talking Points
YCharts’ enhanced Stress Test tool offers a solution for advisors seeking to build trust and communicate their strategy’s effectiveness to their clients. By leveraging custom time frames and intriguing visuals, advisors can present a compelling narrative on the merits of prudent risk management that aligns with their clients’ investment goals and comfort levels.
Whenever you’re ready, there are 3 ways YCharts can help you:
- Have questions about how YCharts can assist in positioning your portfolios?
Send us an email at hello@ycharts.com or call (866) 965-7552. You’ll be directly in touch with one of our Chicago-based team members.
- Want to test out YCharts’ Custom Stress Tests for free?
Start a no-risk 7-Day Free Trial
- Want More Insights from YCharts? Subscribe to the Blog.
Disclaimer
©2023 YCharts, Inc. All Rights Reserved. YCharts, Inc. (“YCharts”) is not registered with the U.S. Securities and Exchange Commission (or with the securities regulatory authority or body of any state or any other jurisdiction) as an investment adviser, broker-dealer or in any other capacity, and does not purport to provide investment advice or make investment recommendations. This report has been generated through application of the analytical tools and data provided through ycharts.com and is intended solely to assist you or your investment or other adviser(s) in conducting investment research. You should not construe this report as an offer to buy or sell, as a solicitation of an offer to buy or sell, or as a recommendation to buy, sell, hold or trade, any security or other financial instrument. For further information regarding your use of this report, please go to: ycharts.com/about/disclosure
Next Article
How to Build Tax-Efficient Investment Strategies for 2024Read More →