RIAs are Embracing these Active Bond ETFs in 2025
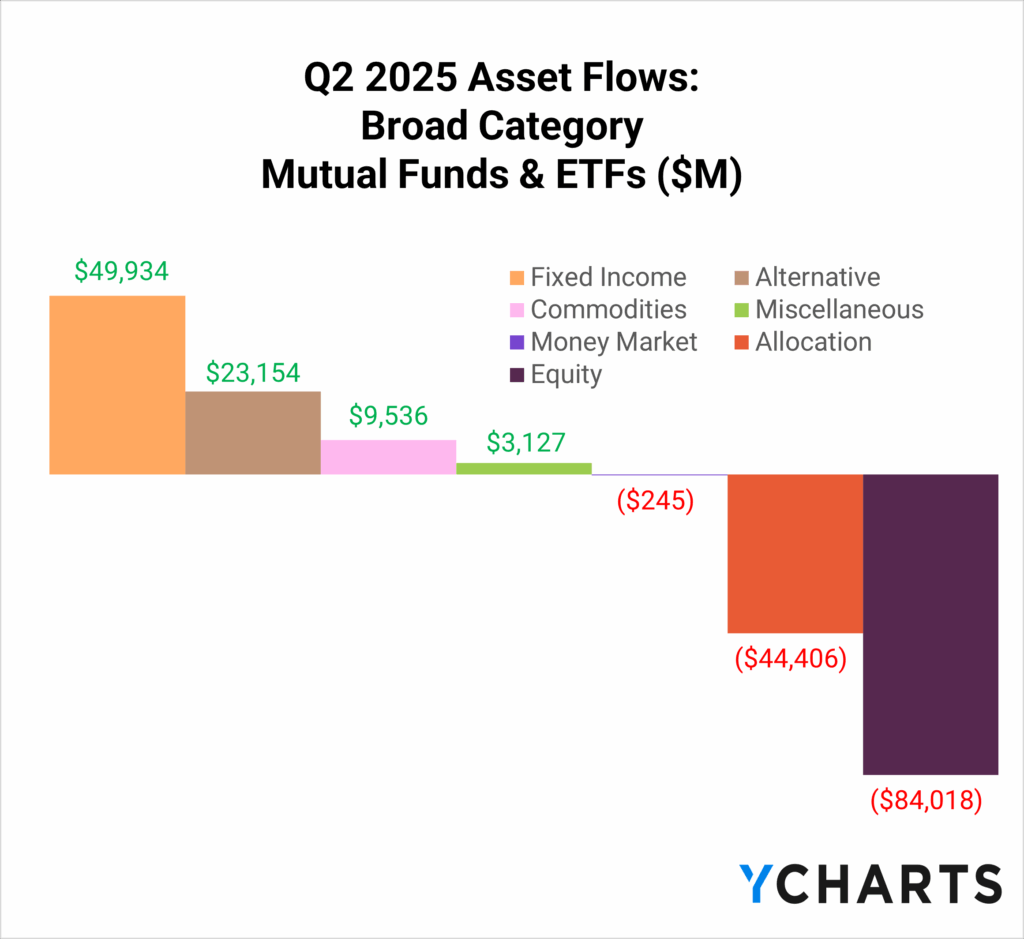
In Q2 2025, fixed-income strategies led all asset classes, pulling in $49.9 billion in net new assets. In contrast, equity strategies saw $84 billion in outflows, and money market funds ended the quarter slightly negative, shedding $245 million.
Subscribe to the Fund Flow Report
As we’ve tracked throughout the year, one of the biggest drivers behind this shift is the growing ETF-tization of the fixed-income sleeve, or as Northern Trust’s David Abner put it, the evolution of ETFs into the “meat and potatoes” of advisor portfolios. In Q2 alone, $62.6 billion flowed into bond ETFs, offsetting the $12.7 billion in outflows from bond mutual funds.
Moreover, over the past 12 months, despite making up 18.6% of fixed-income ETF AUM (as of June 30, 2025), active strategies captured 40% of the $292 billion in total flows.

Subscribe to the Fund Flow Report
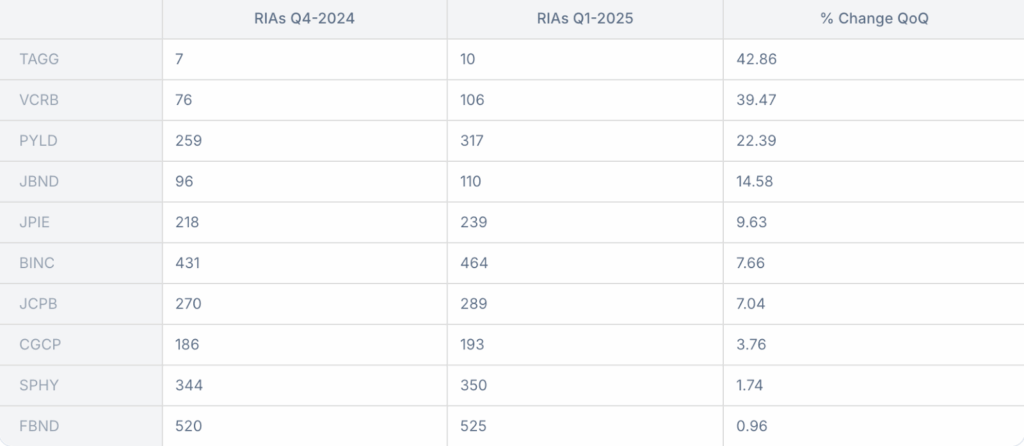
To better understand which funds are winning with advisors, we partnered with AdvizorPro to analyze RIA adoption of the top active fixed-income ETFs by year-to-date flows (AdvizorPro data as of March 31, 2025).
We focused specifically on Core, Core-Plus, and Multi-Sector bond strategies, where active managers have the broadest discretion to adjust duration, credit, and sector exposure.
Why Active?
Before diving into the biggest winners, it’s worth revisiting why active continues to resonate, particularly in the “40” part of a portfolio.
In addition to a decades-high yield environment, one that has created attractive income opportunities while setting the stage for anticipated global rate cuts, advisors face a more complex landscape for managing duration. In this environment, the flexibility and discretion of active management have become increasingly valuable.
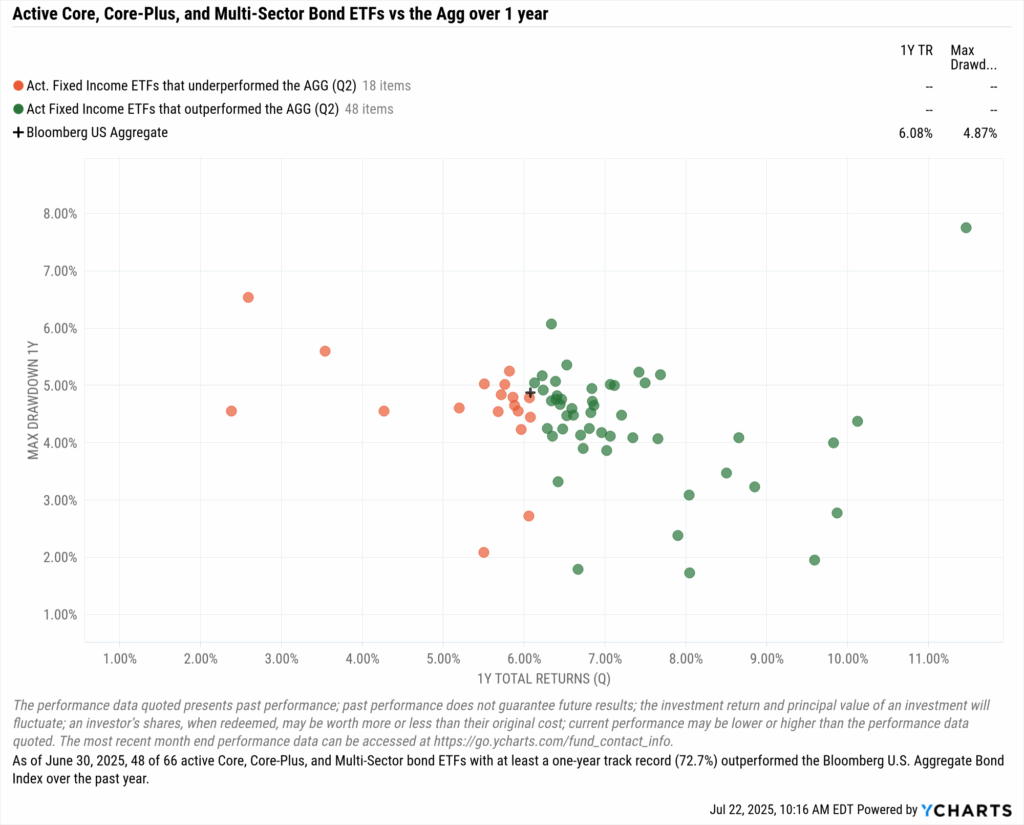
Over the past year, the efficacy of active management in the fixed-income sleeve has been compelling: of the 66 active Core, Core-Plus, and Multi-Sector bond ETFs with a one-year track record, 48 (72.7%) outperformed AGG as of June 30, 2025.
Active Bond ETF Leaders by the Numbers
Again, when looking at active Core, Core-Plus, and Multi-Sector bond ETFs, here’s how things stand:
- Total YTD Flows: $23.5B
- Most YTD Flows: PIMCO Multisector Bond Active ETF (PYLD) – $2.9B
- Median Flows Relative to AUM: 19.68%
- Total AUM: $107.2B
- Largest (by AUM): Fidelity Total Bond ETF (FBND) – $19.5B
- Median Size (by AUM): $155M
- Median YTD Flows: $21.8M
- Median Years Since Inception: 2
- Median Net Expense Ratio: 0.39%
- Lowest Net Expense Ratio: T Rowe Price QM US Bond ETF (TAGG) – 0.08%
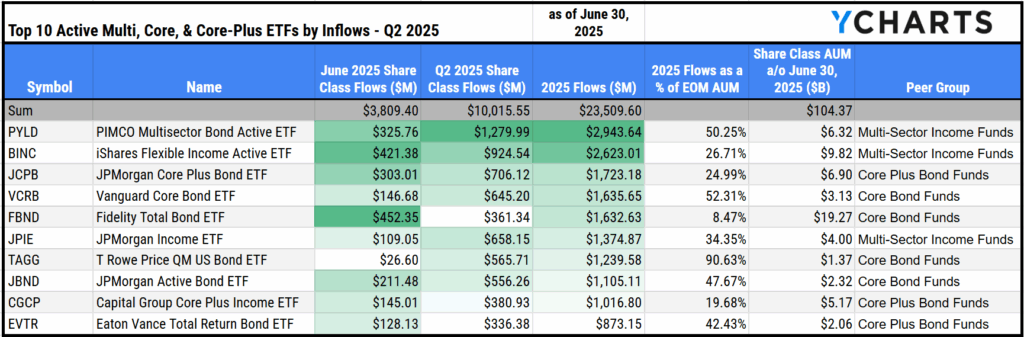
With that backdrop in mind, let’s take a closer look at three big winners from the first half of 2025. Rounding out the full list of the top 10 active Core, Core-Plus, and Multi-Sector bond ETFs by asset growth at midyear are: PYLD, BINC, JCPB, VCRB, FBND, JPIE, TAGG, JBND, CGCP, and EVTR.
PIMCO Multisector Bond Active ETF (PYLD)
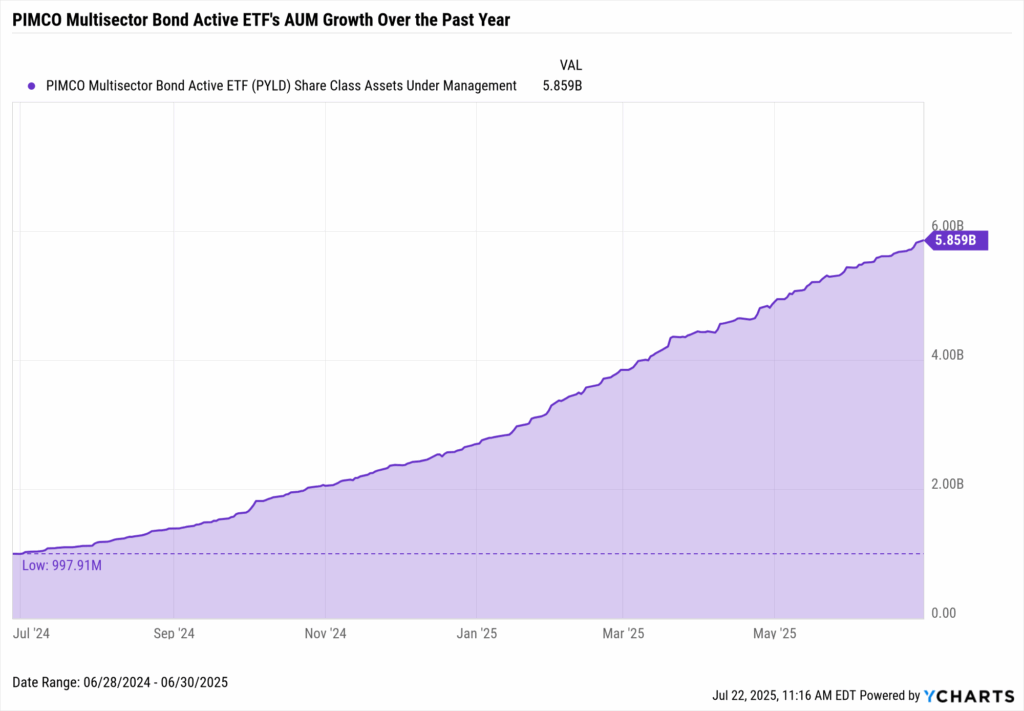
Few firms are as revered in the fixed-income space as PIMCO. With the PIMCO Multisector Bond Active ETF (PYLD), the firm aimed to bring their decades of bond market leadership into a tax-efficient ETF wrapper designed for modern portfolios.
According to AdvizorPro, from the end of 2024 through Q1 2025, 58 RIAs added PYLD to client portfolios, marking a 22.4% quarter-over-quarter increase and bringing the total number of reporting advisors to 317.
That momentum has translated into significant flows: $2.9 billion in net new assets year-to-date, accounting for over half of the fund’s total AUM as of June 30, 2025. Quite the pace for a two-year-old strategy.
Download Visual | Modify in YCharts
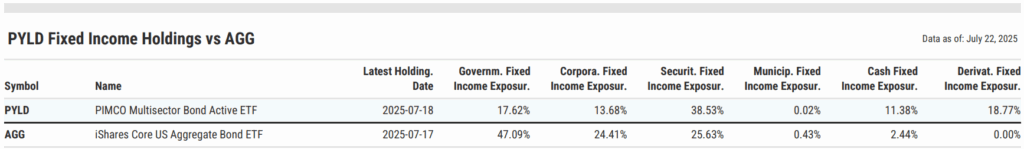
PYLD takes a notably different approach than its benchmark (represented by AGG). It holds just 17.6% in government bonds and has a heavier tilt toward securitized fixed income (38.5%). The strategy also holds 11.4% in cash, giving managers flexibility to respond to shifting markets.
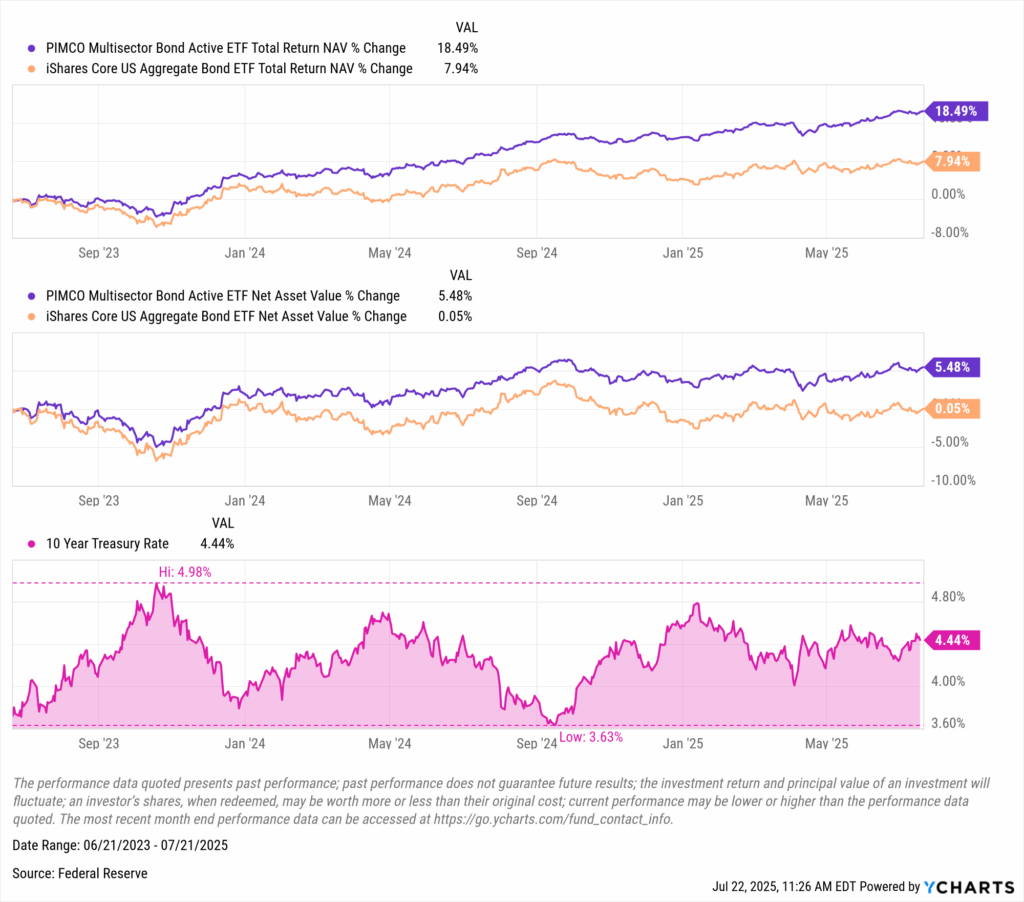
That flexibility has paid off. Since inception, PYLD has outperformed AGG on both a price and total return basis while navigating a volatile interest rate environment. The 10-year Treasury yield swung from nearly 5% in late 2022 to mid-3% in mid-2024 before returning to the mid-4% range in 2025.
Download Visual | Modify in YCharts
iShares Flexible Income Active ETF (BINC)
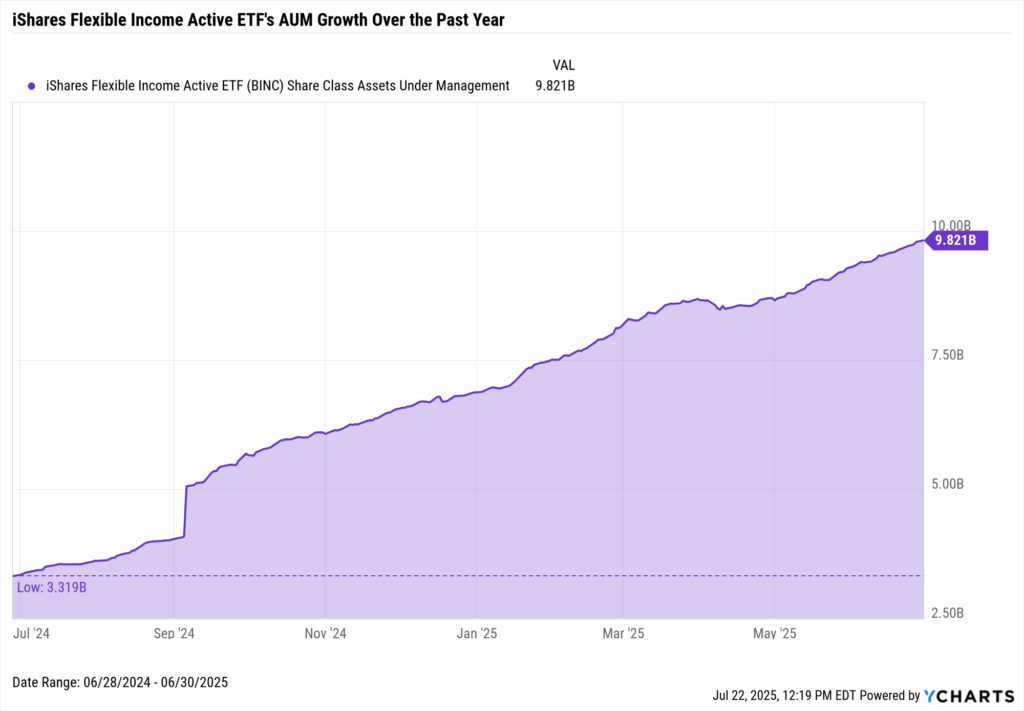
While the fastest-growing product in the iShares family over the past two years has been their bitcoin ETF, IBIT, the growth of the iShares Flexible Income Active ETF (BINC) during the same period is nothing to sneeze at. In just two years, BINC has accumulated over $10 billion in AUM, with $2.6 billion of that total flowing in 2025 alone, representing more than a quarter of its assets as of June 30, 2025.
Download Visual | Modify in YCharts
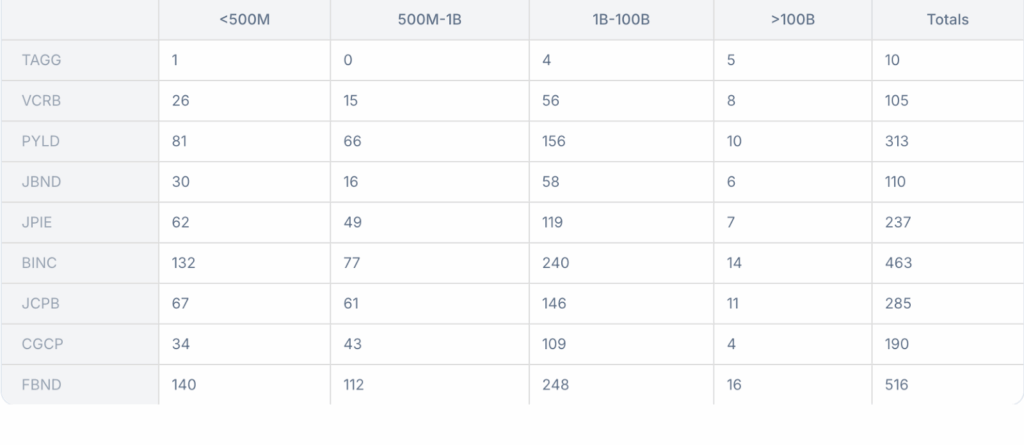
The strategy’s success is mirrored in its expanding adoption among RIAs. From the end of 2024 to the end of Q1 2025, 33 RIAs added BINC to their portfolios, a 7.7% quarter-over-quarter increase, bringing the total number of advisors reporting BINC as a holding to 464, according to data from AdvizorPro. Of these, 14 manage over $100 billion in assets, and 240 manage over $1 billion, ranking BINC second in both baskets, behind only FBND, the largest strategy in the cohort by AUM, among observed strategies.
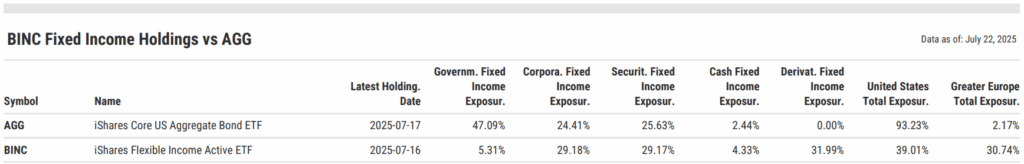
BINC’s flexible, go-anywhere mandate sharply contrasts vanilla core bond exposures like AGG. As of mid-July, BINC held just 5.3% in government bonds, compared to AGG’s 47.1%. Instead, it leans heavily into corporates (29.2%) and securitized credit (29.2%), while maintaining 32% of the portfolio in derivatives. Geographically, BINC maintains a notably high exposure to Greater Europe, with 30.7% of its holdings allocated to the region.
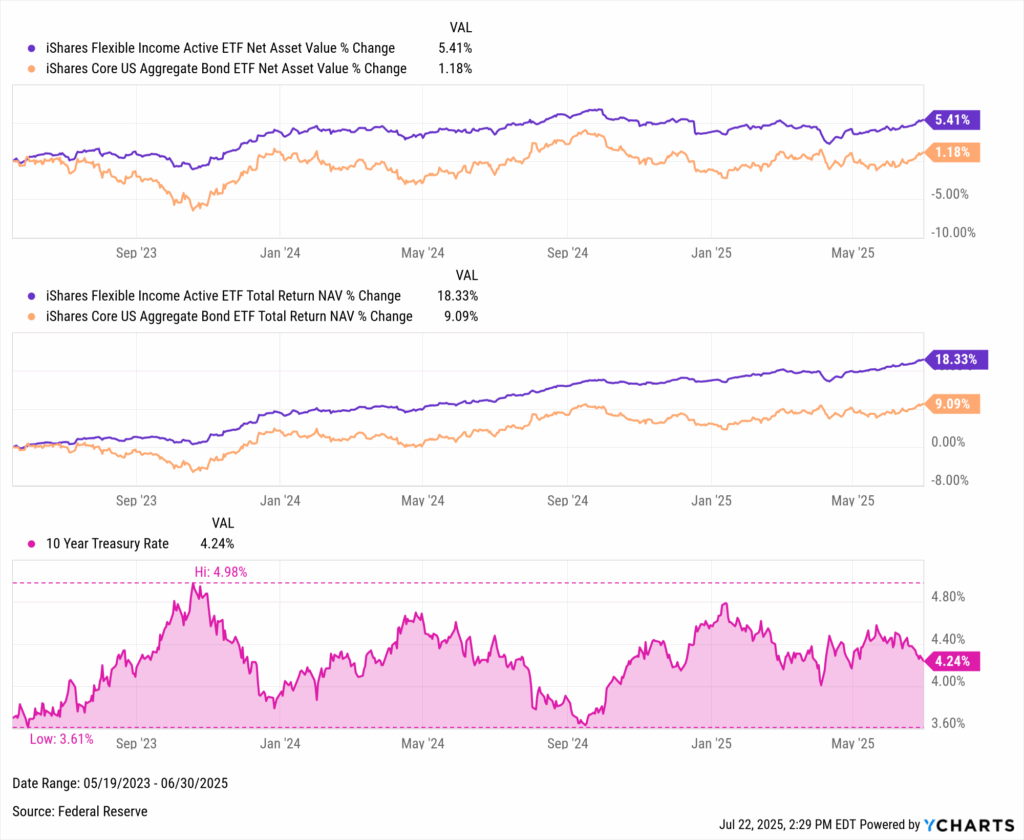
Since its launch, BINC’s managers, led by Rick Rieder, have capitalized on shifting interest rate environments to outperform AGG on a total return (18.3% vs 9.1%) and NAV basis (5.4% vs. 1.2%). BINC’s strong performance came even as the 10-year Treasury yield fluctuated between 3.6% and 5%.
Download Visual | Modify in YCharts
JPMorgan Core Plus Bond ETF (JCPB)
Backed by one of the most sophisticated fixed-income desks on Wall Street, the JPMorgan Core Plus Bond ETF (JCPB) continues to gain traction among RIAs.
According to AdvizorPro, from the end of 2024 through Q1 2025, 19 RIAs added JCPB, representing a 7.0% quarter-over-quarter increase and bringing the total number of advisors reporting the strategy in client portfolios to 289.
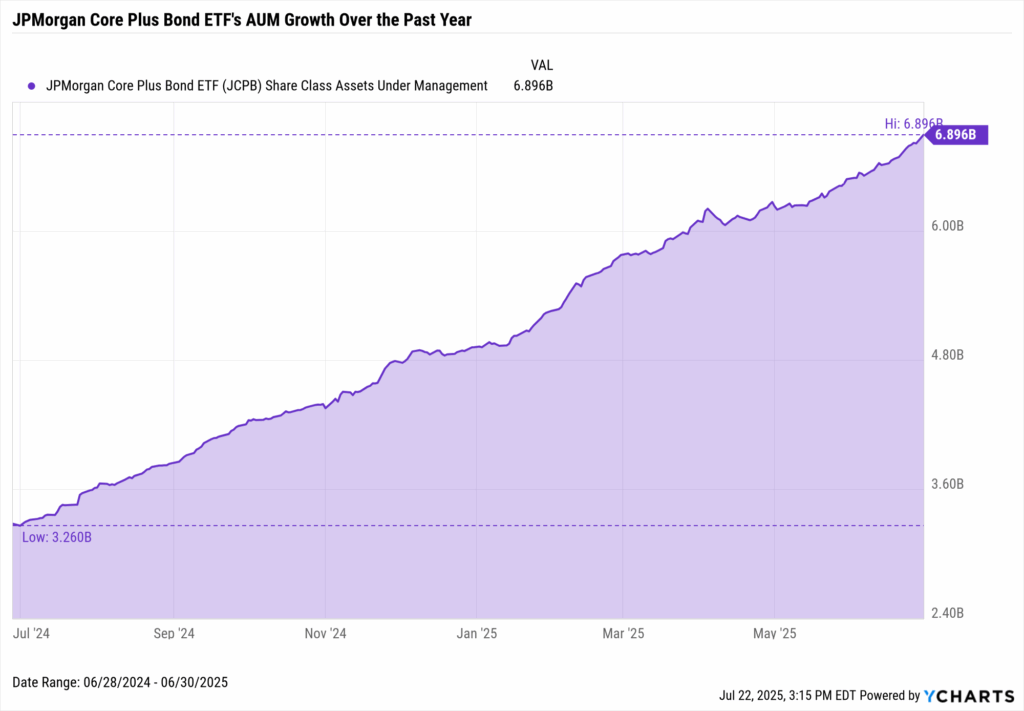
That growing interest has been accompanied by meaningful inflows: $1.7 billion in net new assets in 2025, helping drive total AUM to nearly $7 billion as of June 30, more than double where it stood a year ago.
Download Visual | Modify in YCharts
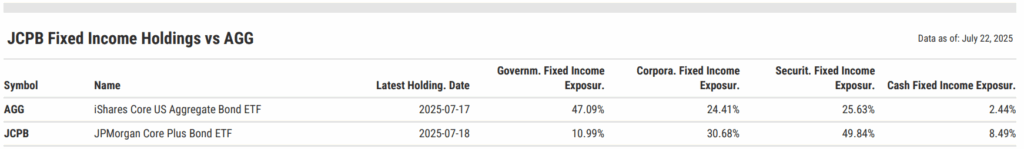
As of mid-July 2025, the fund held just 11.0% in government bonds (vs. 47.1% for AGG), while overweighting corporate debt (30.7%) and particularly securitized fixed income (49.8%). It also maintains 8.5% in cash, offering optionality in a shifting rate environment.
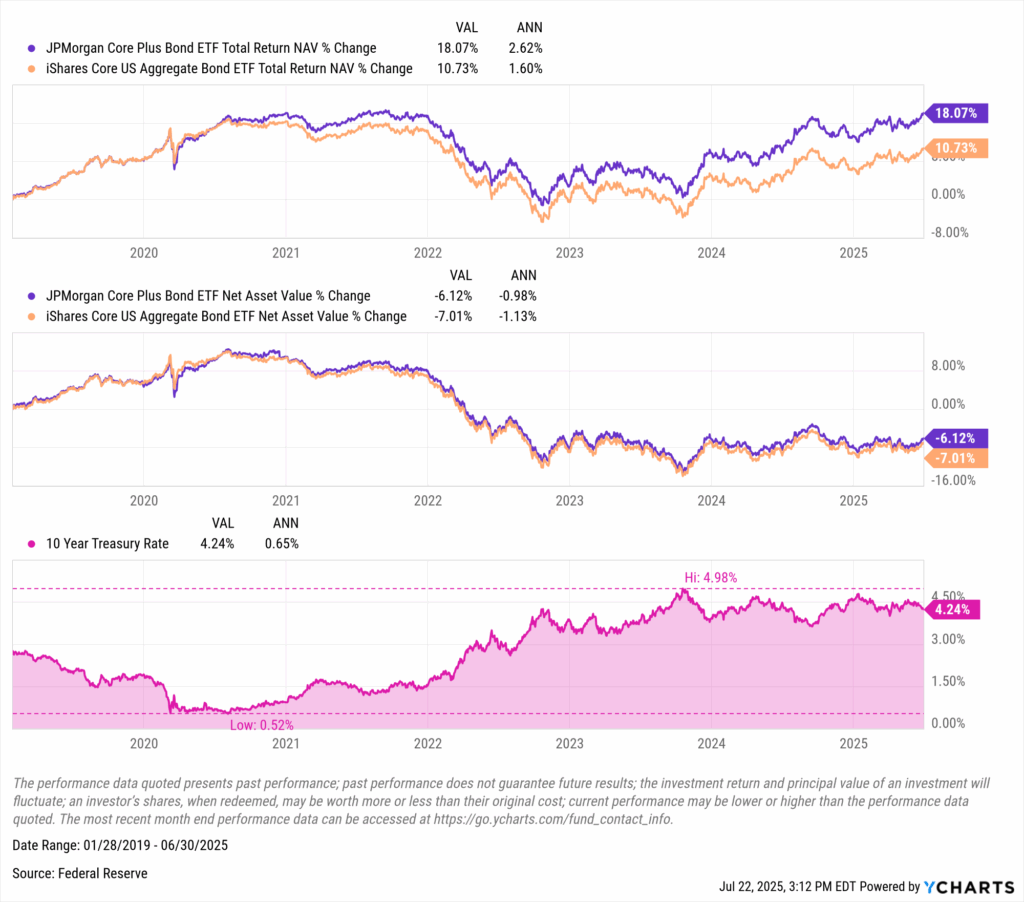
Since inception through June 2025, JCPB has generated a total return of 18.07%, outperforming AGG’s 10.73%. It also proved more resilient on a price basis, declining -6.12% versus -7.01% for AGG. That outperformance came during one of the most difficult stretches for bonds in decades, as sharp rate hikes and duration-driven losses defined the cycle, as the 10-year Treasury yield surged from 0.52% in 2020 to a peak of 4.98%.
Download Visual | Modify in YCharts
Wrapping Up: Active Fixed Income in the Spotlight
As RIAs recalibrate portfolios in response to shifting rate expectations and growing client demand for income, active fixed-income ETFs have emerged as a preferred tool. Strategies like PYLD, BINC, JCPB, and the other funds referenced at the top of this newsletter have proven their ability to deliver results and adapt in real time, helping advisors manage risk while pursuing returns in a volatile rate environment.
Active bond ETFs are capturing more flows than ever, and billion-dollar RIAs are leading the charge. Want to know which strategies are gaining ground? Subscribe to the Fund Flow Report for monthly insights on the trends, products, strategies, and asset classes driving advisor allocations.
Whenever you’re ready, here’s how YCharts can help you:
1. Book time with our asset management specialists
2. Want to test out YCharts for free?
Start a no-risk 7-Day Free Trial.
3. Sign up for a copy of our Fund Flows Report and Visual Deck to stay on top of ETF trends:
Sign up to recieve a copy of our monthly Fund Flows Report:Disclaimer
©2025 YCharts, Inc. All Rights Reserved. YCharts, Inc. (“YCharts”) is not registered with the U.S. Securities and Exchange Commission (or with the securities regulatory authority or body of any state or any other jurisdiction) as an investment adviser, broker-dealer or in any other capacity, and does not purport to provide investment advice or make investment recommendations. This report has been generated through application of the analytical tools and data provided through ycharts.com and is intended solely to assist you or your investment or other adviser(s) in conducting investment research. You should not construe this report as an offer to buy or sell, as a solicitation of an offer to buy or sell, or as a recommendation to buy, sell, hold or trade, any security or other financial instrument. For further information regarding your use of this report, please go to: ycharts.com/about/disclosure.
Next Article
Helping Clients Navigate the “Big Beautiful Bill”Read More →