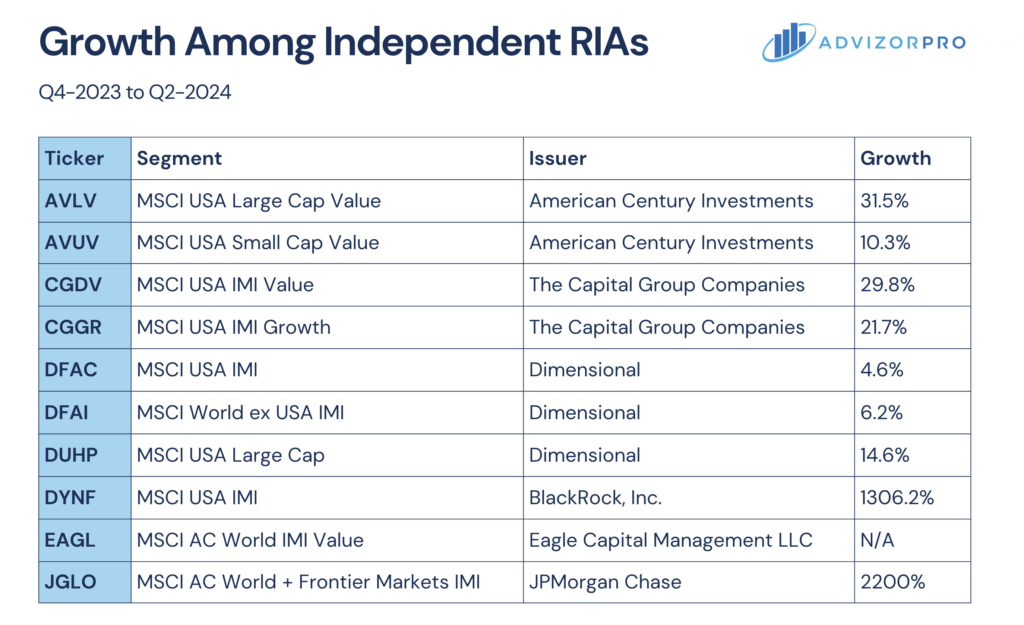
RIAs Are Embracing These 10 Active ETFs in 2024
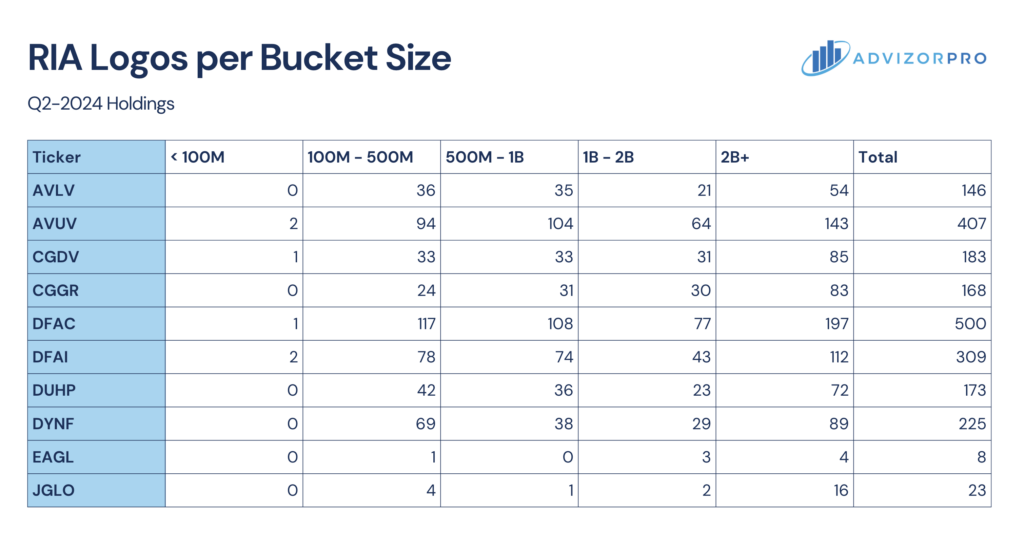
Although active equity ETFs represent just 6% of total equity ETF AUM, they’ve captured nearly a quarter of equity ETF flows through the end of July. To explore their rising popularity further, we have collaborated with AdvizorPro to examine how the top ten active strategies (by YTD flows) have fared in garnering adoption with RIAs.
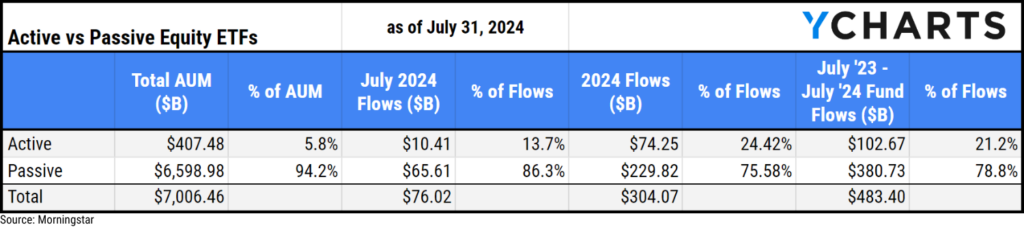
Using the YCharts Fund Screener, we’ve identified the active equity strategies—excluding derivative income and options-based funds to focus on stock pickers—that have attracted the most assets year-to-date. AdvizorPro provided analysis on the particular growth of these strategies at RIAs through the end of Q2 2024.
DYNF
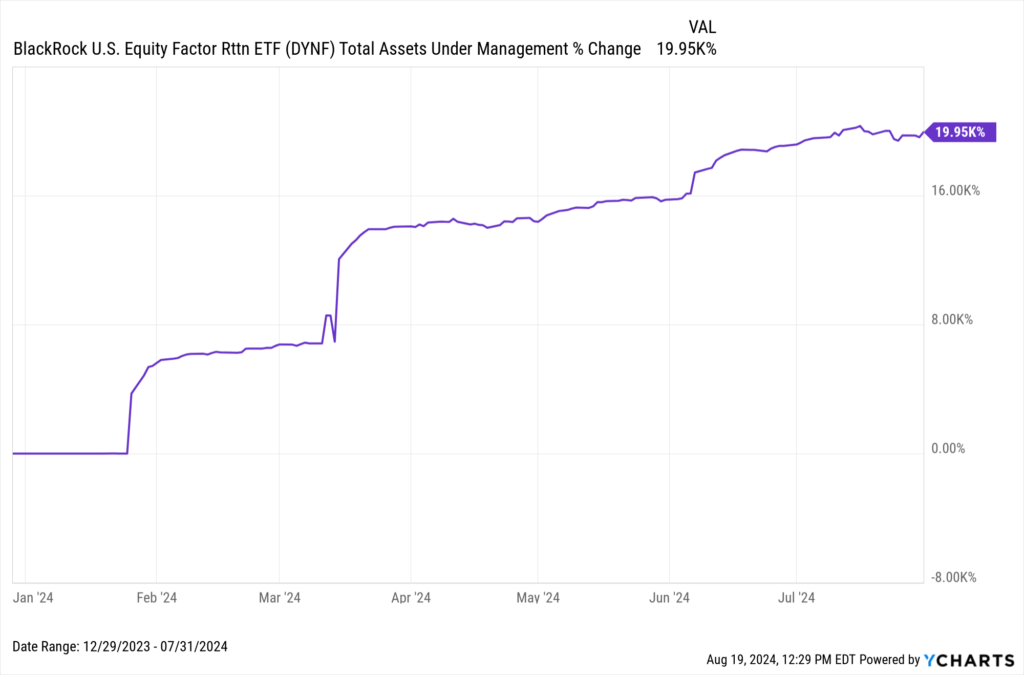
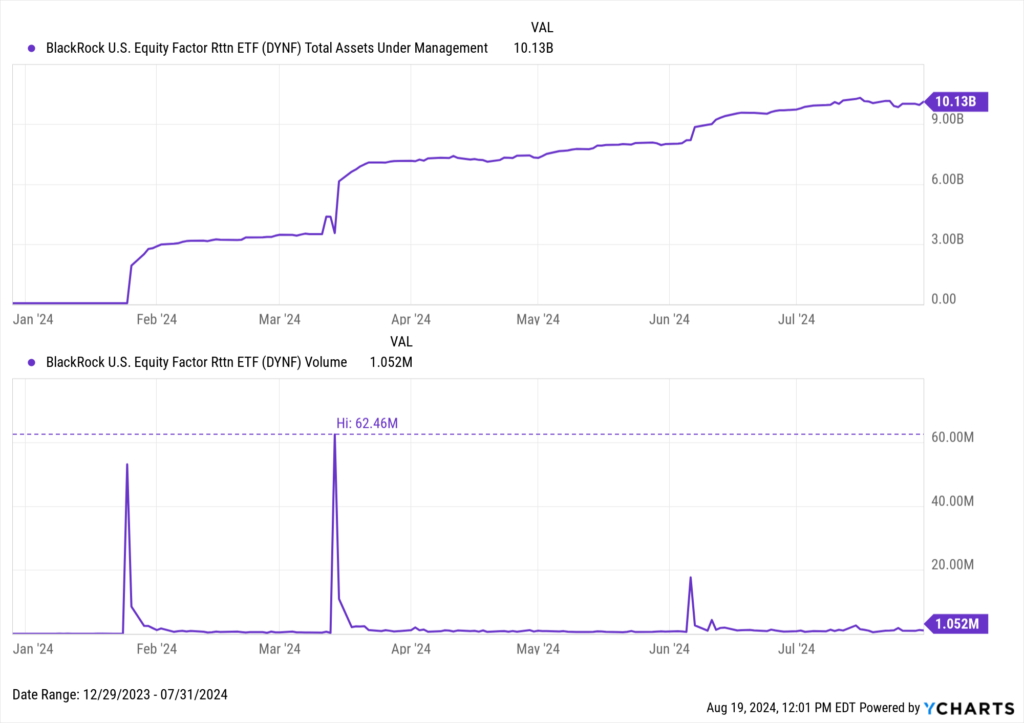
The BlackRock U.S. Equity Factor Rotation ETF (DYNF)’s AUM exploded with a nearly 200-fold increase, jumping from $50.5 million at the end of 2023 to a staggering $10.1B by July 2024, with an almost $9.2B in YTD flows representing over 90% of its AUM. Additionally, DYNF experienced an impressive 13-fold increase in adoption among RIAs since Q4 2023, further underscoring its rapid rise in popularity.
Download Visual | Modify in YCharts
The strategy actively selects large-cap stocks based on a strategic rotation among five traditional investment factors: minimum volatility, momentum, quality, small size, and value. This ETF’s active selection allows for daily adjustments in its holdings, differentiating it from many other single- or multi-factor ETFs that follow a typical monthly or quarterly reconstitution or rebalancing schedule.
The likely driver behind this year’s surge in DYNF’s AUM was its increased allocation within several of BlackRock’s model portfolios. This implementation likely occurred around late January, based on a spike in trading volume that typically indicates heightened institutional interest.
Download Visual | Modify in YCharts
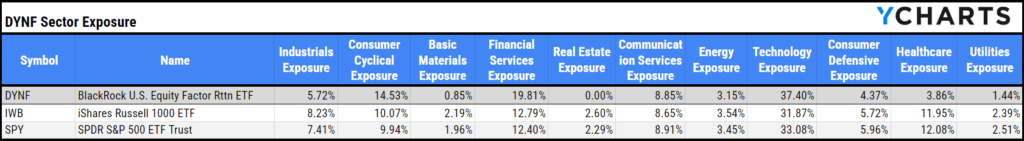
When compared to the S&P 500 (represented by SPY) and Russell 1000 (represented by IWB), DYNF is overweight the Consumer Cyclical, Financials, and Technology sectors while notably underweight Healthcare and Industrials.
Download Visual | Modify in YCharts
AVUV
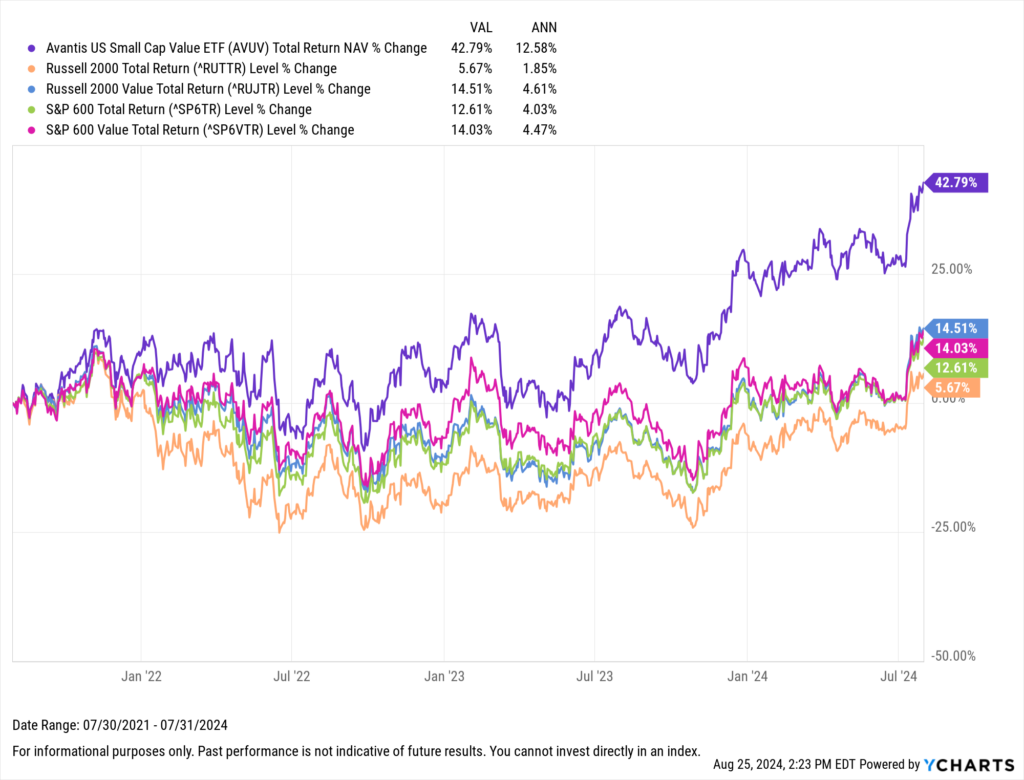
The Avantis US Small Cap Value ETF (AVUV) has handily outperformed small blend and value indices over the past three years, delivering a 42.8% return—nearly triple the returns of the Russell 2000 Value Index (14.51%) and more than triple the returns of the S&P 600 Value Index (14.03%) during the same period.
Download Visual | Modify in YCharts
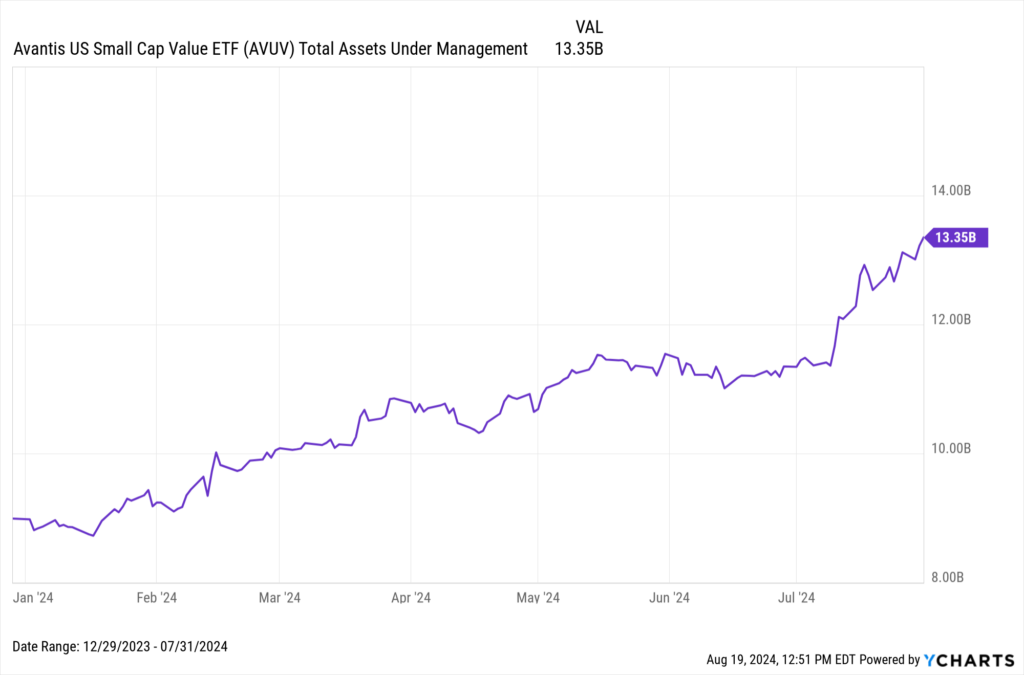
During this period, its strong performance attracted considerable attention from advisors, leading to a nearly 50% increase in AUM—from $9.0B at the end of 2023 to $13.4B by July 2024.
Furthermore, the fund has witnessed a 10% rise in RIA adoption since the end of Q4 2023, with 2024 inflows alone accounting for 22% of its total AUM, underscoring the growing confidence in the small-cap strategy.
Download Visual | Modify in YCharts
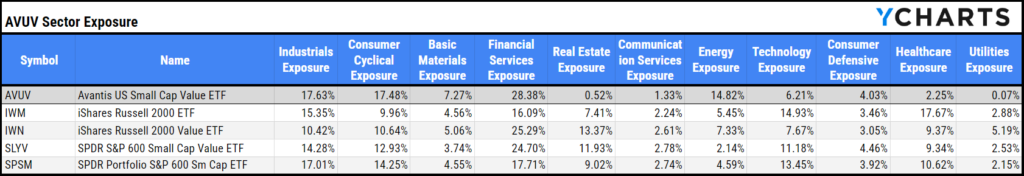
Through the end of June, Ryder System Inc (R), MDU Resources Group Inc (MDU), and SLM Corp (SLM) were among the largest holdings in AVUV that weren’t found in funds replicating the benchmark indices above. When compared on a sector basis, AVUV is overweight Financials, Consumer Cyclical, and Energy, while it’s significantly underweight Health Care, Real Estate, Technology, and Utilities.
Download Visual | Modify in YCharts
CGDV
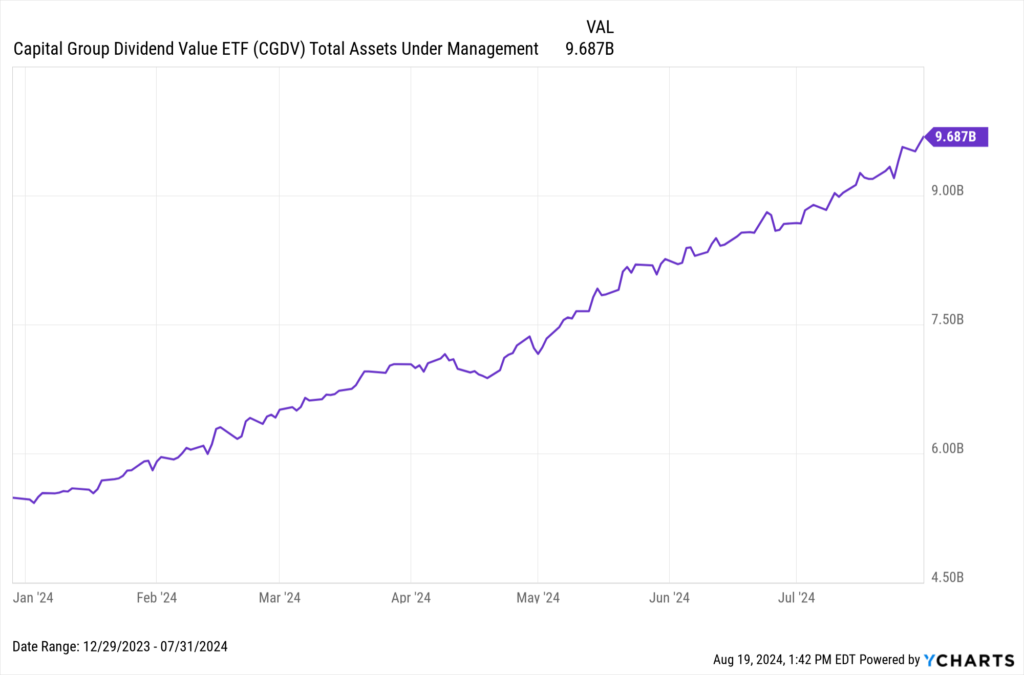
The Capital Group Dividend Value ETF (CGDV)’s AUM has increased over 75%, from $5.5B at the end of 2023 to $9.7B by the end of July. Notably, the $2.9B it has attracted in this year accounts for more than 30% of its total AUM, with this growth fueled by the fund’s success among RIAs, where it has experienced a 29.8% increase in adoption since the end of 2023.
Download Visual | Modify in YCharts
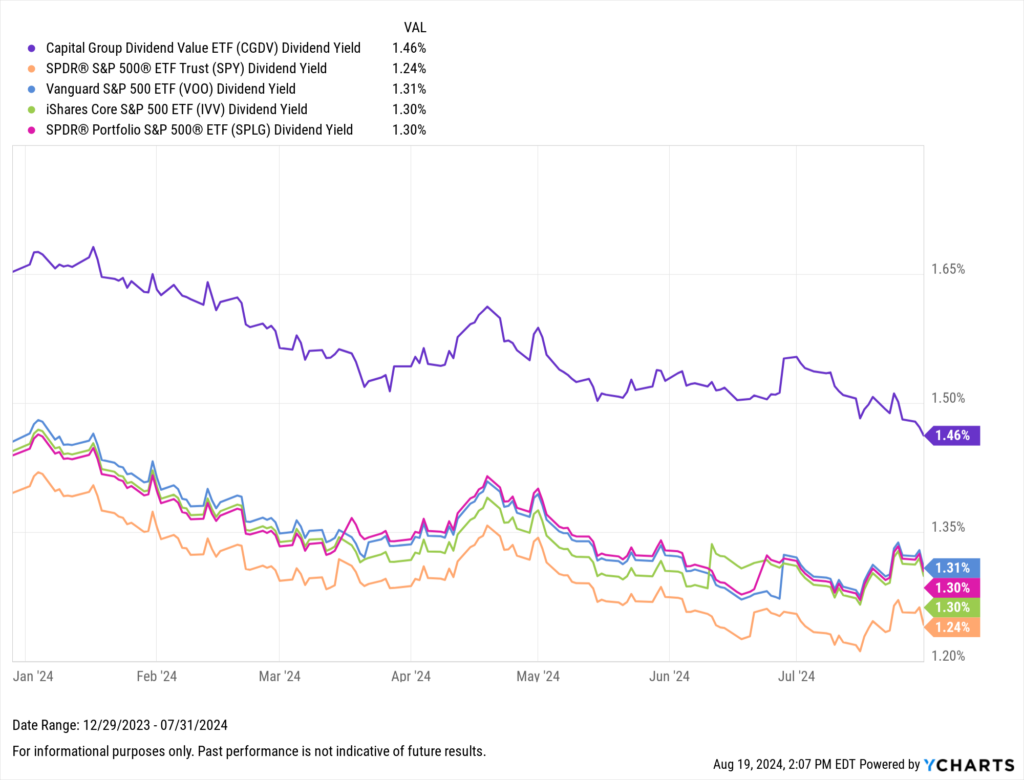
As an equity-income strategy, it seeks to provide income potential and capital appreciation to its investors, explicitly seeking to exceed the average yield that the S&P 500 is providing. CGDV’s dividend yield was 1.46% through the end of July, higher than the big three S&P 500 ETFs (VOO, SPY/SPLG, and IVV).
Download Visual | Modify in YCharts
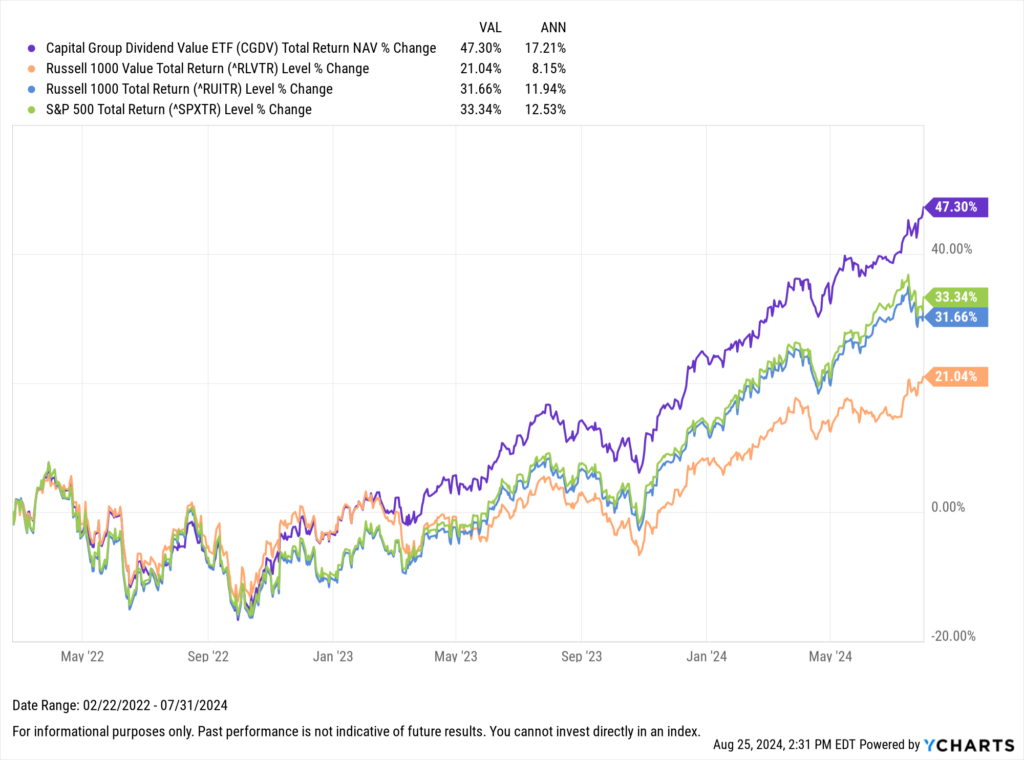
In addition to providing its investors with more yield, CGDV has outperformed the Russell 1000 Value, the broader Russell 1000, and the S&P 500 since the beginning of 2023.
Download Visual | Modify in YCharts
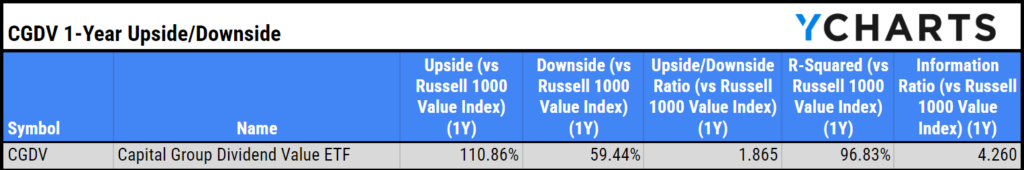
This outperformance is further reflected in strong relative performance metrics. Over the past year, CGDV captured 110.9% of the Russell 1000 Value’s gains while limiting downside exposure to just 59.4%, meaning it captured nearly 1.87 times the upside for every unit of downside risk. This risk-adjusted performance is also highlighted by its information ratio of 4.26.
Download Visual | Modify in YCharts
JGLO
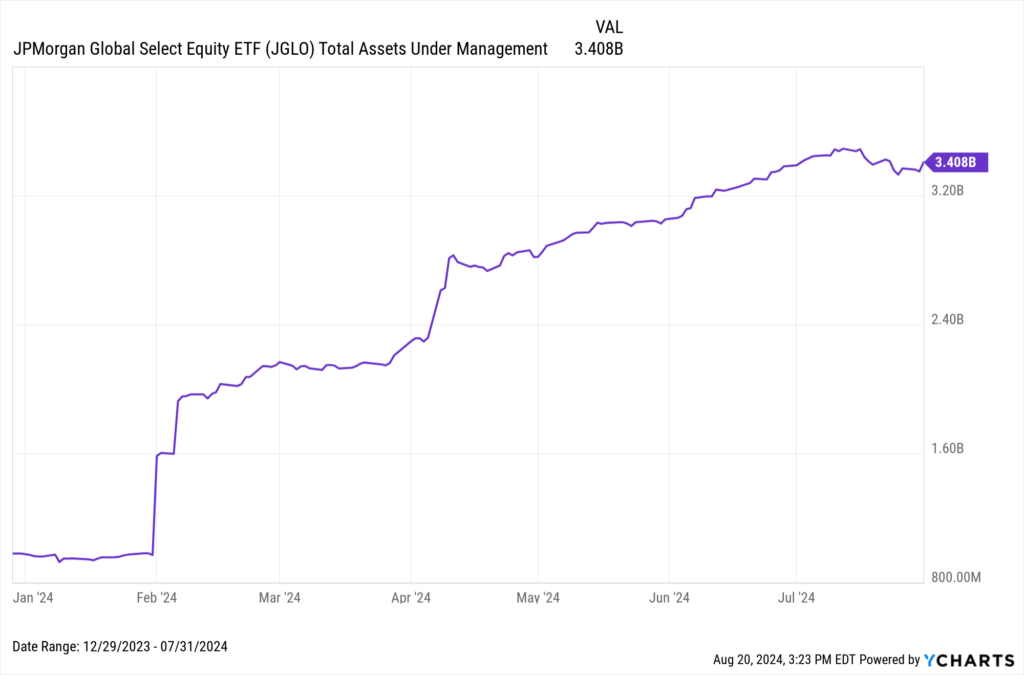
In less than a year since its inception, the JPMorgan Global Select Equity ETF (JGLO)’s AUM skyrocketed to $3.4B by July 2024, more than tripling from $980 million in AUM at the end of 2023, and the $2.1B in inflows during 2024 represent an impressive 62.3% of the total AUM. Additionally, JGLO’s experienced a 22-fold increase in RIA adoption since the end of 2023.
Download Visual | Modify in YCharts
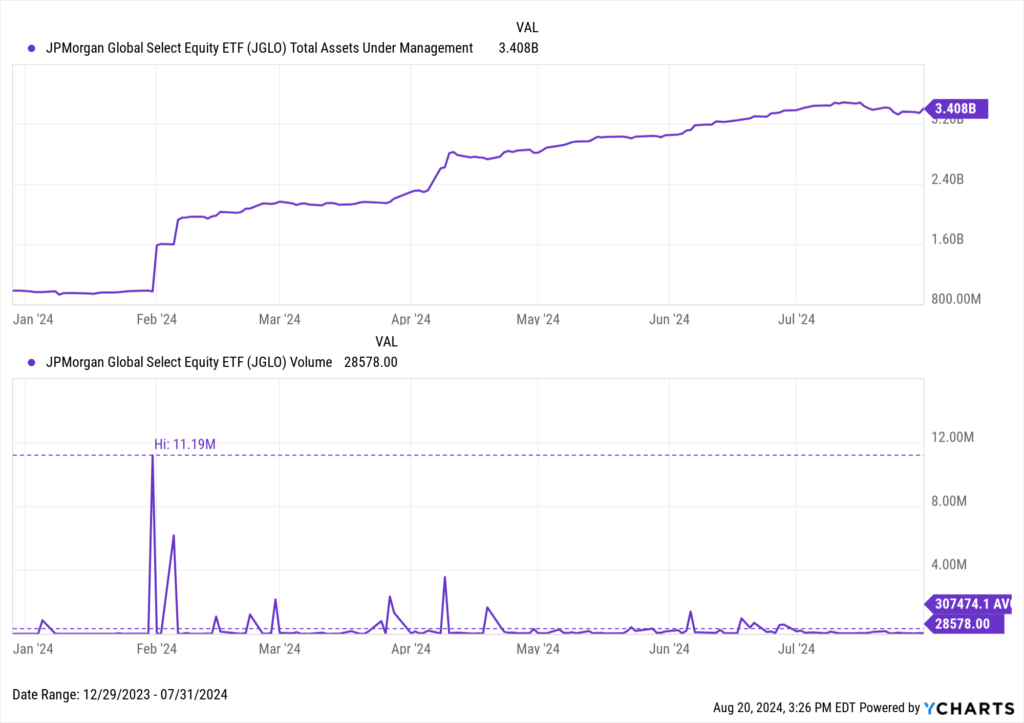
As JPMorgan continues to move into the active ETF space, they’ve positioned JGLO as a fund encompassing their “best ideas” globally. Similar to DYNF, JGLO’s rapid AUM ascension has likely been prompted by inclusion in model portfolios, evidenced by the spikes in volume since its inception.
Download Visual | Modify in YCharts
EAGL
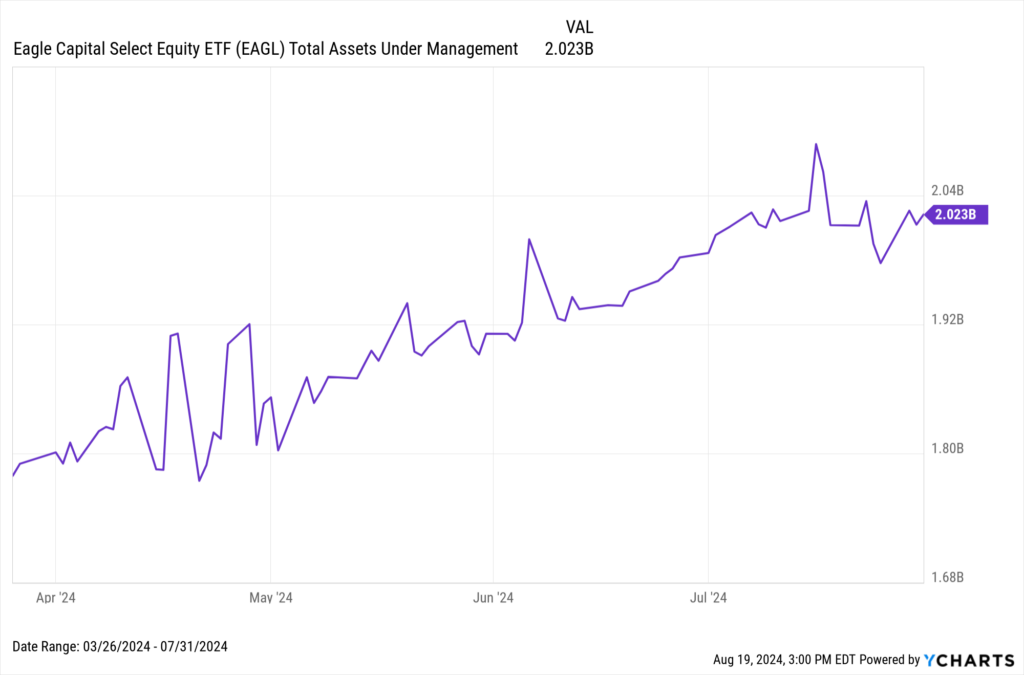
The Eagle Capital Select Equity ETF (EAGL) became the first SMA-to-ETF conversion through the Goldman Sachs ETF Accelerator in March of this year. Thanks in large part to the $1.8B that accompanied the conversion, the strategy has quickly amassed over $2 billion in AUM, placing it fifth among the active strategies we analyzed.
Download Visual | Modify in YCharts
Since its inception, EAGL has lagged behind the S&P 500 in performance. However, the Eagle Capital SMA, from which it was converted, boasts a much stronger long-term track record against the S&P 500. This strong reputation likely played a key role in its rapid adoption by seven RIAs with at least $1 billion under advisory within the first quarter of the fund’s launch.
The SMA was crafted as a concentrated strategy, typically holding 25-35 positions, with the goal of generating returns in both rising and falling markets. It employs a bottom-up, research-driven approach aiming to identify undervalued companies poised for long-term secular change.
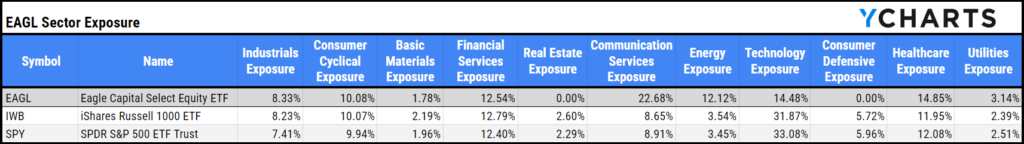
EAGL, which held 44 positions at the end of March (including treasuries and other liquidity instruments), distinguished itself from broader benchmark funds by being overweight in Communication Services and Energy while maintaining underweight positions in Real Estate, Technology, and Consumer Defensive sectors through the end of March.
Download Visual | Modify in YCharts
CGGR
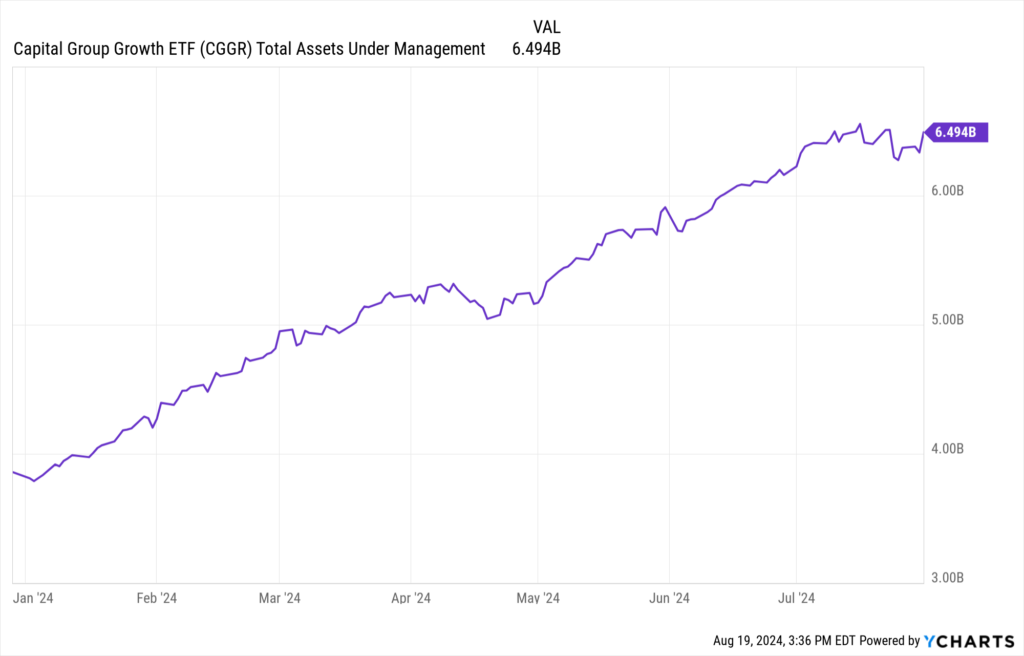
The Capital Group Growth ETF (CGGR)’s AUM has expanded 68% YTD from $3.9B at the close of 2023 to $6.5B by the end of July. The $1.9B in inflows during 2024 alone represent 29.2% of its total AUM. Similar to CGDV, CGGR has secured a strong presence in RIA portfolios, with adoption increasing by 21.7% since the end of 2023.
Download Visual | Modify in YCharts
Unlike CGDV, which also focuses on yield, CGGR exclusively focuses on capital growth without being constrained by a style box. This approach allows its managers the flexibility to invest in companies across various geographies and equity styles.
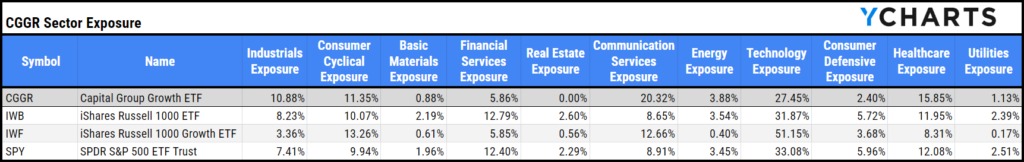
Currently, CGGR has a 3.9% exposure to Europe and 1.3% to Asia, and it further differentiates itself through its sector allocation. CGGR’s combined allocation to Communication Services and Technology at 47.8% is significantly lower than the Russell 1000 Growth’s 63.2% but higher than the S&P 500’s 41.5%. Additionally, CGGR is overweight Health Care at 15.9%, surpassing the S&P 500’s 12.1% and the Russell 1000 Growth’s 8.4% weights, while avoiding Real Estate altogether, further differentiating it from the broader indices.
Download Visual | Modify in YCharts
DFAC
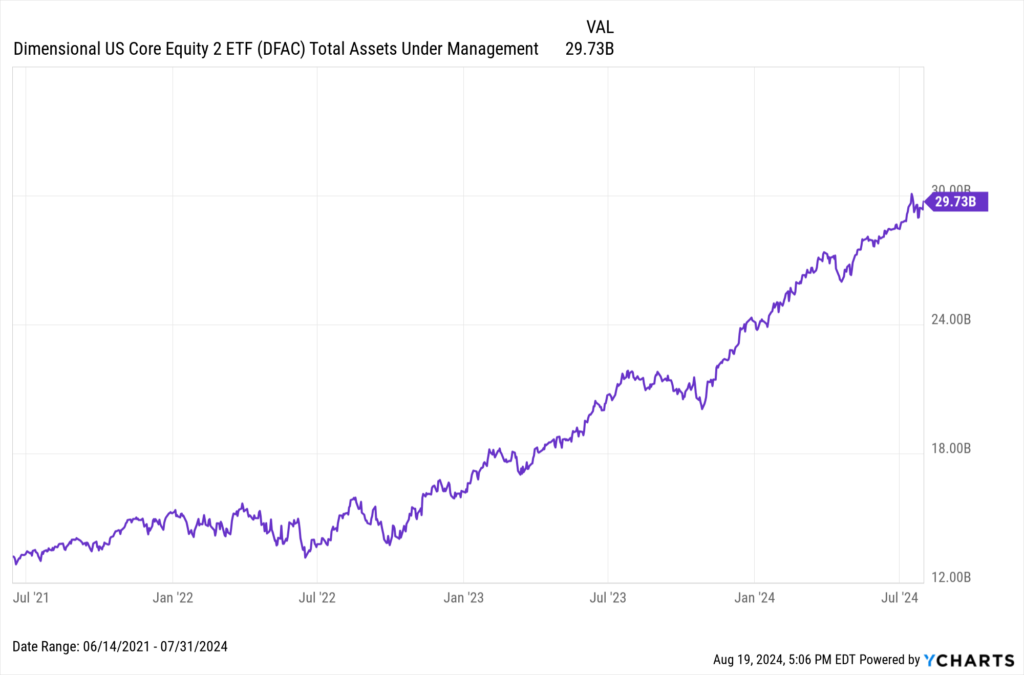
The Dimensional US Core Equity 2 ETF (DFAC)’s AUM grew by 23%, rising from $24.2B to $29.7B by the end of July. Notably, its $1.8B in inflows in 2024 account for 6.2% of its total AUM. Additionally, DFAC has experienced a 4.6% increase in RIA adoption since the end of 2023.
Download Visual | Modify in YCharts
DFAC aims to deliver capital growth with a focus on tax efficiency. Despite being an active stock-picking strategy, its managers exhibit strong conviction in their long-term investments, as evidenced by the fund’s low 3% annual turnover ratio.
This rate is on par with passive large blend index funds like the S&P 500 ETFs, which have turnover ratios around 2-3%. It starkly contrasts the higher turnover ratios seen in smaller or more style-focused strategies, such as the iShares Russell 1000 Value ETF (14%) and the iShares Russell 2000 ETF (17%).
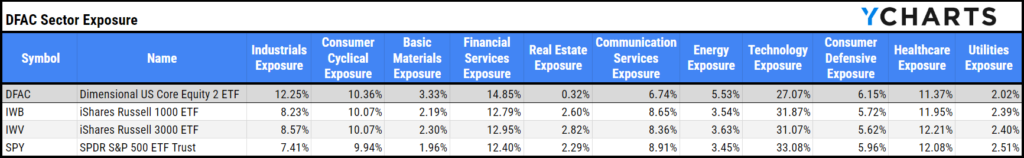
Although DFAC is classified as a large blend strategy, it allocates over 45% of its portfolio to micro, small, and mid-sized stocks while maintaining diversification across sectors. Compared to the S&P 500, Russell 1000, and 3000, DFAC is overweight Industrials, Financial Services, and Energy while being underweight in Technology and Communication Services.
Download Visual | Modify in YCharts
AVLV
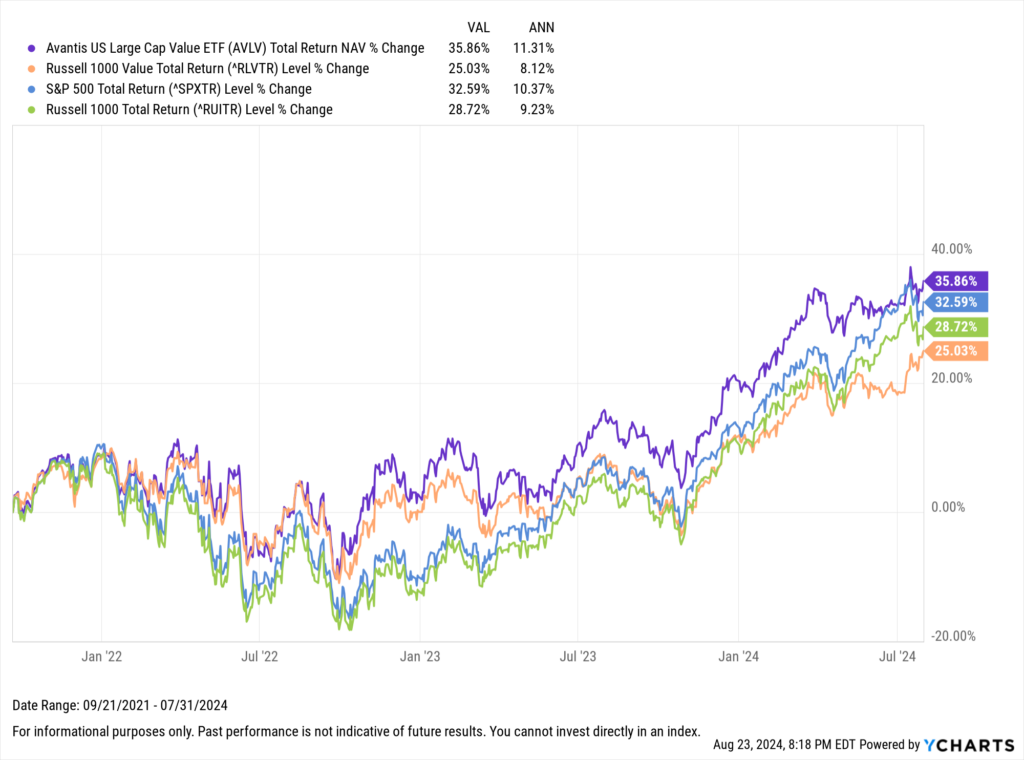
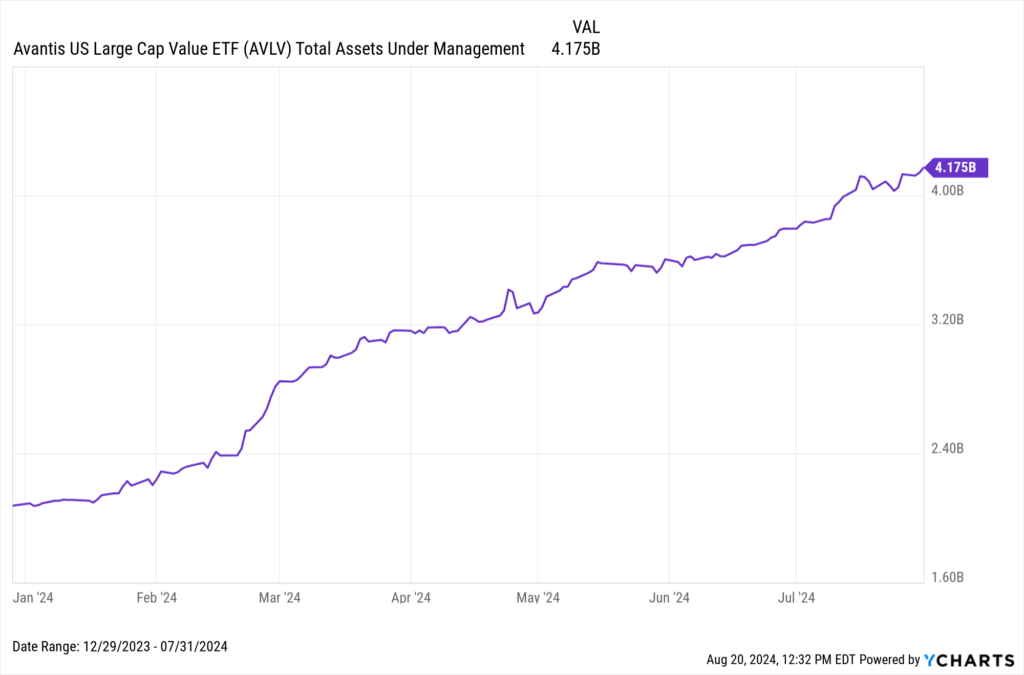
Avantis US Large Cap Value ETF (AVLV)’s AUM more than doubled, increasing by 101% from $2.1B at the end of 2023 to $4.2B by July 2024. Since its inception in September 2021, the large-cap value strategy has outperformed the Russell 1000 Value and the broader S&P 500 and Russell 1000.
Download Visual | Modify in YCharts
Like its small-cap counterpart (AVUV), the fund’s strong performance has garnered substantial attention from advisors. This interest has led to a 31.5% increase in RIA adoption since the end of 2023, and the $1.7B in inflows during 2024 alone (as of July 31), account for 41.8% of its total AUM.
Download Visual | Modify in YCharts
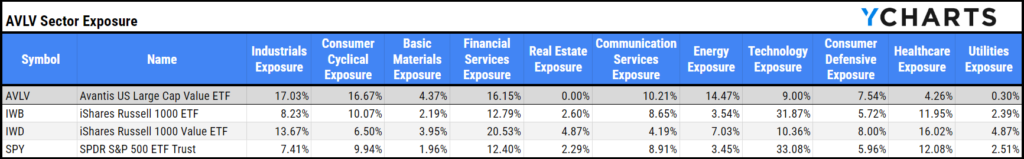
One aspect of AVLV’s performance that likely intrigues advisors is its ability to deliver strong returns with minimal exposure to the technology sector, which has driven the performance of several major indices.
AVLV has just 9% exposure to Technology, significantly lower than the Russell 1000’s 31.9%. Instead, it prioritizes sectors like Industrials, Consumer Cyclicals, and Energy, where it is overweight compared to the Russell 1000 Value’s 13.7%, 6.5%, and 7% exposures, respectively.
Download Visual | Modify in YCharts
DUHP
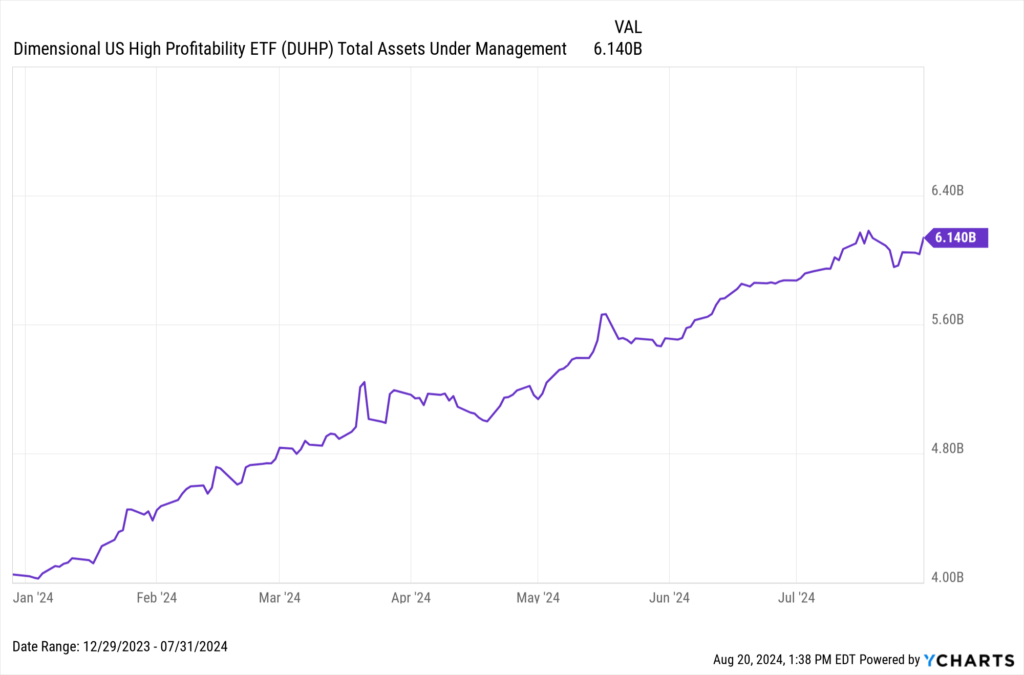
The Dimensional US High Profitability ETF (DUHP)’s AUM rose 52%, from $4.1B at the close of 2023 to $6.1B by July 2024.
Download Visual | Modify in YCharts
As its name suggests, the fund is focused on screening for high-profitability names, aiming to provide long-term capital growth to its investors. DUHP has attracted $1.4B in inflows this year, representing 23% of its total AUM, and has seen a 14.6% increase in RIA adoption since the end of 2023—a clear sign that a large-cap fund focused on profitability is attractive to advisors.
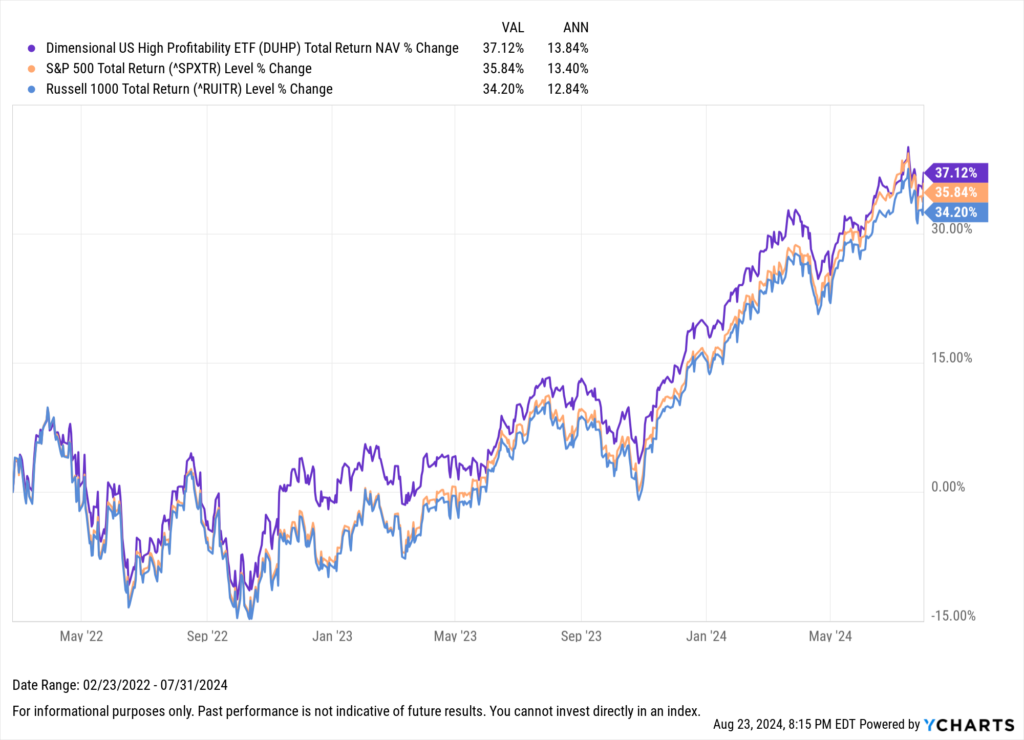
Since its inception, DUHP has produced results aligning with the strategy’s narrative—outperforming the Russell 1000 and S&P 500.
Download Visual | Modify in YCharts
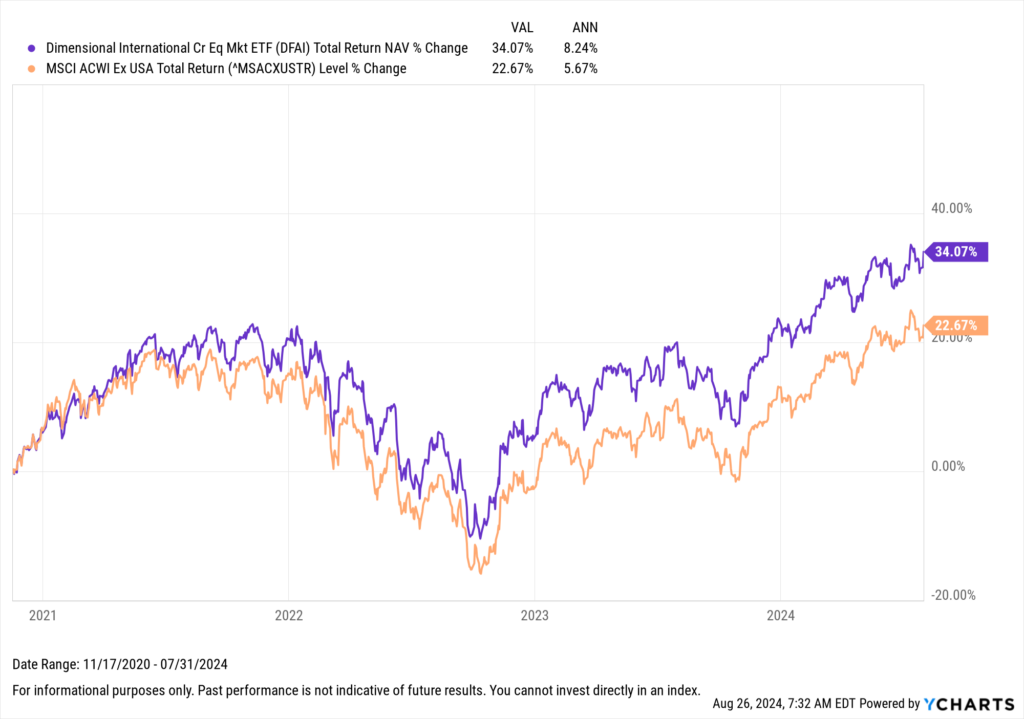
DFAI
The Dimensional International Core Equity Market ETF (DFAI) stands out as the only exclusively international equity strategy on the list, seemingly capitalizing on the growing belief that market leadership is poised to shift. After a decade of U.S. equity dominance, there’s increasing sentiment that global markets now offer more attractive valuations, signaling a potential turn in favor of international equities.
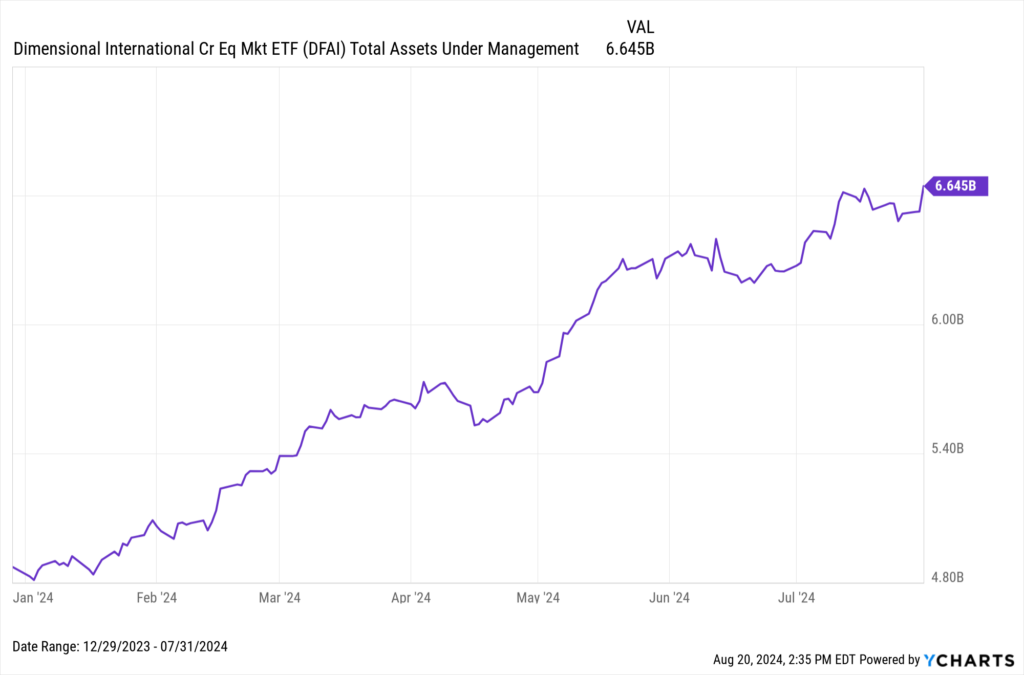
This posture is reflected in DFAI’s 6.2% increase in RIA adoption since the end of 2023 (through the end of Q2 2024), as well as the 36% growth in AUM, rising from $4.9 billion at the end of 2023 to $6.6 billion by July 2024. Notably, the $1.3 billion in inflows so far in 2024 account for 19.6% of its total AUM, further underscoring its growing appeal among advisors.
Download Visual | Modify in YCharts
DFAI’s outperformance against the MSCI ACWI ex-USA index, delivering a total return of 34.1% compared to the index’s 22.7%, has likely been a significant factor driving advisor interest.
Download Visual | Modify in YCharts
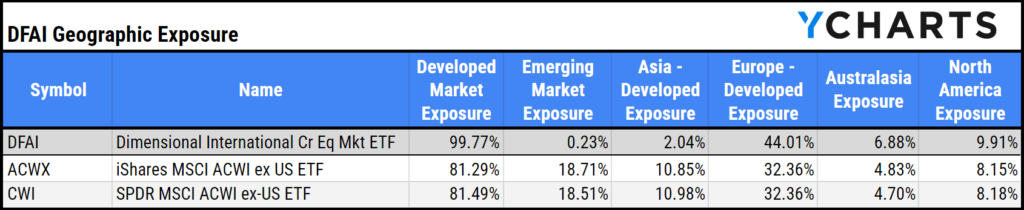
This strong performance can be attributed, in part, to DFAI’s distinct geographic exposure. Its portfolio is heavily focused on developed markets— with 99.8% allocated there, compared to the near-80% for the benchmark ETFs (ACWX and CWI). Notably, DFAI is particularly concentrated in Europe, with 58% of its portfolio in Greater Europe and 44.1% in developed European markets, far exceeding the allocations of the benchmark strategies.
Download Visual | Modify in YCharts
Whenever you’re ready, there are three ways YCharts can help you:
Have questions about how YCharts can help you grow AUM and prepare for meetings?
Email us at hello@ycharts.com or call (866) 965-7552. You’ll get a response from one of our Chicago-based team members.
Unlock access to our Fund Flows Report and Visual Deck by becoming a client.
Dive into YCharts with a no-obligation 7-Day Free Trial now.
Sign up for a copy of our Fund Flows Report and Visual Deck (clients only):
Disclaimer
©2024 YCharts, Inc. All Rights Reserved. YCharts, Inc. (“YCharts”) is not registered with the U.S. Securities and Exchange Commission (or with the securities regulatory authority or body of any state or any other jurisdiction) as an investment adviser, broker-dealer or in any other capacity, and does not purport to provide investment advice or make investment recommendations. This report has been generated through application of the analytical tools and data provided through ycharts.com and is intended solely to assist you or your investment or other adviser(s) in conducting investment research. You should not construe this report as an offer to buy or sell, as a solicitation of an offer to buy or sell, or as a recommendation to buy, sell, hold or trade, any security or other financial instrument. For further information regarding your use of this report, please go to: ycharts.com/about/disclosure
Next Article
A Closer Look at July 2024 Fund Flows: Inflows into Fixed Income Funds and Recovery of Money MarketsRead More →