Tariff Shock: Top S&P 500 Winners and Losers (April 2–16, 2025)

Introduction
In early April 2025, President Donald Trump’s announcement of sweeping tariffs sent shockwaves through global markets. While some sectors and companies have emerged as beneficiaries, others have faced significant challenges. This analysis delves into the top-performing and most adversely affected stocks since the tariff implementation, offering insights into the evolving economic landscape.
Market Overview
The immediate aftermath of the tariff announcement saw unprecedented market volatility. The S&P 500 and Nasdaq experienced their most significant single-day drops since 2020, with the S&P 500 falling 4.8% . However, a subsequent partial rollback of tariffs led to a historic rebound, with the S&P 500 surging over 9% in a single day . This roller-coaster ride underscored the market’s sensitivity to trade policies and the importance of strategic positioning.
Top 5 S&P 500 Winners Since Tariff Day
Palantir Technologies Inc (PLTR)
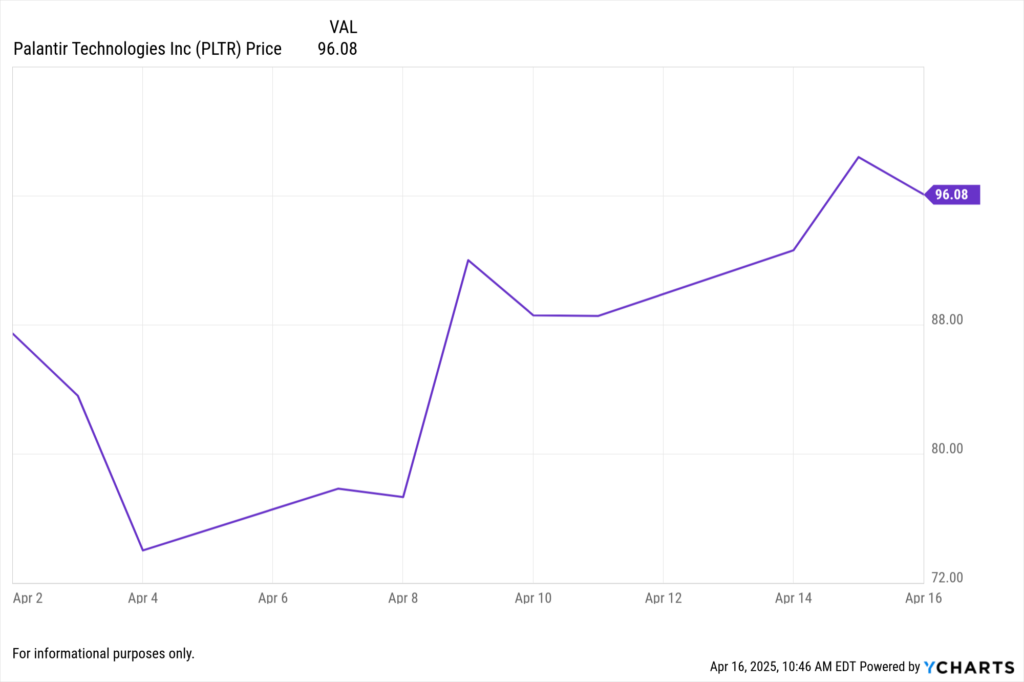
Total Return Since 4/2: +12.52%.
Contributing Factors:
NATO Contract Boost: Palantir secured a high-profile deal with NATO to deploy its AI-enabled Maven Smart System (MSS NATO), marking one of the alliance’s fastest procurement cycles and signaling strong international adoption of Palantir’s defense technology.
Strength in U.S. Government Business: Palantir’s U.S. government segment continues to show strong momentum, with Q4 2024 revenue up 45%, driven by expanding contracts and deepening use of its Gotham and Foundry platforms across federal agencies.
Newmont Corp (NEM)
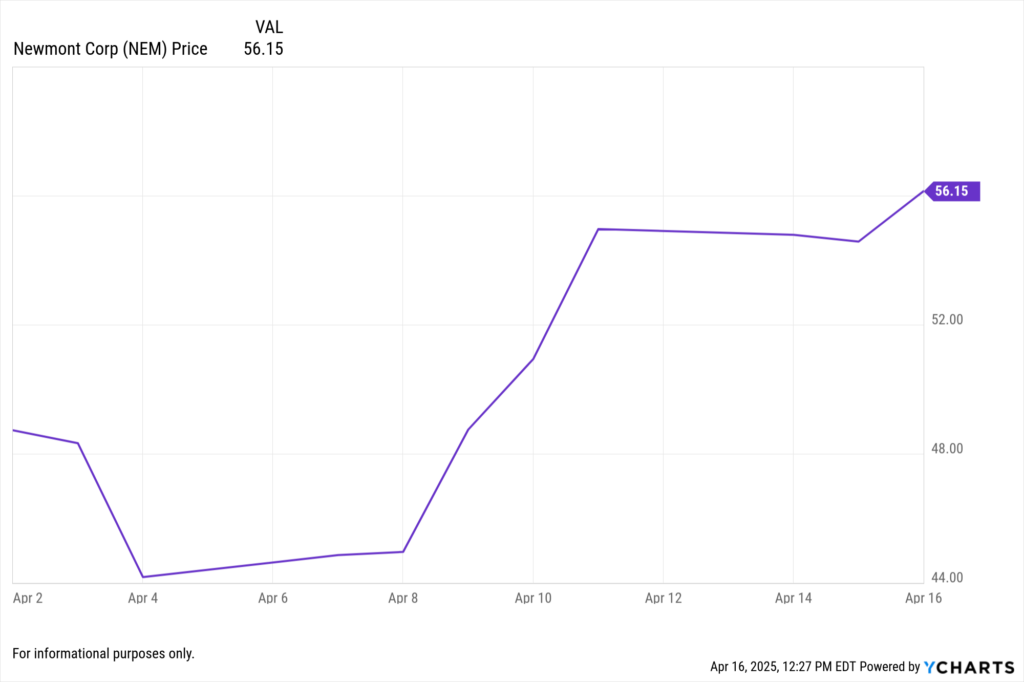
Total Return Since 4/2: +12%
Contributing Factors:
Gold Price Surge Amid Economic Uncertainty: Newmont’s stock has benefited from a significant rise in gold prices, which reached record highs above $3,248 per ounce. This surge is driven by investors seeking safe-haven assets amid global economic uncertainties and trade tensions. As the world’s largest gold producer, Newmont stands to gain from higher gold prices, which enhance its revenue and profitability.
Strategic Divestitures and Financial Strength: Newmont has completed its non-core divestiture program, including the sale of its Akyem and Porcupine assets. These strategic moves are expected to generate approximately $2.5 billion in net cash proceeds, strengthening the company’s balance sheet and providing flexibility for shareholder returns or further investments.
3. UnitedHealth Group Inc (UNH)
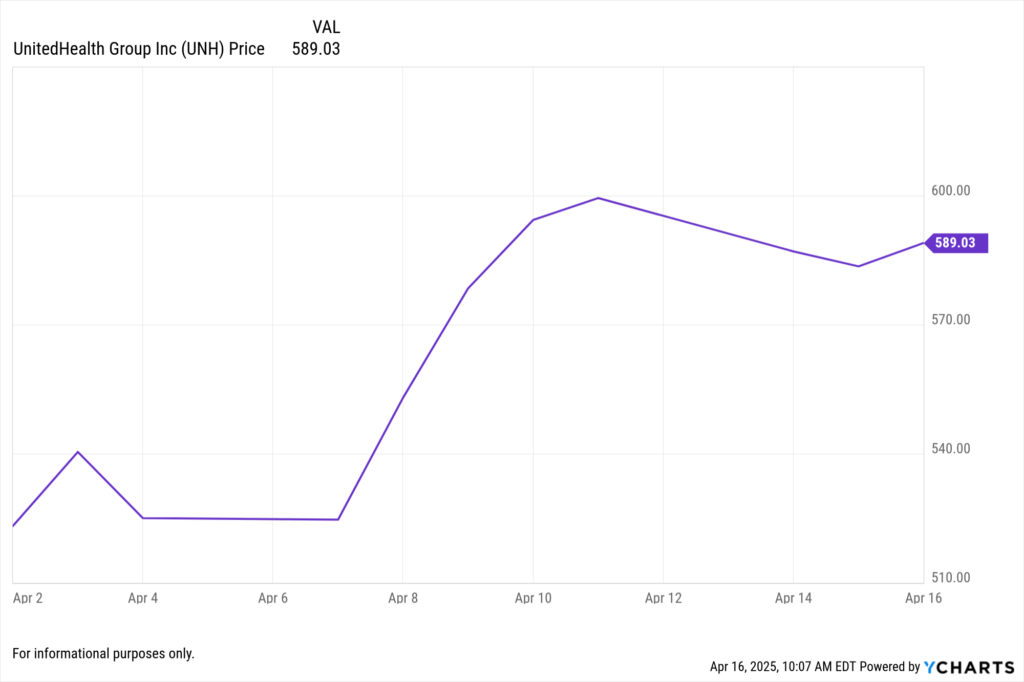
Total Return Since 4/2: +11.54%
Contributing Factors:
Higher-than-Expected Medicare Advantage Payments: The Centers for Medicare & Medicaid Services (CMS) announced a more than 5% increase in Medicare Advantage payments for 2026, surpassing initial projections. This policy shift is anticipated to add $25 billion to taxpayer costs and has positively impacted major Medicare Advantage providers, including UnitedHealth Group, whose shares rose over 7% following the announcement.
Strong Anticipated Q1 2025 Financial Performance: Analysts project that UnitedHealth Group will report first-quarter earnings per share (EPS) of $7.29, reflecting a 5.5% increase from the prior year, and revenue of $111.5 billion, marking an 11.7% year-over-year growth. This anticipated performance is driven by higher premiums, expansion in value-based care, and growth in the Optum and UnitedHealthcare segments.
Humana Inc (HUM)
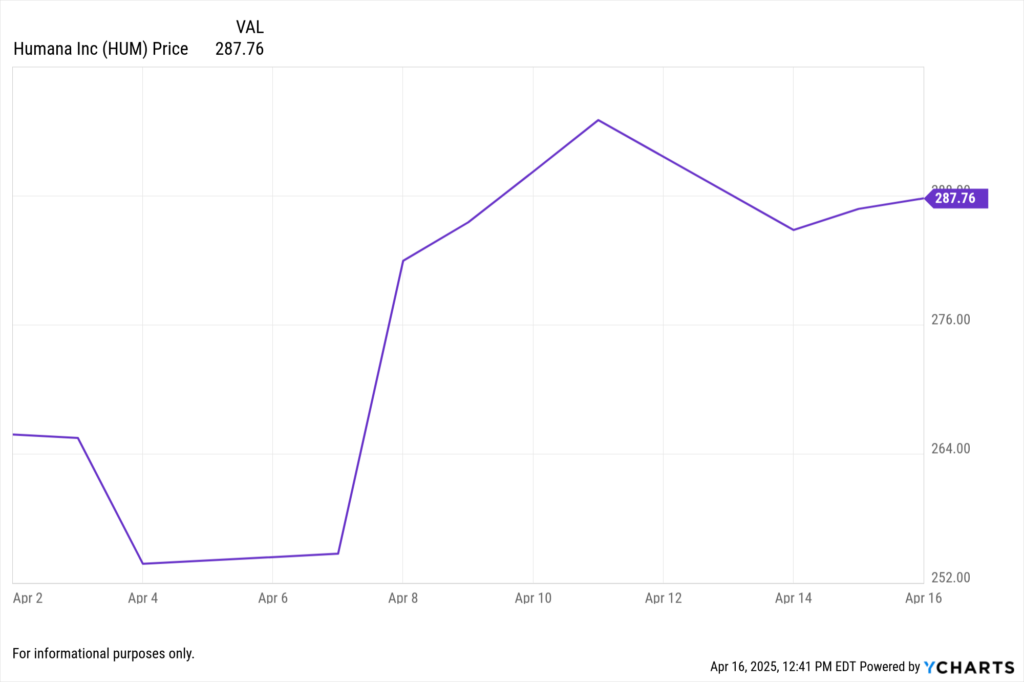
Total Return Since 4/2: +7.89%
Contributing Factors:
Medicare Advantage Payment Increase: The Centers for Medicare & Medicaid Services (CMS) announced a 5.06% average rate hike for Medicare Advantage plans in 2026, more than double the initially proposed 2.2%. This unexpected increase is anticipated to ease financial pressures on insurers, improve profit margins, and positively impact Humana’s Medicare Advantage segment.
Strategic Partnerships and Expansion: Humana’s CenterWell unit partnered with Icon Health to enhance senior musculoskeletal care, and the company is expanding its primary care centers near Walmart locations in four states. These initiatives aim to improve healthcare accessibility for seniors, potentially driving membership growth and strengthening Humana’s position in the value-based care market.
Ross Stores Inc (ROST)
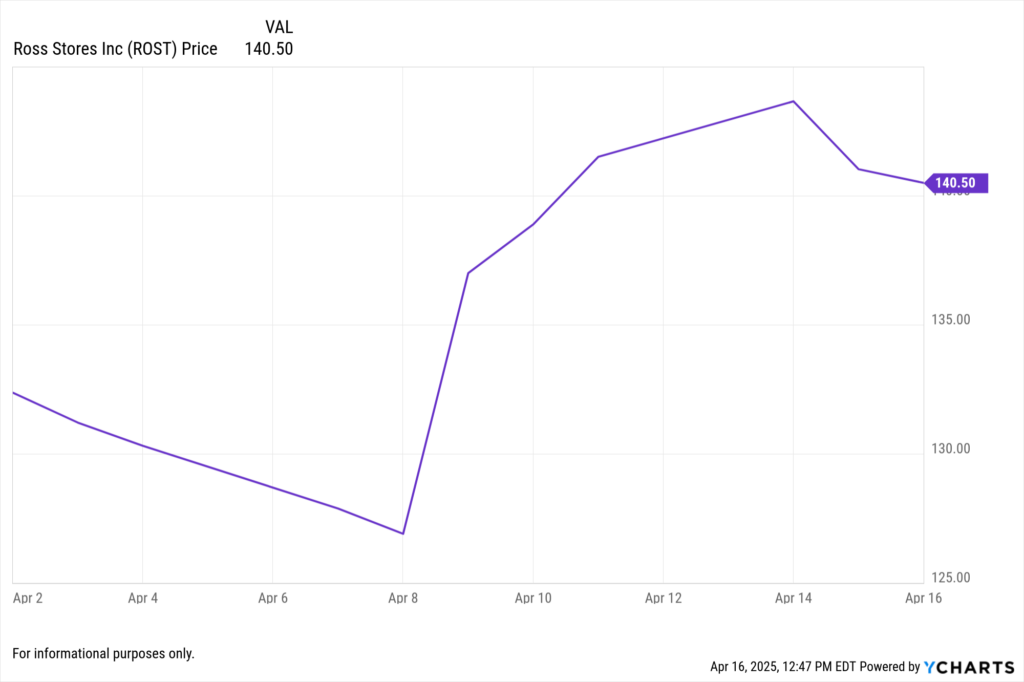
Total Return Since 4/2: +6.54%
Contributing Factors:
Resilience Amid Tariff Impacts: Ross Stores has effectively navigated recent U.S. tariffs on Chinese-made clothing, shoes, and bags by leveraging its sourcing strategy. Unlike retailers that import directly from factories overseas, Ross often acquires merchandise from U.S. middlemen, allowing it to sidestep direct tariff costs. This approach, combined with its flexible buying model and lean inventory management, positions Ross to capitalize on supply chain disruptions and attract cost-conscious consumers seeking affordable alternatives.
Strategic Merchandise Initiatives: Ross Stores’ focus on offering sharply priced branded products has resonated with consumers. The company’s efforts to improve assortments, enhance quality, and provide better value, particularly through its dd’s DISCOUNTS segment, have led to increased customer traffic and a broader demographic reach. These initiatives have contributed to the company’s strong performance and investor confidence.
Notable Mentions – Total Return Winners
Huntington Ingalls Industries Inc. (HII): +6.37%
MarketAxess Holdings Inc. (MKTX): +6.24%
CrowdStrike Holdings Inc. (CRWD): +5.74%
Copart Inc. (CPRT): +5.19%
Walmart Inc. (WMT): +4.69%
What These Winners Reveal About Market Resilience
Together, these five companies—UnitedHealth Group, Newmont Corp, Humana Inc., Palantir Technologies, and Ross Stores—illustrate how strategic positioning, policy tailwinds, and business model resilience can fuel outperformance in volatile markets. From healthcare payers benefiting from Medicare Advantage rate hikes, to gold producers riding the safe-haven rally, and discount retailers capitalizing on tariff dislocations, each has carved out a defensible narrative amid the broader trade-driven uncertainty. Their strength over the past two weeks underscores the value of sector diversification and agile exposure during macroeconomic shocks.
Top 5 Stock Losers Since Tariff Day
APA Corp (APA)
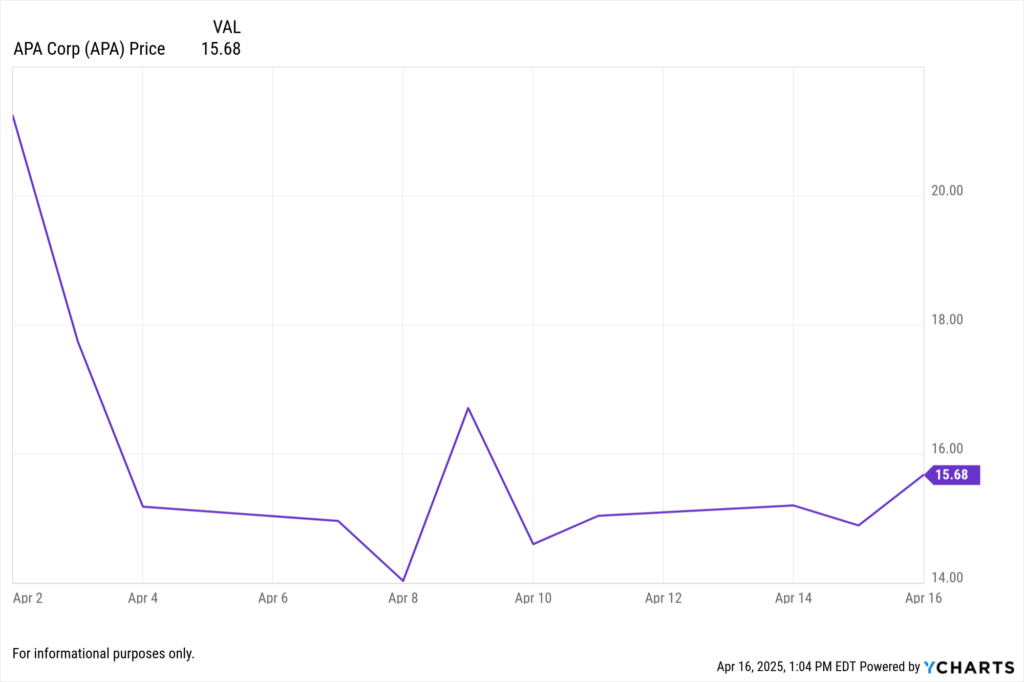
Total Return Since 4/2: -29.9%
Contributing Factors:
Resilience Amid Tariff Impacts: Ross Stores has effectively navigated recent U.S. tariffs on Chinese-made clothing, shoes, and bags by leveraging its sourcing strategy. Unlike retailers that import directly from factories overseas, Ross often acquires merchandise from U.S. middlemen, allowing it to sidestep direct tariff costs. This approach, combined with its flexible buying model and lean inventory management, positions Ross to capitalize on supply chain disruptions and attract cost-conscious consumers seeking affordable alternatives.
Strategic Merchandise Initiatives: Ross Stores’ focus on offering sharply priced branded products has resonated with consumers. The company’s efforts to improve assortments, enhance quality, and provide better value, particularly through its dd’s DISCOUNTS segment, have led to increased customer traffic and a broader demographic reach. These initiatives have contributed to the company’s strong performance and investor confidence.
Charles River Laboratories International Inc (CRL)
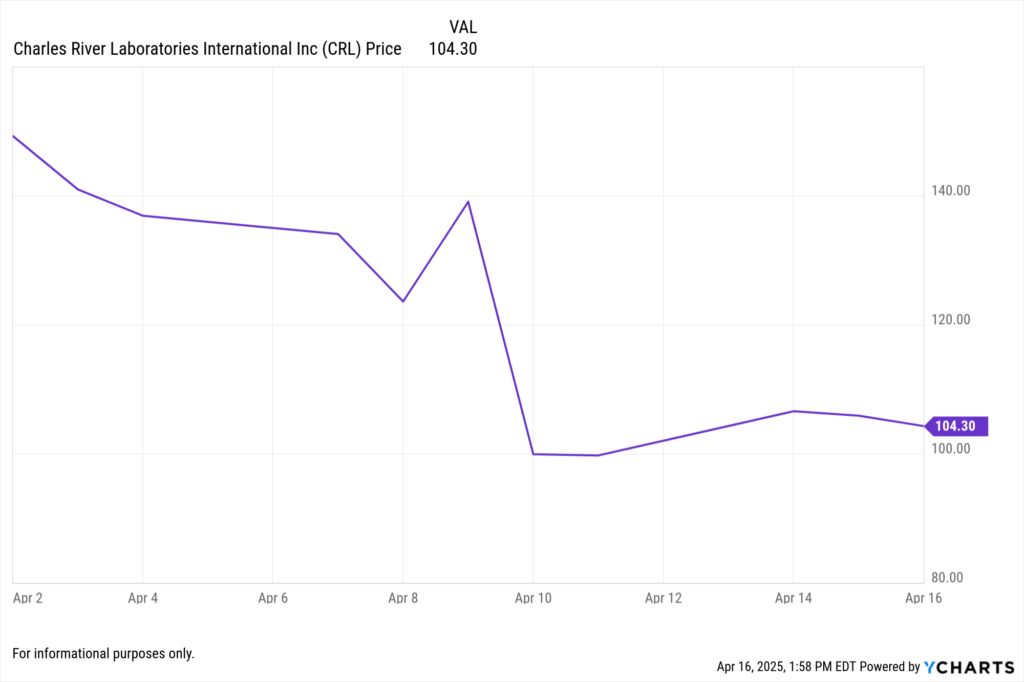
Total Return Since 4/2: -29.05%
Contributing Factors:
Analyst Downgrades Amid Trade Tensions: On April 10, 2025, Charles River Laboratories’ stock plummeted 28.1%, marking the steepest decline among S&P 500 constituents that day. This sharp drop followed a downgrade by Barclays analysts, who expressed concerns that potential pharmaceutical tariffs resulting from escalating U.S.-China trade tensions could strain industry budgets and negatively impact Charles River’s performance. The White House’s confirmation of increased tariffs on Chinese goods to 145% intensified these concerns, leading to a significant sell-off in the stock.
Anticipated Revenue Challenges: Earlier in the year, Charles River Laboratories issued preliminary earnings guidance indicating expectations for full-year organic revenue to decline at a pace similar to the previous year. The company cited stable to slightly improving demand from biotechnology firms but limited demand from large pharmaceutical companies. This outlook raised concerns among investors about the company’s growth prospects, contributing to the downward pressure on its stock.
Albemarle Corp (ALB)
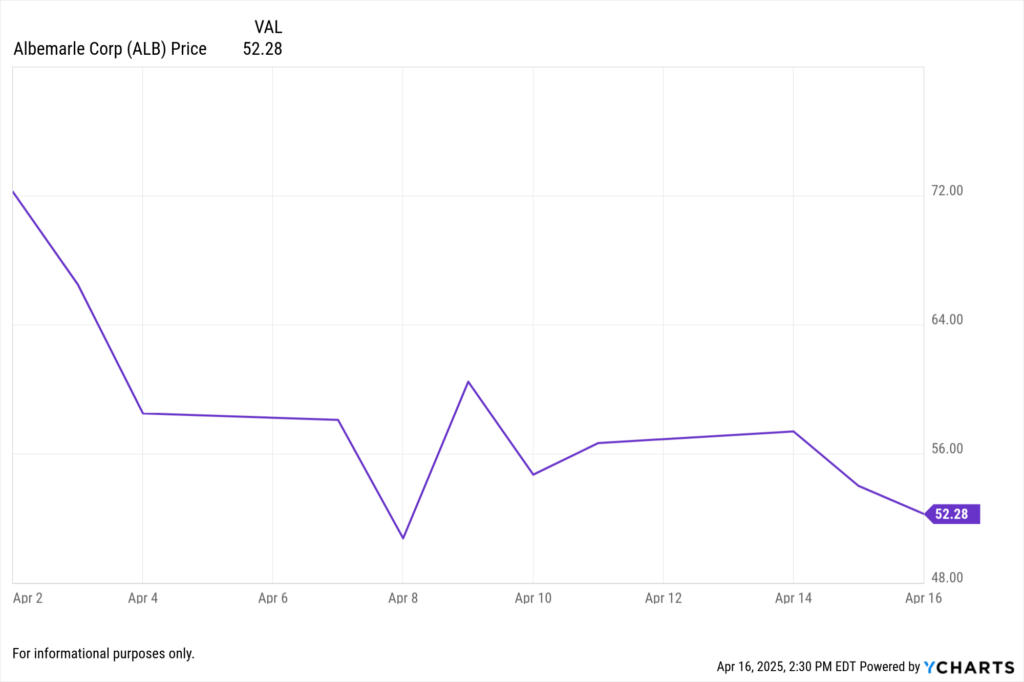
Total Return Since 4/2: -25.25%
Contributing Factors:
Plunging Lithium Prices and Soft EV Demand: Albemarle, as the world’s largest lithium producer, has been significantly impacted by an over 80% drop in lithium prices since their peak in late 2022. This decline is attributed to a global slowdown in electric vehicle (EV) sales and an oversupply of lithium, leading to reduced demand for the mineral crucial for EV batteries. The company’s revenues have suffered, with its Energy Storage segment experiencing a 63% drop in sales due to these market conditions.
Analyst Downgrades Amid Trade Tensions: On April 8, 2025, Albemarle’s stock fell 12.6%, marking the steepest daily decline among S&P 500 constituents. This sharp drop followed a downgrade by UBS analysts, who expressed concerns over rising costs and anticipated weaker demand, particularly in the automotive battery sector. The broader context of escalating trade tensions and potential tariffs further exacerbated investor concerns, leading to a significant sell-off in the stock.
Devon Energy Corp (DVN)

Download visual | View chart
Total Return Since 4/2: -24.76%
Contributing Factors:
Oil Price Decline Amid Trade Tensions: Devon Energy’s stock has been adversely affected by a significant drop in oil prices, which fell from around $71 to $61 per barrel in early April 2025. This decline is attributed to escalating trade tensions between the U.S. and China, raising concerns about a potential global recession and decreased demand for energy products.
Analyst Downgrades Reflecting Market Concerns: On April 14, 2025, the Royal Bank of Canada lowered its price target for Devon Energy from $49 to $40, maintaining a “sector perform” rating. This downgrade reflects apprehensions about the company’s ability to navigate the challenging market conditions, including fluctuating oil prices and trade-related uncertainties.
Stanley Black & Decker Inc (SWK)
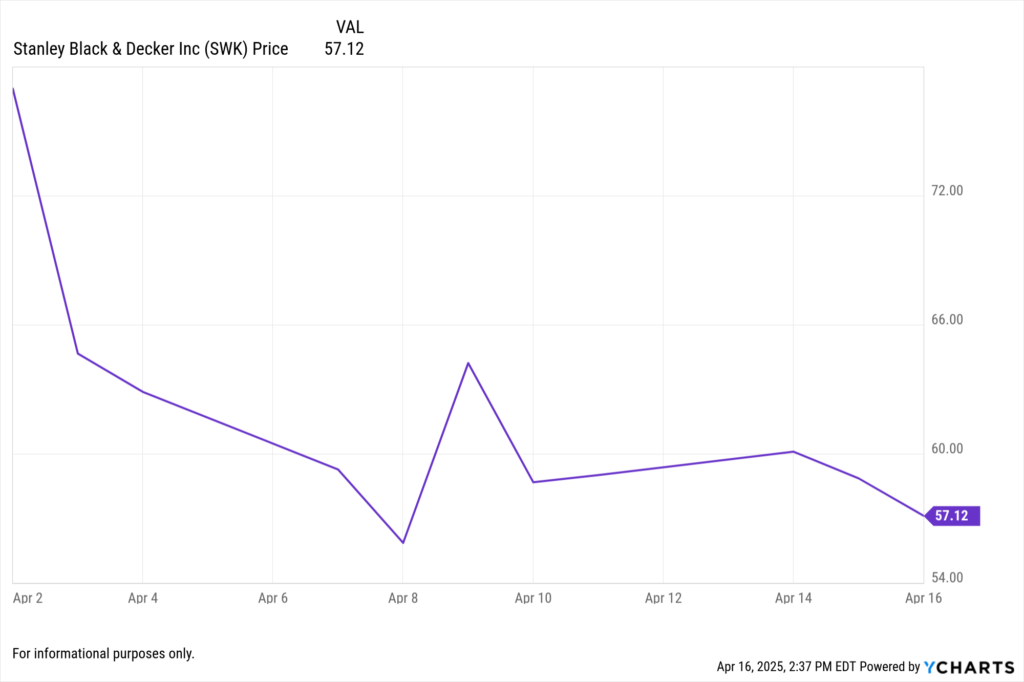
Total Return Since 4/2: -23.54%
Contributing Factors:
Exposure to Tariff-Related Economic Slowdown: The company has significant exposure to the economic impacts of tariffs, particularly as discretionary spending on DIY tools and industrial equipment declines. This vulnerability has been highlighted by recent market reactions to tariff announcements.
Operational Challenges and Financial Concerns: Despite efforts to improve profitability through cost-saving initiatives, Stanley Black & Decker faces persistent softness in the automotive end market and a highly leveraged balance sheet. These factors have raised concerns among investors about the company’s ability to navigate the current economic environment.
Notable Mentions – Total Return Losers
Occidental Petroleum Corp (OXY): -23.37%
Phillips 66 (PSX): -22.45%
Warner Bros. Discovery Inc. (WBD): -21.88%
Diamondback Energy Inc. (FANG): -21.27%
The Estee Lauder Companies Inc. (EL): -20.87%
What These Declines Reveal About Market Vulnerability
From energy and materials to industrials and pharmaceuticals, the most severely impacted stocks since the onset of the April 2025 tariffs share a common thread: exposure to global trade flows, price-sensitive supply chains, or policy-sensitive revenue streams. The steep declines in APA, Charles River Laboratories, Albemarle, Devon Energy, and Stanley Black & Decker reflect how quickly investor sentiment can shift when macroeconomic uncertainty meets operational fragility. These declines are a stark reminder that in tariff-driven markets, fundamentals are only part of the equation—narrative, policy exposure, and sector positioning often move faster. For investors and advisors alike, understanding who’s vulnerable and why is just as important as identifying the winners.
Sectoral Impact Analysis
Healthcare: Emerged as a defensive stronghold, with companies like UnitedHealth and Merck attracting investors seeking stability.
Technology: Experienced mixed outcomes; while Apple benefited from tariff exemptions, broader tech indices remained volatile due to supply chain concerns.
Automotive: Suffered significantly, with manufacturers like GM and Ford facing increased costs and supply chain disruptions.
Energy: Declined sharply as global trade tensions raised fears over demand and export challenges.
Consumer Goods: Companies reliant on imported goods, such as Constellation Brands, faced profitability pressures due to increased tariffs.
Investor Sentiment and Market Dynamics
The rapid policy shifts and tariff announcements led to heightened market uncertainty. Investors grappled with the unpredictability of trade policies, leading to increased volatility and cautious investment strategies. Defensive sectors gained favor, while industries with significant international exposure faced sell-offs. The market’s sensitivity to policy announcements underscored the need for agile investment approaches in the face of geopolitical developments.
Conclusion
The April 2025 tariffs have reshaped the investment landscape, creating clear delineations between sectors and companies based on their exposure to international trade. While some stocks have demonstrated resilience or even thrived, others have faced substantial challenges.
Whenever you’re ready, here’s how YCharts can help you:
1. Looking to Move On From Your Investment Research and Analytics Platform?
2. Want to test out YCharts for free?
Start a no-risk 7-Day Free Trial.
Disclaimer
©2025 YCharts, Inc. All Rights Reserved. YCharts, Inc. (“YCharts”) is not registered with the U.S. Securities and Exchange Commission (or with the securities regulatory authority or body of any state or any other jurisdiction) as an investment adviser, broker-dealer or in any other capacity, and does not purport to provide investment advice or make investment recommendations. This report has been generated through application of the analytical tools and data provided through ycharts.com and is intended solely to assist you or your investment or other adviser(s) in conducting investment research. You should not construe this report as an offer to buy or sell, as a solicitation of an offer to buy or sell, or as a recommendation to buy, sell, hold or trade, any security or other financial instrument. For further information regarding your use of this report, please go to: ycharts.com/about/disclosure
Next Article
After the Storm: How Active Bond ETFs Weathered Recent VolatilityRead More →