The 10 Best Performing Value ETFs over the Last 10 Years

In August, value ETFs attracted more assets than their growth counterparts as investors allocated to more defensive sectors either due to recessionary fears or concerns that it might be a late-stage bull market and they’re diversifying ahead of it due to a recalibration of monetary policy.
When discussing the former, the Fed’s decision to cut interest rates by 50bps was prompted by inflation falling and to provide insurance to the employment market, which, as FOMC Chair Jerome Powell stated, “the downside risks to employment have increased,” such as rising unemployment rate, and significant downward revisions to nonfarm payrolls.
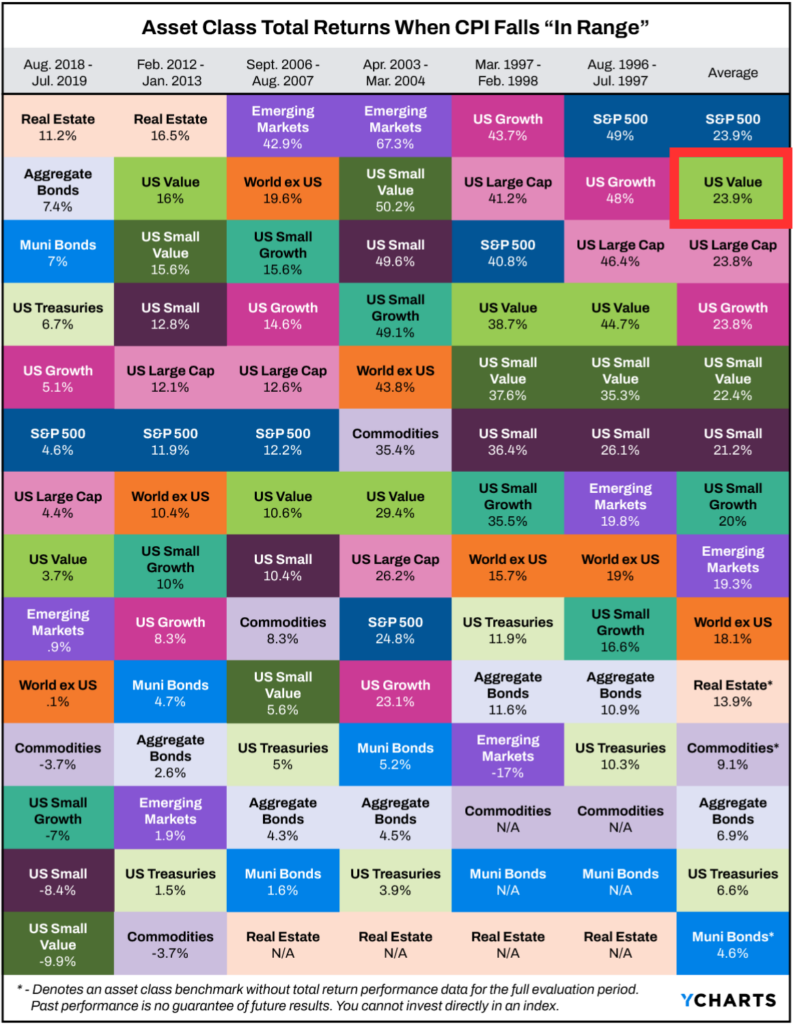
If the Fed has brought inflation under control, investors and consumers will want to see that maintained for longer than a month. In our most recent white paper, “Which Asset Classes Perform Best When Inflation Is Driven Lower,” we discovered that equities tend to perform quite well when price stability is sustained. Specifically, large-cap value stocks were the second best-performing asset class on average in these scenarios.
Get your copy of “Which Asset Classes Perform Best As Inflation is Driven Lower” here:
During the evaluation periods, both small—and large-cap value stocks produced average returns of over 20%. As such, we comprised a list of the best-performing value ETFs on a 1, 3, 5, 10, and year-to-date basis (excluding leveraged and inverse value ETFs). In addition, we examined which of these strategies had the lowest maximum drawdowns during those periods to determine their effectiveness in mitigating losses.
Click to jump to a section:
- Best-Performing Value ETFs YTD
- Best-Performing Value ETFs over the Last Year
- Value ETFs with the Lowest Drawdown in the Last Year
- Best-Performing Value ETFs in the Last 3 Years
- Value ETFs with the Lowest Drawdown in the Last 3 Years
- Best-Performing Value ETFs in the Last 5 Years
- Value ETFs with the Lowest Drawdown in the Last 5 Years
- Best-Performing Value ETFs in the Last 10 Years
- Value ETFs with the Lowest Drawdown in the Last 10 Years
- What Was the Growth of $10,000 Over the Last 10 Years?
Best Performing Value ETFs YTD
These are the best-performing value ETFs year-to-date in 2024, as of September 30, 2024.
View & Modify in Fund Screener

Download Visual | Modify in YCharts
Best-Performing Value ETFs over the Last Year
These are the best-performing value ETFs over the past year as of September 30, 2024.
View & Modify in Fund Screener

Download Visual | Modify in YCharts
Value ETFs with the Lowest Drawdown in the Last Year
These value ETFs had the lowest drawdown over the past year as of September 30, 2024.
View & Modify in Fund Screener

Download Visual | Modify in YCharts
Best Performing Value ETFs in the Last 3 Years
View & Modify in Fund Screener

Download Visual | Modify in YCharts
Value ETFs with the Lowest Drawdown in the Last 3 Years
These value ETFs had the lowest drawdown between September 30, 2021 and September 30, 2024.
View & Modify in Fund Screener

Download Visual | Modify in YCharts
Best Performing Value ETFs in the Last 5 Years
These are the best-performing value ETFs on an annualized basis between September 30, 2019 and September 30, 2024.
View & Modify in Fund Screener

Download Visual | Modify in YCharts
Value ETFs with the Lowest Drawdown in the Last 5 Years
These value ETFs had the lowest drawdown between September 30, 2019 and September 30, 2024.
View & Modify in Fund Screener

Download Visual | Modify in YCharts
Best Performing Value ETFs in the Last 10 Years
These are the best-performing value ETFs on an annualized basis between September 30, 2014 and July 29, 2024.
View & Modify in Fund Screener

Download Visual | Modify in YCharts
Value ETFs with the Lowest Drawdown in the Last 10 Years
These value ETFs had the lowest drawdown between September 30, 2014 and September 30, 2024.
View & Modify in Fund Screener

Download Visual | Modify in YCharts
What Was the Growth of $10,000 Over the Last 10 Years?
If you invested $10,000 10 years ago into any of the ten best-performing value ETFs over the last 10 years, your balance today would be no less than $30K.
The best-performing value ETF over the past decade was First Trust Rising Dividend Achievers ETF (RDVY). A $10,000 investment into RDVY 10 years ago would be worth over $33K today. Right behind it was the Invesco S&P 100 Equal Weight ETF (EQWL); investing $10,000 into EQWL back in 2014 would’ve turned into over $32K.

Download Visual | Modify in YCharts
Whenever you’re ready, there are 3 ways YCharts can help you:
Interested in doing further ETF research with YCharts?
Email us at hello@ycharts.com or call (866) 965-7552. You’ll get a response from one of our Chicago-based team members.
Want to test out YCharts for free?
Start a no-risk 7-Day Free Trial.
Want to know which Asset Classes Perform Best When Inflation is Driven Lower? Download our latest piece of research on the subject:
Get your copy of “Which Asset Classes Perform Best As Inflation is Driven Lower” here:Disclaimer
©2024 YCharts, Inc. All Rights Reserved. YCharts, Inc. (“YCharts”) is not registered with the U.S. Securities and Exchange Commission (or with the securities regulatory authority or body of any state or any other jurisdiction) as an investment adviser, broker-dealer or in any other capacity, and does not purport to provide investment advice or make investment recommendations. This report has been generated through application of the analytical tools and data provided through ycharts.com and is intended solely to assist you or your investment or other adviser(s) in conducting investment research. You should not construe this report as an offer to buy or sell, as a solicitation of an offer to buy or sell, or as a recommendation to buy, sell, hold or trade, any security or other financial instrument. For further information regarding your use of this report, please go to: ycharts.com/about/disclosure
Next Article
What Happens After A Fed Rate Cut?Read More →
