The Best Performing Bond Mutual Funds over the Last 10 Years
Updated as of: November 10, 2025
This article contains the best-performing bond mutual funds from the last year all the way back to the past decade, with data routinely updated by YCharts.
To create this list, we analyzed the entire mutual fund universe using the YCharts Fund Screener to find the best-performing US-domiciled fixed income mutual funds on a 1-year, 3-year, 5-year, and 10-year basis. (Funds with leveraged or inverse attributes as well as those in the alternative currency strategy and options arbitrage strategy peer groups were excluded to focus on long-term investment vehicles that align with broader financial planning goals).
Table of Contents
Best Performing Bond Mutual Funds in the Last Year
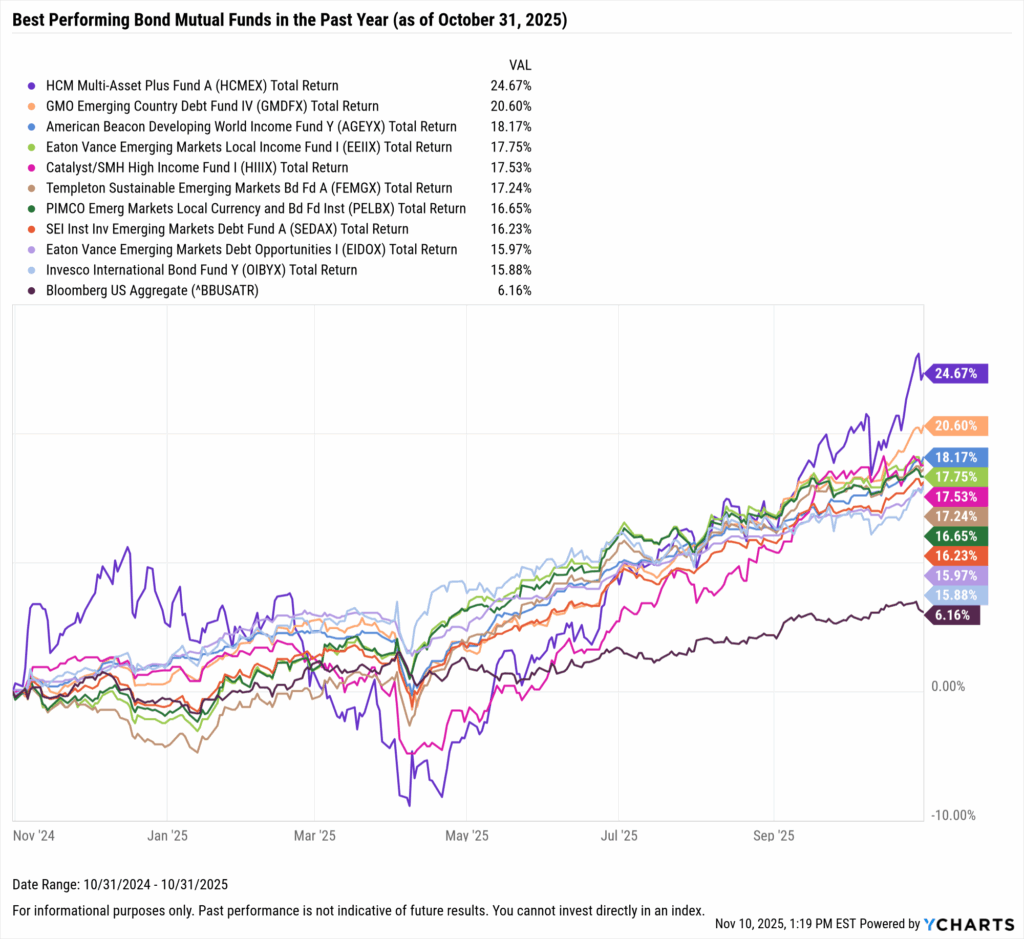
These are the top-performing bond mutual funds over the past year, as of October 31, 2025.
| Symbol | Name | 1 Year Total Returns (Monthly) | Yield to Maturity | Effective Duration | Effective Maturity | Net Expense Ratio | Share Class Assets Under Management | Peer Group Name |
|---|---|---|---|---|---|---|---|---|
| HCMEX | HCM Multi-Asset Plus Fund A | 24.67% | 4.28% | 5.87 | 8.13 | 1.64% | $496,096,635 | Flexible Income Funds |
| GMDFX | GMO Emerging Country Debt Fund IV | 20.60% | 8.70% | N/A | 16.08 | 0.56% | $1,424,115,270 | Emerging Mrkts Hard Currency Debt Funds |
| AGEYX | American Beacon Developing World Income Fund Y | 18.17% | N/A | N/A | N/A | 1.14% | $1,045,356,206 | Emerging Mrkts Hard Currency Debt Funds |
| EEIIX | Eaton Vance Emerging Markets Local Income Fund I | 17.75% | N/A | N/A | 0.00 | 1.01% | $1,129,278,631 | Emerging Markets Local Currency Debt Fds |
| HIIIX | Catalyst/SMH High Income Fund I | 17.53% | N/A | N/A | N/A | 1.23% | $35,014,633 | High Yield Funds |
| FEMGX | Templeton Sustainable Emerging Markets Bd Fd A | 17.24% | 10.84% | 4.69 | 6.55 | 1.16% | $11,037,517 | Emerging Markets Local Currency Debt Fds |
| PELBX | PIMCO Emerg Markets Local Currency and Bd Fd Inst | 16.65% | 8.17% | 6.43 | 8.38 | 1.60% | $2,194,292,374 | Emerging Markets Local Currency Debt Fds |
| SEDAX | SEI Inst Inv Emerging Markets Debt Fund A | 16.23% | 7.30% | 5.91 | 10.31 | 0.44% | $1,750,457,884 | Emerging Mrkts Hard Currency Debt Funds |
| EIDOX | Eaton Vance Emerging Markets Debt Opportunities I | 15.97% | N/A | N/A | 0.00 | 0.81% | $3,203,660,989 | Emerging Markets Local Currency Debt Fds |
| OIBYX | Invesco International Bond Fund Y | 15.88% | 3.77% | 3.09 | 7.33 | 0.79% | $617,592,740 | International Income Funds |
Start a Free Trial to See Full Rankings | View & Modify in Fund Screener
Download Visual | Modify in YCharts
Best Performing Bond Mutual Funds in the Last 3 Years
These are the top-performing bond mutual funds on an annualized basis between November 1st, 2022 and October 31, 2025.
| Symbol | Name | 3 Year Total Returns (Monthly) | Annualized 3 Year Total Returns (Monthly) | Yield to Maturity | Effective Duration | Effective Maturity | Net Expense Ratio | Share Class Assets Under Management | Peer Group Name |
|---|---|---|---|---|---|---|---|---|---|
| GMDFX | GMO Emerging Country Debt Fund IV | 75.42% | 20.60% | 8.70% | N/A | 16.08 | 0.56% | $1,424,115,270 | Emerging Mrkts Hard Currency Debt Funds |
| HCMEX | HCM Multi-Asset Plus Fund A | 70.61% | 19.49% | 4.28% | 5.87 | 8.13 | 1.64% | $496,096,635 | Flexible Income Funds |
| AGEYX | American Beacon Developing World Income Fund Y | 63.98% | 17.92% | N/A | N/A | N/A | 1.14% | $1,045,356,206 | Emerging Mrkts Hard Currency Debt Funds |
| SHRIX | Stone Ridge Hi Yld Reinsurance Risk PrmI | 62.42% | 17.55% | N/A | N/A | N/A | 1.76% | $3,912,976,755 | N/A |
| FEMDX | Franklin Emerg Market Debt Opptys Fund | 57.85% | 16.43% | 9.69% | 4.48 | 7.52 | 1.02% | $131,311,593 | Emerging Mrkts Hard Currency Debt Funds |
| EIDOX | Eaton Vance Emerging Markets Debt Opportunities I | 57.29% | 16.30% | N/A | N/A | 0 | 0.81% | $3,203,660,989 | Emerging Markets Local Currency Debt Fds |
| SCEMX | DWS Emerging Markets Fixed Inc S | 57.22% | 16.28% | N/A | 4.93 | 6.38 | 0.91% | $33,612,933 | Emerging Mrkts Hard Currency Debt Funds |
| SHMDX | Virtus Stone Harbor Emerging Markets Debt Income I | 56.47% | 16.09% | 7.04% | 6.43 | 10.73 | 0.74% | $292,986,458 | Emerging Mrkts Hard Currency Debt Funds |
| WEDIX | William Blair Emerging Markets Debt Fund I | 55.52% | 15.86% | 9.23% | N/A | N/A | 0.70% | $37,311,446 | Emerging Mrkts Hard Currency Debt Funds |
| TREZX | T Rowe Price Emerging Markets Bond Fund Z | 53.59% | 15.38% | N/A | 6.76 | 10.06 | 0.00% | $2,985,986,787 | Emerging Mrkts Hard Currency Debt Funds |
Start a Free Trial to See Full Rankings | View & Modify in Fund Screener

Download Visual | Modify in YCharts
Best Performing Bond Mutual Funds in the Last 5 Years
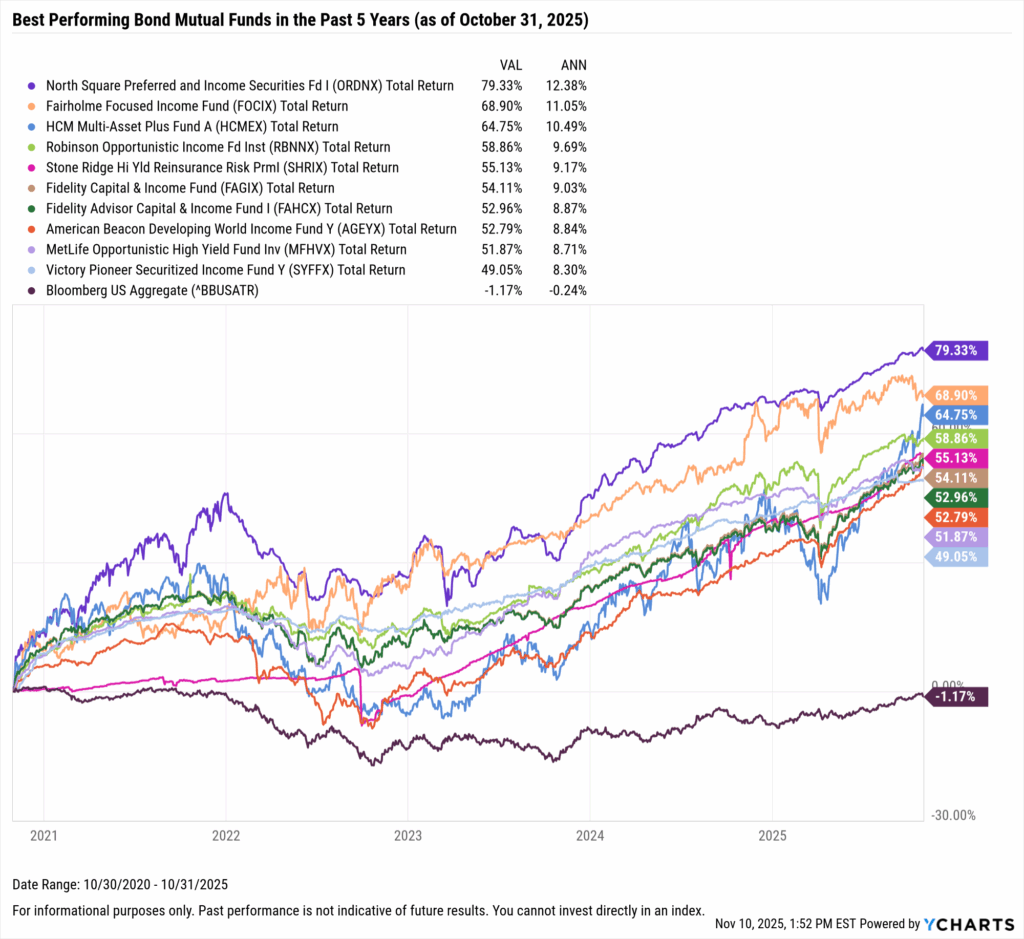
These are the top-performing bond mutual funds on an annualized basis between November 1, 2020 and October 31, 2025.
| Symbol | Name | 5 Year Total Returns (Monthly) | Annualized 5 Year Total Returns (Monthly) | Yield to Maturity | Effective Duration | Effective Maturity | Net Expense Ratio | Share Class Assets Under Management | Peer Group Name |
|---|---|---|---|---|---|---|---|---|---|
| ORDNX | North Square Preferred and Income Securities Fd I | 79.33% | 12.39% | 6.79% | 4.08 | 6.74 | 0.97% | $348,434,891 | Flexible Income Funds |
| FOCIX | Fairholme Focused Income Fund | 68.90% | 11.05% | N/A | N/A | N/A | 1.01% | $206,325,549 | Flexible Income Funds |
| HCMEX | HCM Multi-Asset Plus Fund A | 64.75% | 10.50% | 4.28% | 5.87 | 8.13 | 1.64% | $496,096,635 | Flexible Income Funds |
| RBNNX | Robinson Opportunistic Income Fd Inst | 58.86% | 9.70% | 4.87% | 4.97 | 9.11 | 2.85% | $10,807,814 | Alternative Credit Focus Funds |
| SHRIX | Stone Ridge Hi Yld Reinsurance Risk PrmI | 55.13% | 9.18% | N/A | N/A | N/A | 1.76% | $3,912,976,755 | N/A |
| FAGIX | Fidelity Capital & Income Fund | 54.11% | 9.03% | N/A | N/A | 5.00 | 0.90% | $14,759,997,579 | High Yield Funds |
| FAHCX | Fidelity Advisor Capital & Income Fund I | 52.96% | 8.87% | N/A | N/A | N/A | 0.96% | $1,215,523,220 | High Yield Funds |
| AGEYX | American Beacon Developing World Income Fund Y | 52.79% | 8.85% | N/A | N/A | N/A | 1.14% | $1,045,356,206 | Emerging Mrkts Hard Currency Debt Funds |
| MFHVX | MetLife Opportunistic High Yield Fund Inv | 51.87% | 8.72% | N/A | N/A | 4.20 | 1.00% | $23,939,086 | High Yield Funds |
| SYFFX | Victory Pioneer Securitized Income Fund Y | 49.05% | 8.31% | 6.50% | 1.66 | 2.79 | 0.65% | $278,114,588 | U.S. Mortgage Funds |
Start a Free Trial to See Full Rankings | View & Modify in Fund Screener
Download Visual | Modify in YCharts
Best Performing Bond Mutual Funds in the Last 10 Years
These are the top-performing bond mutual funds on an annualized basis between November 1, 2015 and October 31, 2025.
| Symbol | Name | 10 Year Total Returns (Monthly) | Annualized 10 Year Total Returns (Monthly) | Yield to Maturity | Effective Duration | Effective Maturity | Net Expense Ratio | Share Class Assets Under Management | Peer Group Name |
|---|---|---|---|---|---|---|---|---|---|
| ORDNX | North Square Preferred and Income Securities Fd I | 196.58% | 11.48% | 6.79% | 4.08 | 6.74 | 0.97% | $348,434,891 | Flexible Income Funds |
| HIIIX | Catalyst/SMH High Income Fund I | 127.71% | 8.58% | N/A | N/A | N/A | 1.23% | $35,014,633 | High Yield Funds |
| EIDOX | Eaton Vance Emerging Markets Debt Opportunities I | 110.18% | 7.71% | N/A | N/A | 0.00 | 0.81% | $3,203,660,989 | Emerging Markets Local Currency Debt Fds |
| FAGIX | Fidelity Capital & Income Fund | 107.06% | 7.55% | N/A | N/A | 5.00 | 0.90% | $14,759,997,579 | High Yield Funds |
| FAHCX | Fidelity Advisor Capital & Income Fund I | 105.34% | 7.46% | N/A | N/A | N/A | 0.96% | $1,215,523,220 | High Yield Funds |
| AGEYX | American Beacon Developing World Income Fund Y | 101.66% | 7.27% | N/A | N/A | N/A | 1.14% | $1,045,356,206 | Emerging Mrkts Hard Currency Debt Funds |
| APDFX | Artisan High Income Fund Advisor | 94.80% | 6.90% | 7.64% | 2.22 | N/A | 0.80% | $3,707,950,742 | High Yield Funds |
| GMDFX | GMO Emerging Country Debt Fund IV | 92.88% | 6.79% | 8.70% | N/A | 16.08 | 0.56% | $1,424,115,270 | Emerging Mrkts Hard Currency Debt Funds |
| MNHAX | Manning & Napier High Yield Bond Series I | 92.52% | 6.77% | N/A | 3.13 | 4.37 | 0.59% | $1,137,229,847 | High Yield Funds |
| SHOYX | American Beacon SiM High Yield Opportunities Y | 90.24% | 6.64% | N/A | N/A | N/A | 0.75% | $1,553,924,756 | Global High Yield Funds |
Start a Free Trial to See Full Rankings | View & Modify in Fund Screener

Download Visual | Modify in YCharts
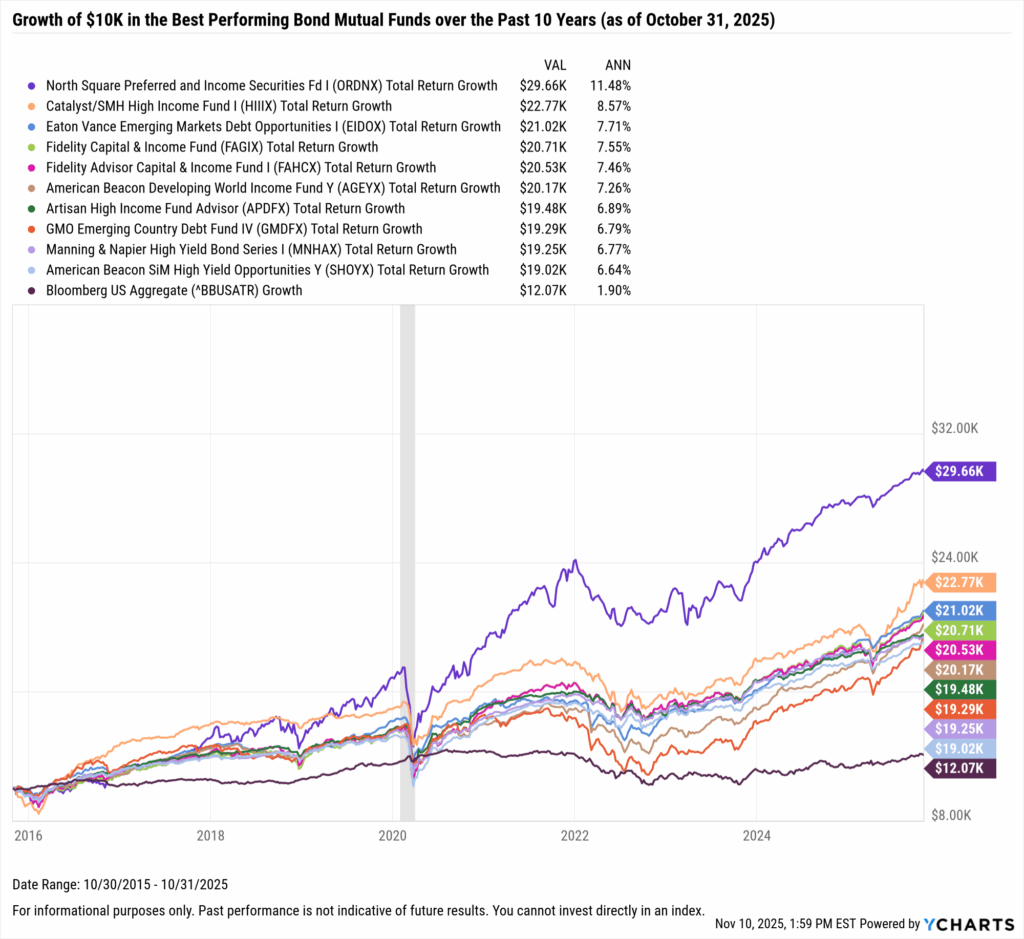
What Was the Growth of $10,000 in the Top Bond Mutual Funds Over the Last 10 Years?
The best-performing bond mutual fund in the last 10 years was the North Square Preferred and Income Securities Fd I fund (ORDNX). A $10,000 investment into ORDNX 10 years ago would be worth $29,660 today on a total return basis. Right behind it was the Catalyst/SMH High Income Fund I (HIIIX); investing $10,000 into this Catalyst/SMH fund back in 2015 would’ve turned into a little over $22K with dividend reinvestment.
However, investing $10,000 into a benchmark bond index such as the Bloomberg US Aggregate index netted a total return of just 20% over the last ten years, or 1.9% on an annualized basis. Investing in one of these broad bond indexes was not enough to beat inflation over the last decade.
Download Visual | Modify in YCharts
Whenever you’re ready, here’s how YCharts can help you:
1. Interested in doing further mutual fund research with YCharts?
2. Want to test out YCharts for free?
Start a no-risk 7-Day Free Trial.
3. Sign up for a copy of our Fund Flows Report and Visual Deck to stay on top of mutual fund trends:
Sign up to recieve a copy of our monthly Fund Flows Report:Disclaimer
©2025 YCharts, Inc. All Rights Reserved. YCharts, Inc. (“YCharts”) is not registered with the U.S. Securities and Exchange Commission (or with the securities regulatory authority or body of any state or any other jurisdiction) as an investment adviser, broker-dealer or in any other capacity, and does not purport to provide investment advice or make investment recommendations. This report has been generated through application of the analytical tools and data provided through ycharts.com and is intended solely to assist you or your investment or other adviser(s) in conducting investment research. You should not construe this report as an offer to buy or sell, as a solicitation of an offer to buy or sell, or as a recommendation to buy, sell, hold or trade, any security or other financial instrument. For further information regarding your use of this report, please go to: ycharts.com/about/disclosure.
Next Article
The Best Performing Bond ETFs over the Last 10 YearsRead More →