The Best Performing Bond Mutual Funds over the Last 10 Years
Updated as of: July 8, 2026
This article contains the best-performing bond mutual funds from the last year all the way back to the past decade, with data routinely updated by YCharts.
To create this list, we analyzed the entire mutual fund universe using the YCharts Fund Screener to find the best-performing US-domiciled fixed income mutual funds on a 1-year, 3-year, 5-year, and 10-year basis. (Funds with leveraged or inverse attributes as well as those in the alternative currency strategy and options arbitrage strategy peer groups were excluded to focus on long-term investment vehicles that align with broader financial planning goals).
Table of Contents
Looking for lists of the best-performing bond ETFs? Check out our Best-Performing Bond ETFs analysis here.
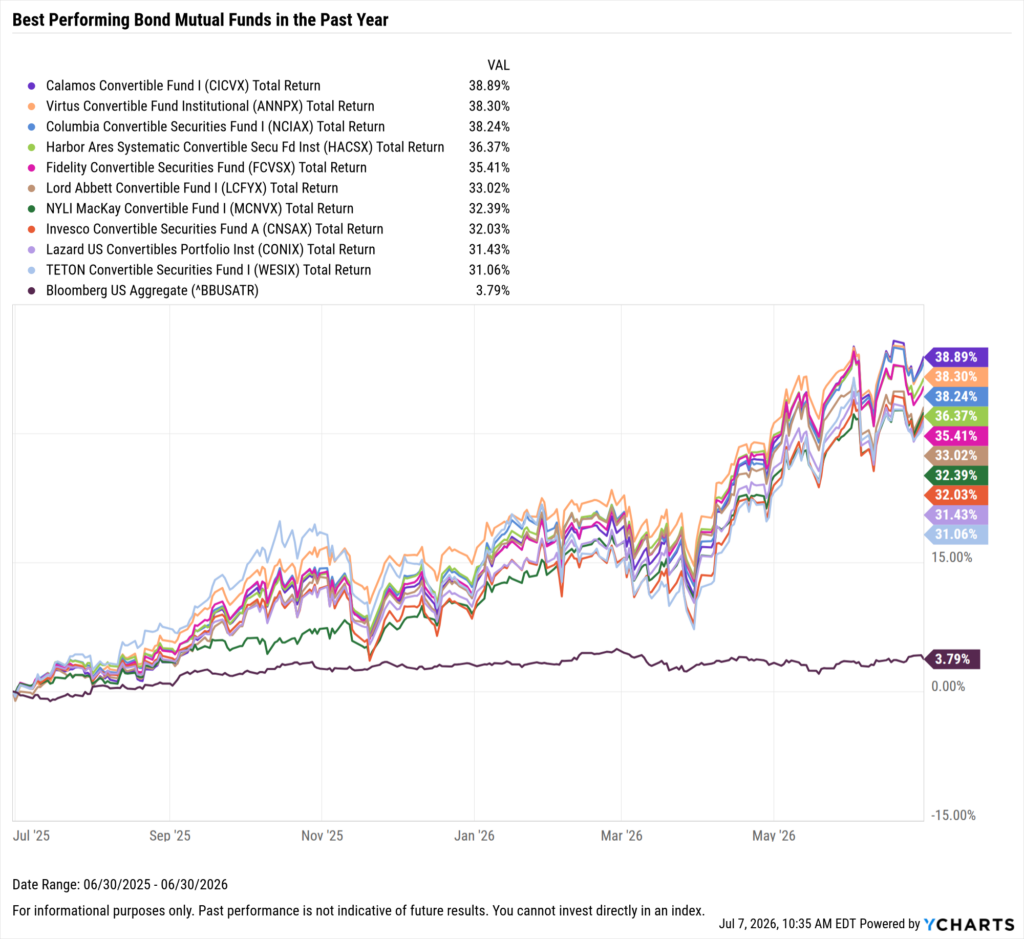
Best Performing Bond Mutual Funds in the Last Year
These are the top-performing bond mutual funds over the past year, as of June 30, 2026.
| Symbol | Name | 1 Year Total Returns (Monthly) | Yield to Maturity | Effective Duration | Effective Maturity | Net Expense Ratio | Share Class Assets Under Management | Peer Group Name |
|---|---|---|---|---|---|---|---|---|
| CICVX | Calamos Convertible Fund I | 38.89% | N/A | 1.62 | 3.84 | 0.89% | $818,120,000 | Convertible Securities Funds |
| ANNPX | Virtus Convertible Fund Institutional | 38.30% | N/A | N/A | N/A | 0.71% | $1,388,744,693 | Convertible Securities Funds |
| NCIAX | Columbia Convertible Securities Fund I | 38.24% | N/A | N/A | N/A | 0.84% | $810,049,186 | Convertible Securities Funds |
| HACSX | Harbor Ares Systematic Convertible Secu Fd Inst | 36.37% | -1.22% | N/A | N/A | 0.71% | $22,740,201 | Convertible Securities Funds |
| FCVSX | Fidelity Convertible Securities Fund | 35.41% | N/A | N/A | N/A | 0.64% | $2,253,431,007 | Convertible Securities Funds |
| LCFYX | Lord Abbett Convertible Fund I | 33.02% | 4.01% | 0.01 | 0 | 0.90% | $416,007,624 | Convertible Securities Funds |
| MCNVX | NYLI MacKay Convertible Fund I | 32.39% | N/A | 2.80 | N/A | 0.61% | $997,422,000 | Convertible Securities Funds |
| CNSAX | Invesco Convertible Securities Fund A | 32.03% | N/A | N/A | N/A | 0.96% | $509,127,380 | Convertible Securities Funds |
| CONIX | Lazard US Convertibles Portfolio Inst | 31.43% | N/A | N/A | N/A | 0.75% | $18,492,399 | Convertible Securities Funds |
| WESIX | TETON Convertible Securities Fund I | 31.06% | N/A | N/A | N/A | 0.91% | $5,965,293 | Convertible Securities Funds |
Start a Free Trial to See Full Rankings | View & Modify in Fund Screener
Download Visual | Modify in YCharts
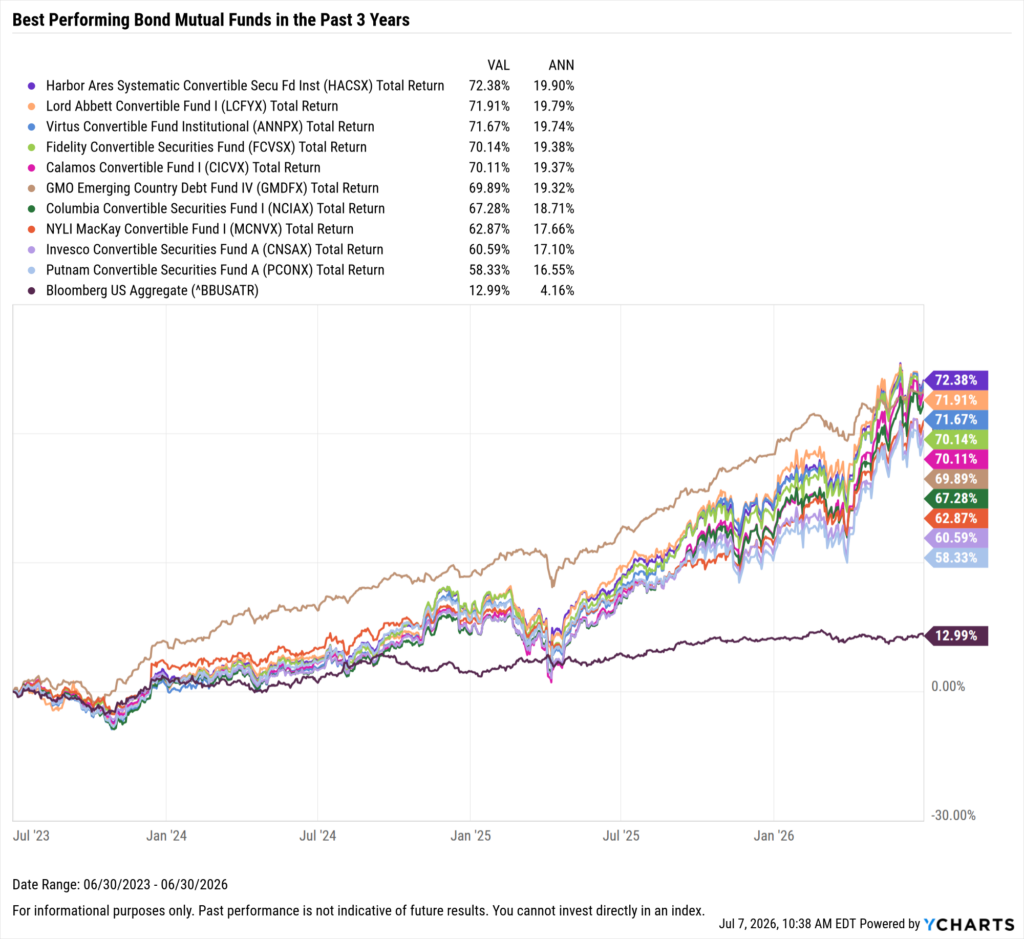
Best Performing Bond Mutual Funds in the Last 3 Years
These are the top-performing bond mutual funds on an annualized basis between July 1st, 2023 and June 30, 2026.
| Symbol | Name | 3 Year Total Returns (Monthly) | Annualized 3 Year Total Returns (Monthly) | Yield to Maturity | Effective Duration | Effective Maturity | Net Expense Ratio | Share Class Assets Under Management | Peer Group Name |
|---|---|---|---|---|---|---|---|---|---|
| HACSX | Harbor Ares Systematic Convertible Secu Fd Inst | 72.38% | 19.90% | -1.22% | N/A | N/A | 0.71% | $22,740,201 | Convertible Securities Funds |
| LCFYX | Lord Abbett Convertible Fund I | 71.91% | 19.79% | 4.01% | 0.01 | 0 | 0.90% | $416,007,624 | Convertible Securities Funds |
| ANNPX | Virtus Convertible Fund Institutional | 71.67% | 19.74% | N/A | N/A | N/A | 0.71% | $1,388,744,693 | Convertible Securities Funds |
| FCVSX | Fidelity Convertible Securities Fund | 70.14% | 19.38% | N/A | N/A | N/A | 0.64% | $2,253,431,007 | Convertible Securities Funds |
| CICVX | Calamos Convertible Fund I | 70.11% | 19.37% | N/A | 1.62 | 3.84 | 0.89% | $818,120,000 | Convertible Securities Funds |
| GMDFX | GMO Emerging Country Debt Fund IV | 69.89% | 19.32% | 8.03% | N/A | 15.79 | 0.57% | $1,380,095,337 | Emerging Mrkts Hard Currency Debt Funds |
| NCIAX | Columbia Convertible Securities Fund I | 67.28% | 18.71% | N/A | N/A | N/A | 0.84% | $810,049,186 | Convertible Securities Funds |
| MCNVX | NYLI MacKay Convertible Fund I | 62.87% | 17.66% | N/A | 2.80 | N/A | 0.61% | $997,422,000 | Convertible Securities Funds |
| CNSAX | Invesco Convertible Securities Fund A | 60.59% | 17.10% | N/A | N/A | N/A | 0.96% | $509,127,380 | Convertible Securities Funds |
| PCONX | Putnam Convertible Securities Fund A | 58.33% | 16.55% | -5.22% | 1.23 | N/A | 1.01% | $403,927,247 | Convertible Securities Funds |
Start a Free Trial to See Full Rankings | View & Modify in Fund Screener
Download Visual | Modify in YCharts
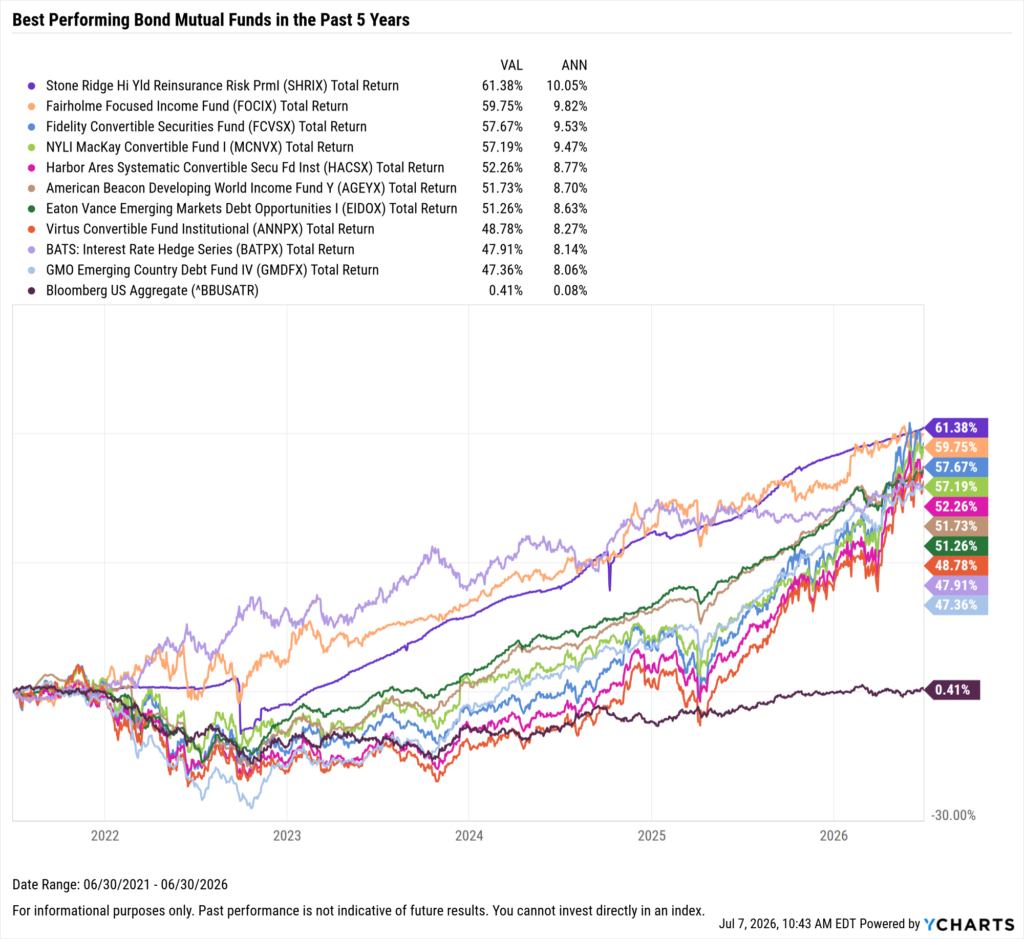
Best Performing Bond Mutual Funds in the Last 5 Years
These are the top-performing bond mutual funds on an annualized basis between July 1, 2021 and June 30, 2026.
| Symbol | Name | 5 Year Total Returns (Monthly) | Annualized 5 Year Total Returns (Monthly) | Yield to Maturity | Effective Duration | Effective Maturity | Net Expense Ratio | Share Class Assets Under Management | Peer Group Name |
|---|---|---|---|---|---|---|---|---|---|
| SHRIX | Stone Ridge Hi Yld Reinsurance Risk PrmI | 61.38% | 10.05% | N/A | N/A | N/A | 1.73% | $4,540,004,682.81 | N/A |
| FOCIX | Fairholme Focused Income Fund | 59.75% | 9.82% | N/A | N/A | N/A | 1.01% | $220,968,504.00 | Flexible Income Funds |
| FCVSX | Fidelity Convertible Securities Fund | 57.67% | 9.53% | N/A | N/A | N/A | 0.64% | $2,253,431,007.00 | Convertible Securities Funds |
| MCNVX | NYLI MacKay Convertible Fund I | 57.19% | 9.47% | N/A | 2.80 | N/A | 0.61% | $997,422,000.00 | Convertible Securities Funds |
| HACSX | Harbor Ares Systematic Convertible Secu Fd Inst | 52.26% | 8.77% | -1.22% | N/A | N/A | 0.71% | $22,740,201.00 | Convertible Securities Funds |
| AGEYX | American Beacon Developing World Income Fund Y | 51.73% | 8.70% | N/A | N/A | N/A | 1.10% | $1,424,519,523.00 | Emerging Mrkts Hard Currency Debt Funds |
| EIDOX | Eaton Vance Emerging Markets Debt Opportunities I | 51.26% | 8.63% | N/A | N/A | 0.00 | 0.81% | $4,317,407,868.00 | Emerging Markets Local Currency Debt Fds |
| ANNPX | Virtus Convertible Fund Institutional | 48.78% | 8.27% | N/A | N/A | N/A | 0.71% | $1,388,744,693.00 | Convertible Securities Funds |
| BATPX | BATS: Interest Rate Hedge Series | 47.91% | 8.14% | 3.32% | -6.65 | 0.70 | 0.02% | $2,665,853.00 | Specialty Fixed Income Funds |
| GMDFX | GMO Emerging Country Debt Fund IV | 47.36% | 8.06% | 8.03% | N/A | 15.79 | 0.57% | $1,380,095,337.00 | Emerging Mrkts Hard Currency Debt Funds |
Start a Free Trial to See Full Rankings | View & Modify in Fund Screener
Download Visual | Modify in YCharts
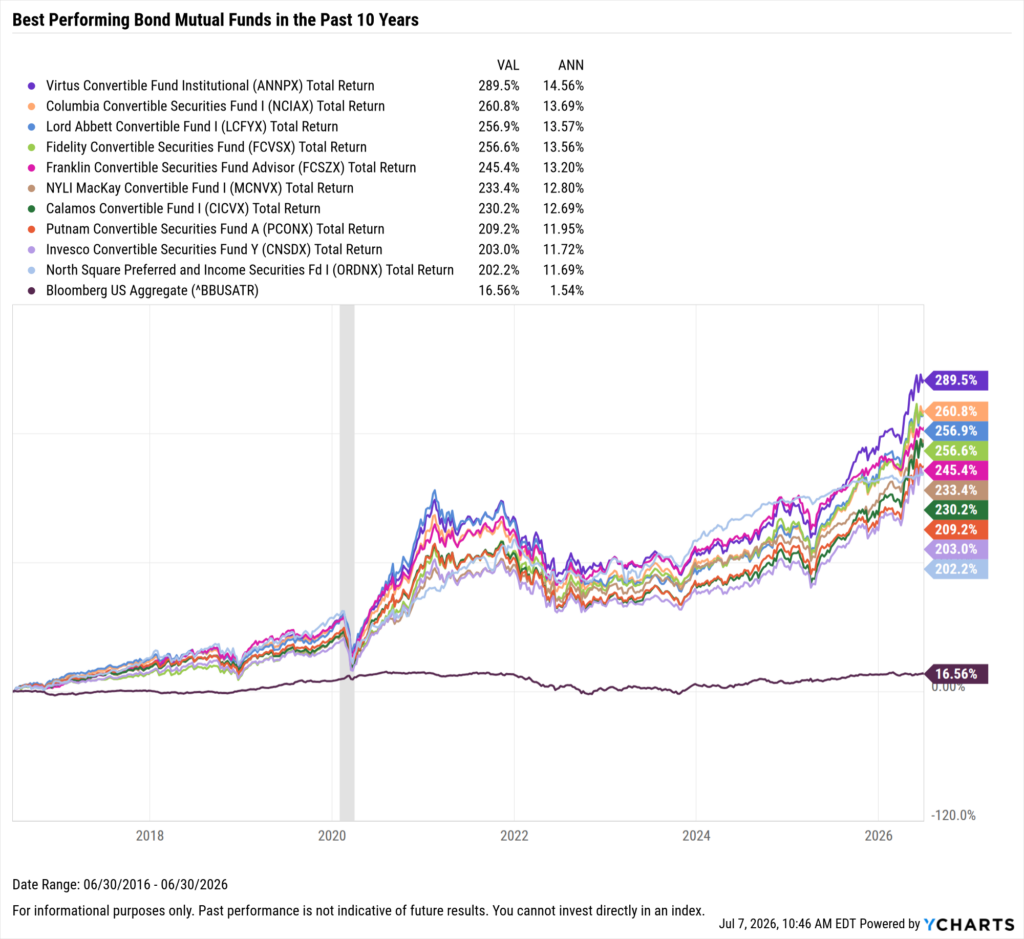
Best Performing Bond Mutual Funds in the Last 10 Years
These are the top-performing bond mutual funds on an annualized basis between July 1, 2016 and June 30, 2026.
| Symbol | Name | 10 Year Total Returns (Monthly) | Annualized 10 Year Total Returns (Monthly) | Yield to Maturity | Effective Duration | Effective Maturity | Net Expense Ratio | Share Class Assets Under Management | Peer Group Name |
|---|---|---|---|---|---|---|---|---|---|
| ANNPX | Virtus Convertible Fund Institutional | 289.46% | 14.56% | N/A | N/A | N/A | 0.71% | $1,388,744,693 | Convertible Securities Funds |
| NCIAX | Columbia Convertible Securities Fund I | 260.78% | 13.69% | N/A | N/A | N/A | 0.84% | $810,049,186 | Convertible Securities Funds |
| LCFYX | Lord Abbett Convertible Fund I | 256.90% | 13.57% | 4.01% | 0.01 | 0.00 | 0.90% | $416,007,624 | Convertible Securities Funds |
| FCVSX | Fidelity Convertible Securities Fund | 256.59% | 13.56% | N/A | N/A | N/A | 0.64% | $2,253,431,007 | Convertible Securities Funds |
| FCSZX | Franklin Convertible Securities Fund Advisor | 245.37% | 13.20% | -0.47% | 0.71 | N/A | 0.57% | $1,880,757,415 | Convertible Securities Funds |
| MCNVX | NYLI MacKay Convertible Fund I | 233.42% | 12.80% | N/A | 2.80 | N/A | 0.61% | $997,422,000 | Convertible Securities Funds |
| CICVX | Calamos Convertible Fund I | 230.24% | 12.69% | N/A | 1.62 | 3.84 | 0.89% | $818,120,000 | Convertible Securities Funds |
| PCONX | Putnam Convertible Securities Fund A | 209.22% | 11.95% | -5.22% | 1.23 | N/A | 1.01% | $403,927,247 | Convertible Securities Funds |
| CNSDX | Invesco Convertible Securities Fund Y | 203.01% | 11.72% | N/A | N/A | N/A | 0.71% | $265,041,635 | Convertible Securities Funds |
| ORDNX | North Square Preferred and Income Securities Fd I | 202.20% | 11.69% | N/A | N/A | N/A | 0.97% | $380,900,005 | Flexible Income Funds |
Start a Free Trial to See Full Rankings | View & Modify in Fund Screener
Download Visual | Modify in YCharts
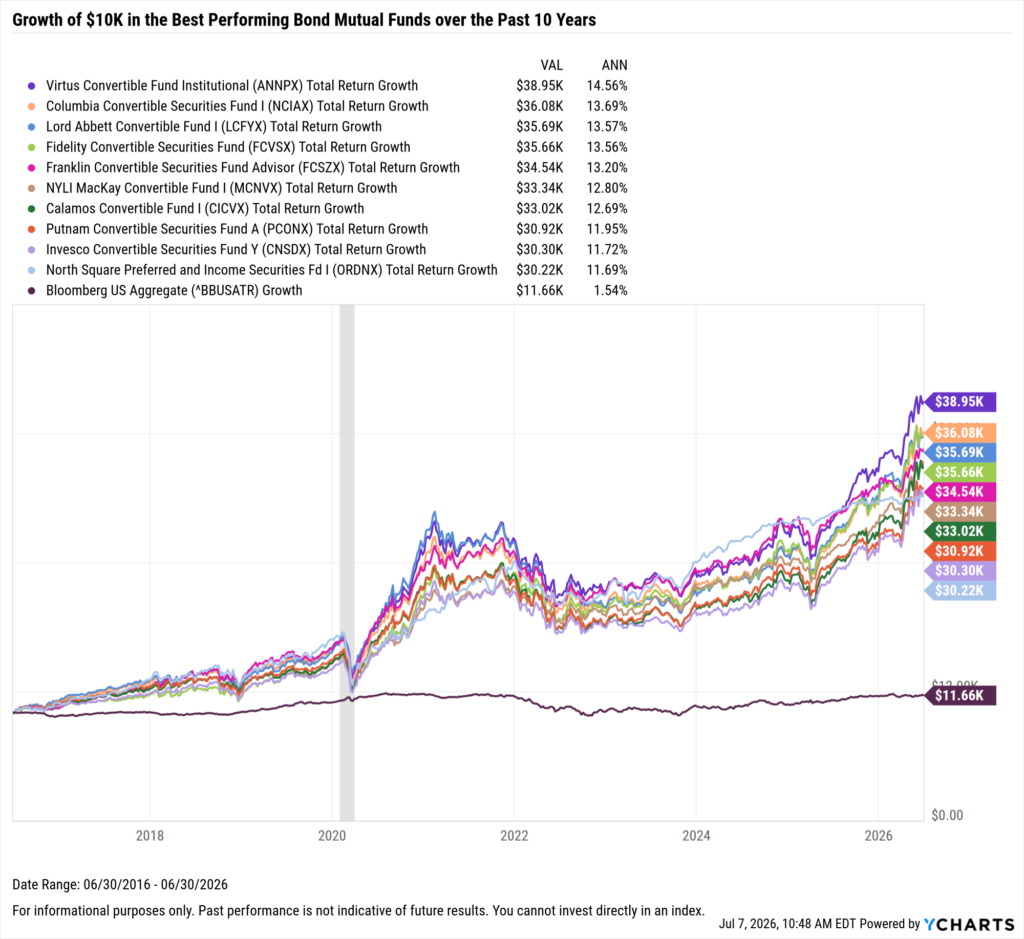
What Was the Growth of $10,000 in the Top Bond Mutual Funds Over the Last 10 Years?
The best-performing bond mutual fund in the last 10 years was the Catalyst/SMH High Income Fund I (ANNPX). A $10,000 investment into ANNPX 10 years ago would be worth $38,950 today on a total return basis. Right behind it was the Columbia Convertible Securities Funds I (NCIAX); investing $10,000 into this convertible fund back in 2016 would’ve turned into a little over $36K with dividend reinvestment.
However, investing $10,000 into a benchmark bond index such as the Bloomberg US Aggregate index netted a total return of just 16.56% over the last ten years, or 1.54% on an annualized basis. Investing in one of these broad bond indexes was not enough to beat inflation over the last decade.
Download Visual | Modify in YCharts
Whenever you’re ready, here’s how YCharts can help you:
1. Interested in doing further mutual fund research with YCharts?
2. Want to test out YCharts for free?
Start a no-risk 7-Day Free Trial.
3. Sign up for a copy of our Fund Flows Report and Visual Deck to stay on top of mutual fund trends:
Sign up to recieve a copy of our monthly Fund Flows Report:Disclaimer
©2026 YCharts, Inc. All Rights Reserved. YCharts, Inc. (“YCharts”) is not registered with the U.S. Securities and Exchange Commission (or with the securities regulatory authority or body of any state or any other jurisdiction) as an investment adviser, broker-dealer or in any other capacity, and does not purport to provide investment advice or make investment recommendations. This report has been generated through application of the analytical tools and data provided through ycharts.com and is intended solely to assist you or your investment or other adviser(s) in conducting investment research. You should not construe this report as an offer to buy or sell, as a solicitation of an offer to buy or sell, or as a recommendation to buy, sell, hold or trade, any security or other financial instrument. For further information regarding your use of this report, please go to: ycharts.com/about/disclosure.
Next Article
Monthly Market Wrap: June 2026Read More →